Cell Ranger7.1, printed on 03/27/2025
The cellranger multi pipeline outputs an interactive summary HTML file named web_summary.html that contains summary metrics and automated secondary analysis results. If an issue was detected during the pipeline run, an alert appears on this page. More information about alerts is provided in the Cell Ranger troubleshooting documentation. The web_summary.html file is also the starting point for quality control on experiments run through cellranger multi, introduced in Cell Ranger 6.0.
Cell Ranger v6.0 and later includes significant structural changes to the web_summary.html file output from the cellranger multi pipeline to improve the user experience when analyzing joint 5' Gene Expression + V(D)J data. If you are running Cell Ranger 6, refer to the Web Summary Transition Guide for help.
|
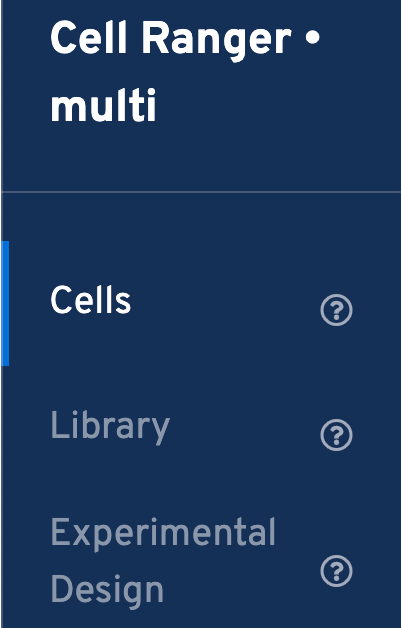
The cellranger multi pipeline’s web summary has three views: Cells, Library, and Experimental Design:
 |
|
The web summary is interactive. Users can zoom in on specific regions of certain graphs, choose a different clustering type for t-SNE projections, download images, or adjust the number of rows displayed for tables. Clicking the question mark ? symbol next to graphs and metrics provides detailed descriptions.
The Cells and Library views both have a Gene Expression tab, which displays tables and plots depending on the experimental design. There are also additional tabs and metrics associated with VDJ-T, VDJ-B, and Feature Barcode analysis (Antibody, CRISPR, Antigen).
The Experimental Design view has the same layout for all assay types. Click the question mark ? symbol to read descriptions for each section and metric.
The web summary layout for Gene Expression libraries is described here.
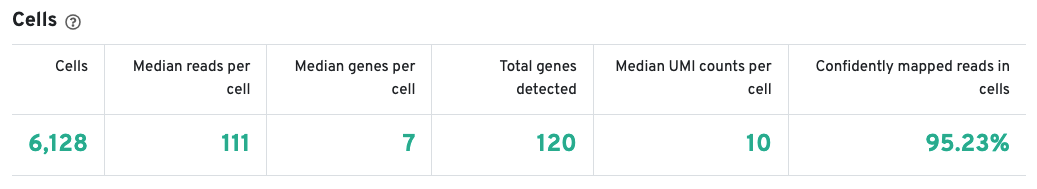
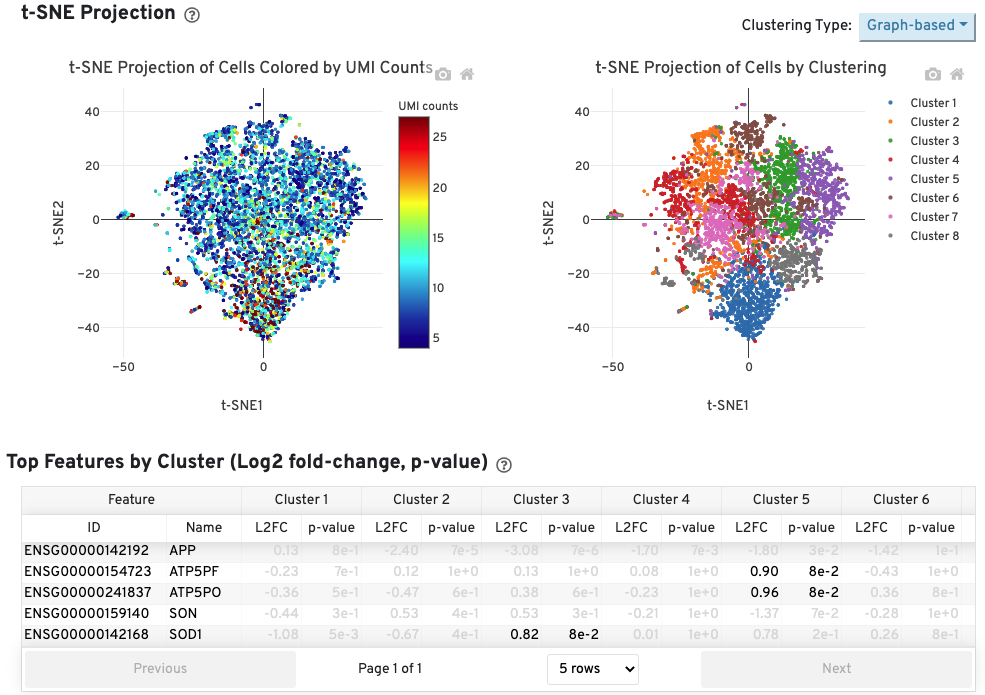
The Cells table contains the most important hero metrics for the sample. The t-SNE Projection section shows the data reduced to two dimensions, colored by UMI count or clustering (Graph-based by default). It is a good starting point to explore structure in the data. The Top Features by Cluster table shows the results of a differential gene expression analysis among clusters (Graph-based clusters by default). Click the question mark ? to read full descriptions for each one.
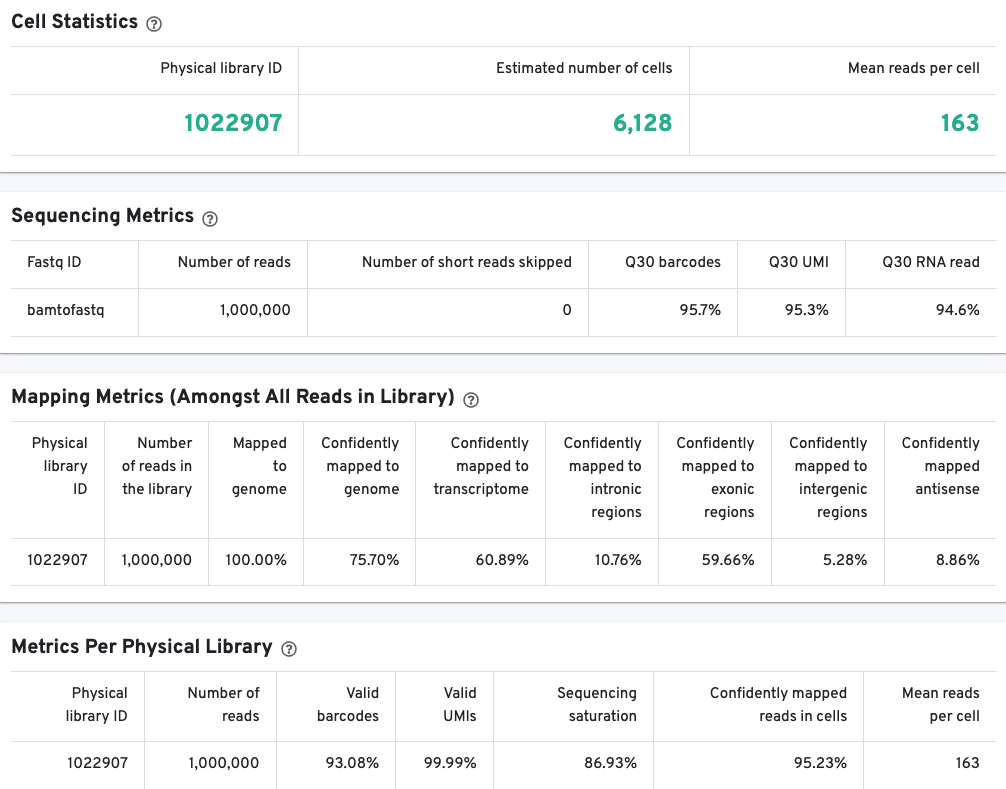
The library view contains metrics for the full library (cells and background). The Cell Statistics table displays the estimated number of cells (this number should align with "Cell" metric in the Gene Expression tab), and the mean number of sequenced read pairs per cell. Additional metrics are displayed below the hero metrics in the Sequencing Metrics, Mapping Metrics, and Metrics per Physical Library tables. Click the question mark ? to read full descriptions for each one.
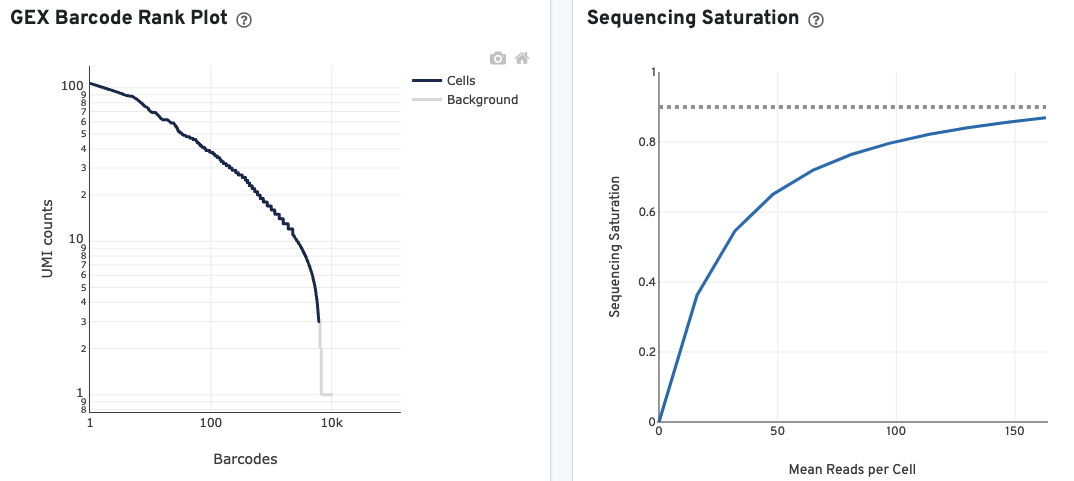
The GEX Barcode Rank Plot for the gene expression data enables one to assess library quality. Ideally, there is a steep drop-off separating high UMI count cells from low UMI count background noise. Read this Guided Tour of the Barcode Rank Plot for more details on its uses and interpretations.
The Sequencing Saturation plot allows the user to assess the relative trade-offs of sequencing deeper or shallower. As sequencing saturation increases, the total number of molecules detected in the library increases, but with diminishing returns as saturation is approached.
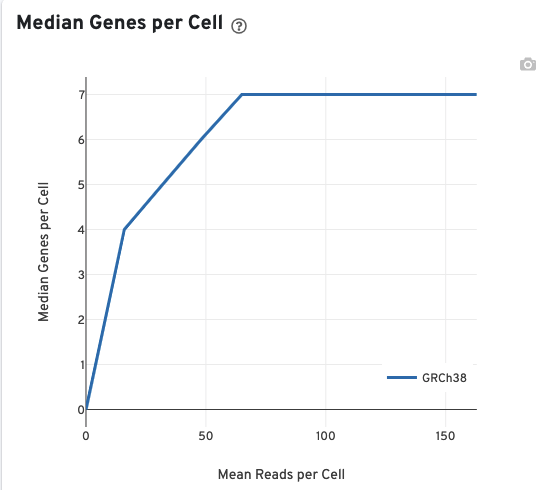
The Median Genes per Cell plot allows the user to assess the relative trade-offs of sequencing deeper or shallower. The slope of the curve near the endpoint can be interpreted as an upper bound to the benefit to be gained from increasing the sequencing depth beyond this point.
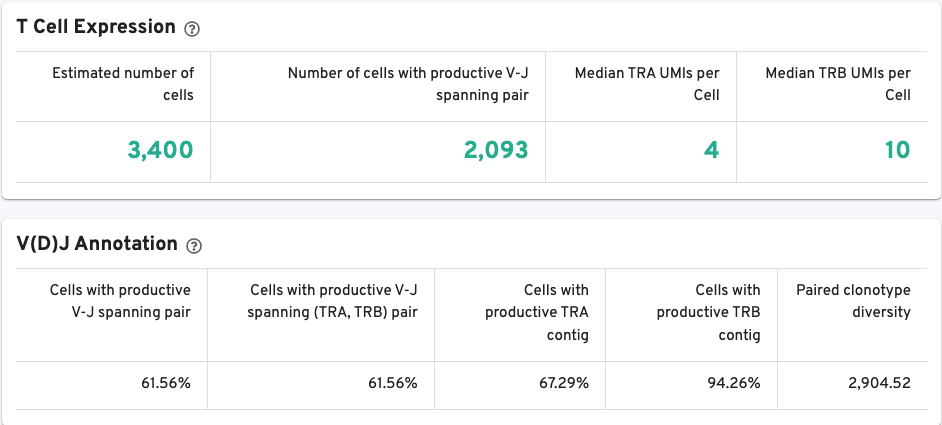
The VDJ-T and VDJ-B tabs have metadata and metrics for the T cell and B cell libraries, respectively. This section displays screenshots for the VDJ-T tab, however, it applies to the VDJ-B tab as well.
The T/B Cell Expression section contains metrics regarding T and B cell expression, and the V(D)J Annotation section contains metrics regarding V(D)J annotations.
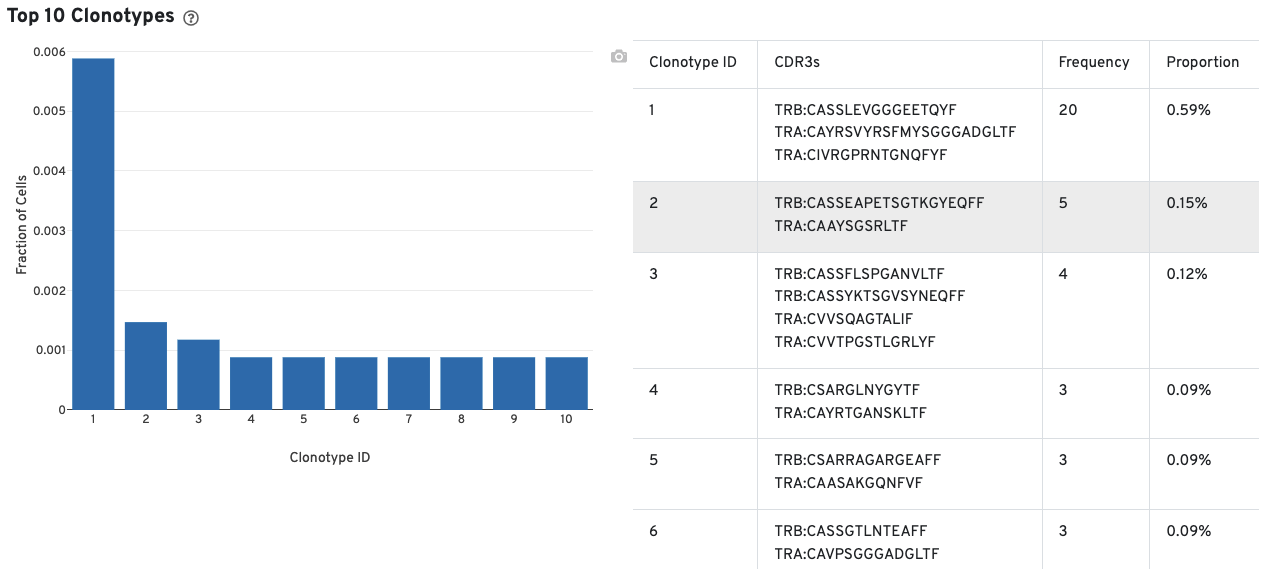
A histogram for the top 10 clonotypes and a list of their CDR3 sequences, frequencies, and proportion are also provided:
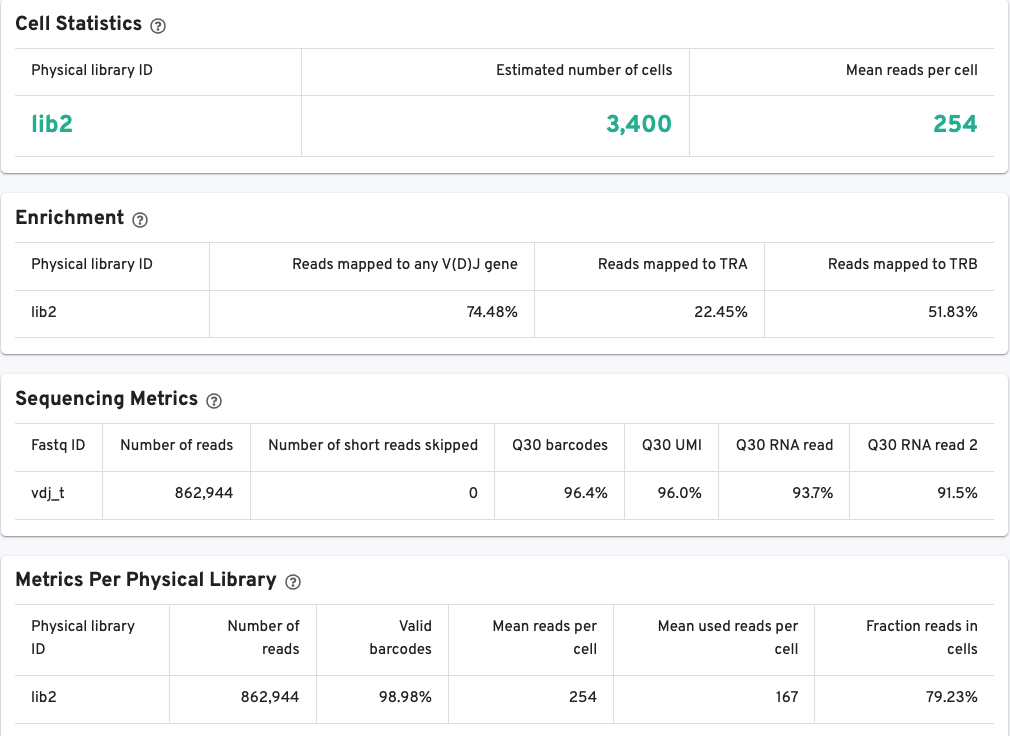
The library view contains metrics for the full library (cells and background), although the estimated number of cells is also reported here. Click the question mark ? to read full descriptions for each one. There are three main sections:
The Cell Statistics section provides summary statistics for the fraction of barcodes identified as cells.
The Enrichment section contains information about the V(D)J enrichment success based on the fraction of reads with valid barcodes that partially or wholly map to any germline V(D)J gene segment, alpha chains (TRA), beta chains (TRB), or heavy (IGH) and light chain segments (IGK, IGL) for B cells.
The Sequencing Metrics section provides metrics per sequencing run.
The V(D)J Barcode Rank Plot enables one to assess sample quality. Ideally, there is a steep dropoff separating high UMI count cells from low UMI count background noise:
Read this Guided Tour of the Barcode Rank Plot for more details on its uses and interpretations.
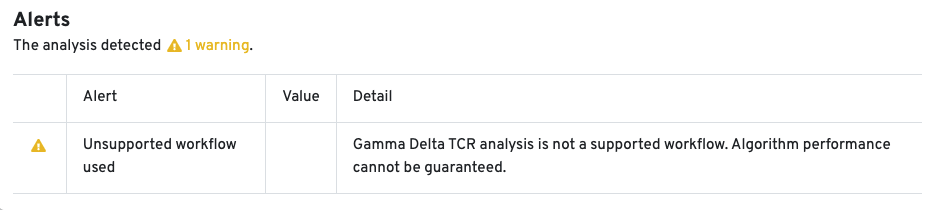
The cellranger multi pipeline allows users to analyze TCR libraries enriched for gamma (TRG) and delta (TRD) chains. If the cellranger multi run includes a gamma-delta enriched library, a new tab called VDJ-T(G/D) is created in the web_summary.html. The structure and contents of this tab are similar to the VDJ-T tab.
10x Genomics does not provide reagents or primers for TRG/D chain enrichment. Since this workflow is not fully supported, the Cell Ranger pipeline has not been extensively tested for TRG/D libraries, and the algorithm's performance cannot be guaranteed. An alert is displayed on the web_summary.html to indicate that the workflow is unsupported:
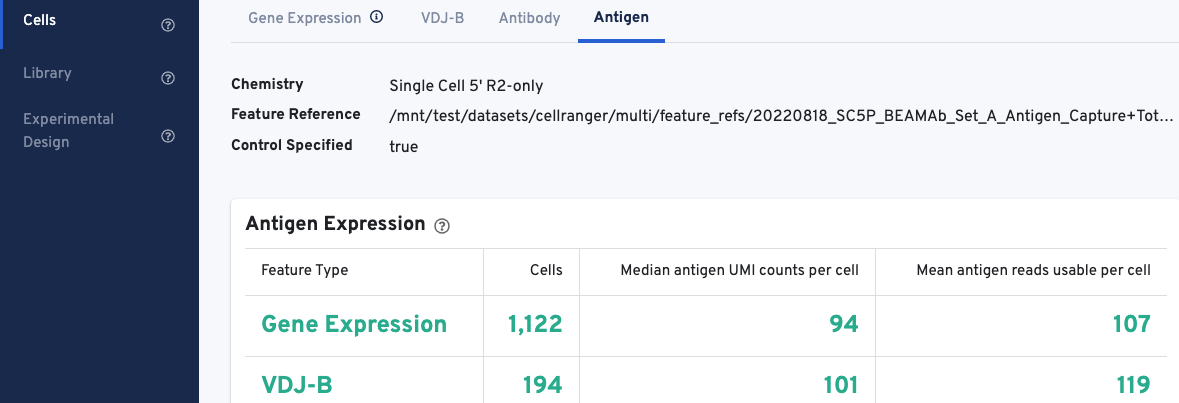
The web summary layout for Antigen Capture libraries is described here. All charts are interactive; hover over aspects of any chart or click on the ? next to the chart title for more infomration.
The Antigen Expression section displays metrics and metadata relevant to antigen specificity. It is important to note that V(D)J cell calls are a subset of Gene Expression cell calls, and antigen metrics are calculated for all cells (Gene Expression) vs. the subset of cells called as V(D)J. The number of cells called for each feature type should align with cell calls displayed in the Gene Expression and VDJ-T/B tabs.
The Antigen Expression section also shows the number of antigen UMIs obtained from cells called for Gene Expression vs. V(D)J cells, and the mean number of usable reads (valid UMI, recognized antigen-barcode) sequenced from cells.
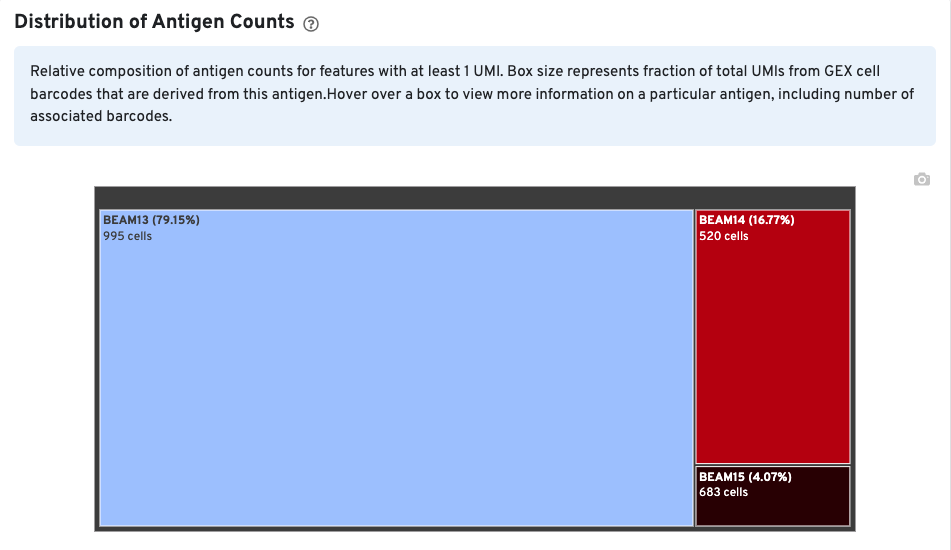
The Distribution of Antigen Counts plot shows the relative composition of antigen counts for antigens with at least one UMI. The box size is proportional to the fraction of total UMIs from Gene Expression cell barcodes that are derived from this antigen. Hovering over a box provides more information about the antigen, including the percentage of cell-associated Gene Expression/V(D)J barcodes for the antigen. In this example, the antigen BEAM 13 has at least one UMI in 995 Gene Expression cells and is expressed in 79.15% of cells expressing at least one antigen UMI.
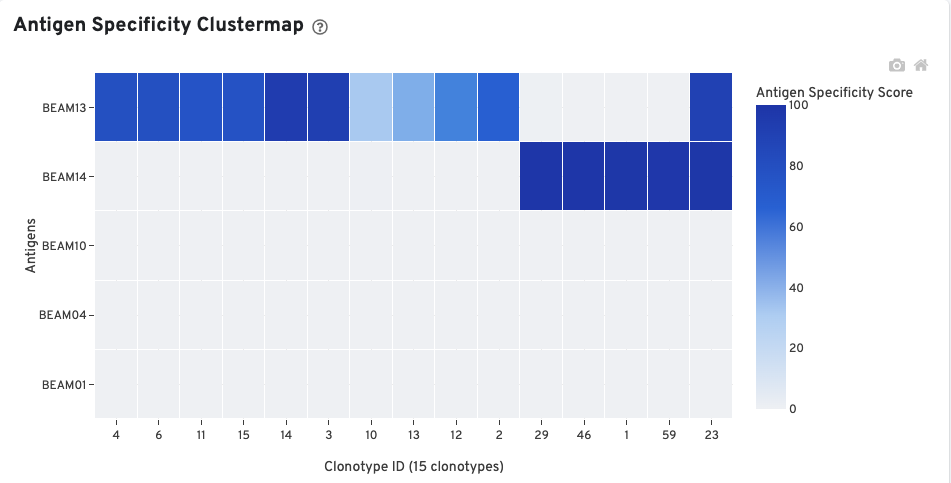
The Antigen Specificity Clustermap is a hierarchically-clustered heatmap showing the antigen specificity for 15 clonotypes out of 90 clonotypes in this sample. For each antigen with >0 cellular UMI counts, up to 10 clonotypes (ordered by size) having a median antigen specificity score >25 are selected. The set of all such clonotypes across the antigens is shown on the x-axis.
The library view contains graphs and metrics for the full antigen library (cells and background barcodes).
In the Histogram of Antigen Counts, antigen UMI counts on the log scale (X-axis) are plotted against the number of cells (Y-axis).
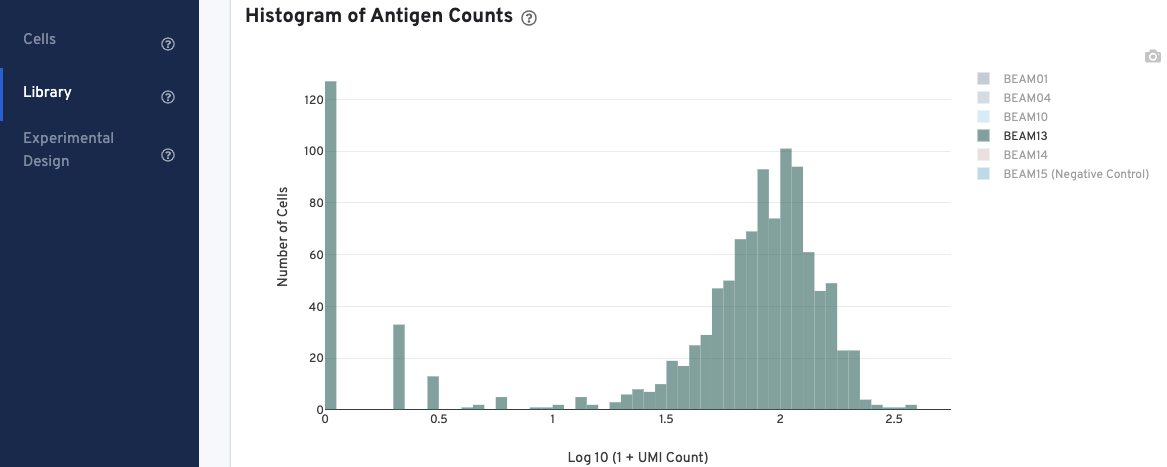
The histogram is color-coded by antigen UMI counts, and a legend is provided on the top right. Hovering over the different colors on any given bar brings up more information about that specific antigen, including the number and fraction of UMI counts associated with that antigen. Click on the legend to select or deselect specific antigens for display.
The Sequencing Metrics shows the total number of read pairs sequenced. The Q30 barcodes column shows the fraction of cell barcode bases with Q-score >= 30, excluding very low quality/no-call (Q <= 2) bases from the denominator. The Q30 UMI column Fraction of UMI bases with Q-score >= 30, excluding very low quality/no-call (Q <= 2) bases from the denominator. Finally, the Q30 RNA read shows the fraction of RNA Read bases with Q-score >= 30, excluding very low quality/no-call (Q <= 2) bases from the denominator.
The Metrics Per Physical Library gives a snapshot of the antigen library quality.
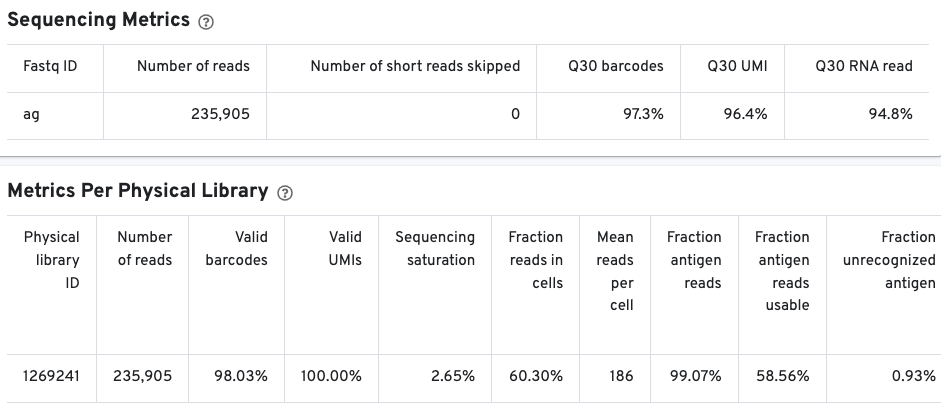
Pay special attention to the fraction antigen reads usable and the fraction unrecognized antigen columns. The fraction antigen reads usable metric shows the fraction of read pairs that contain a recognized antigen barcode, a valid UMI, and a cell-associated barcode. The fraction unrecognized antigen metric provides a measure of potential contamination or Feature Reference error by showing the fraction of read pairs with an unrecognized antigen-barcode sequence. The fraction antigen reads in aggregate barcodes metric may also be important to determine the fraction of antigen reads that were lost due to the removal of barcodes containing aggregates.
The AG Barcode Rank Plot shows count of filtered UMIs mapped to each barcode.
![]()
Antibody and CRISPR web summary tabs have been described on the corresponding 3' Single Cell Gene Expression Feature Barcode section.
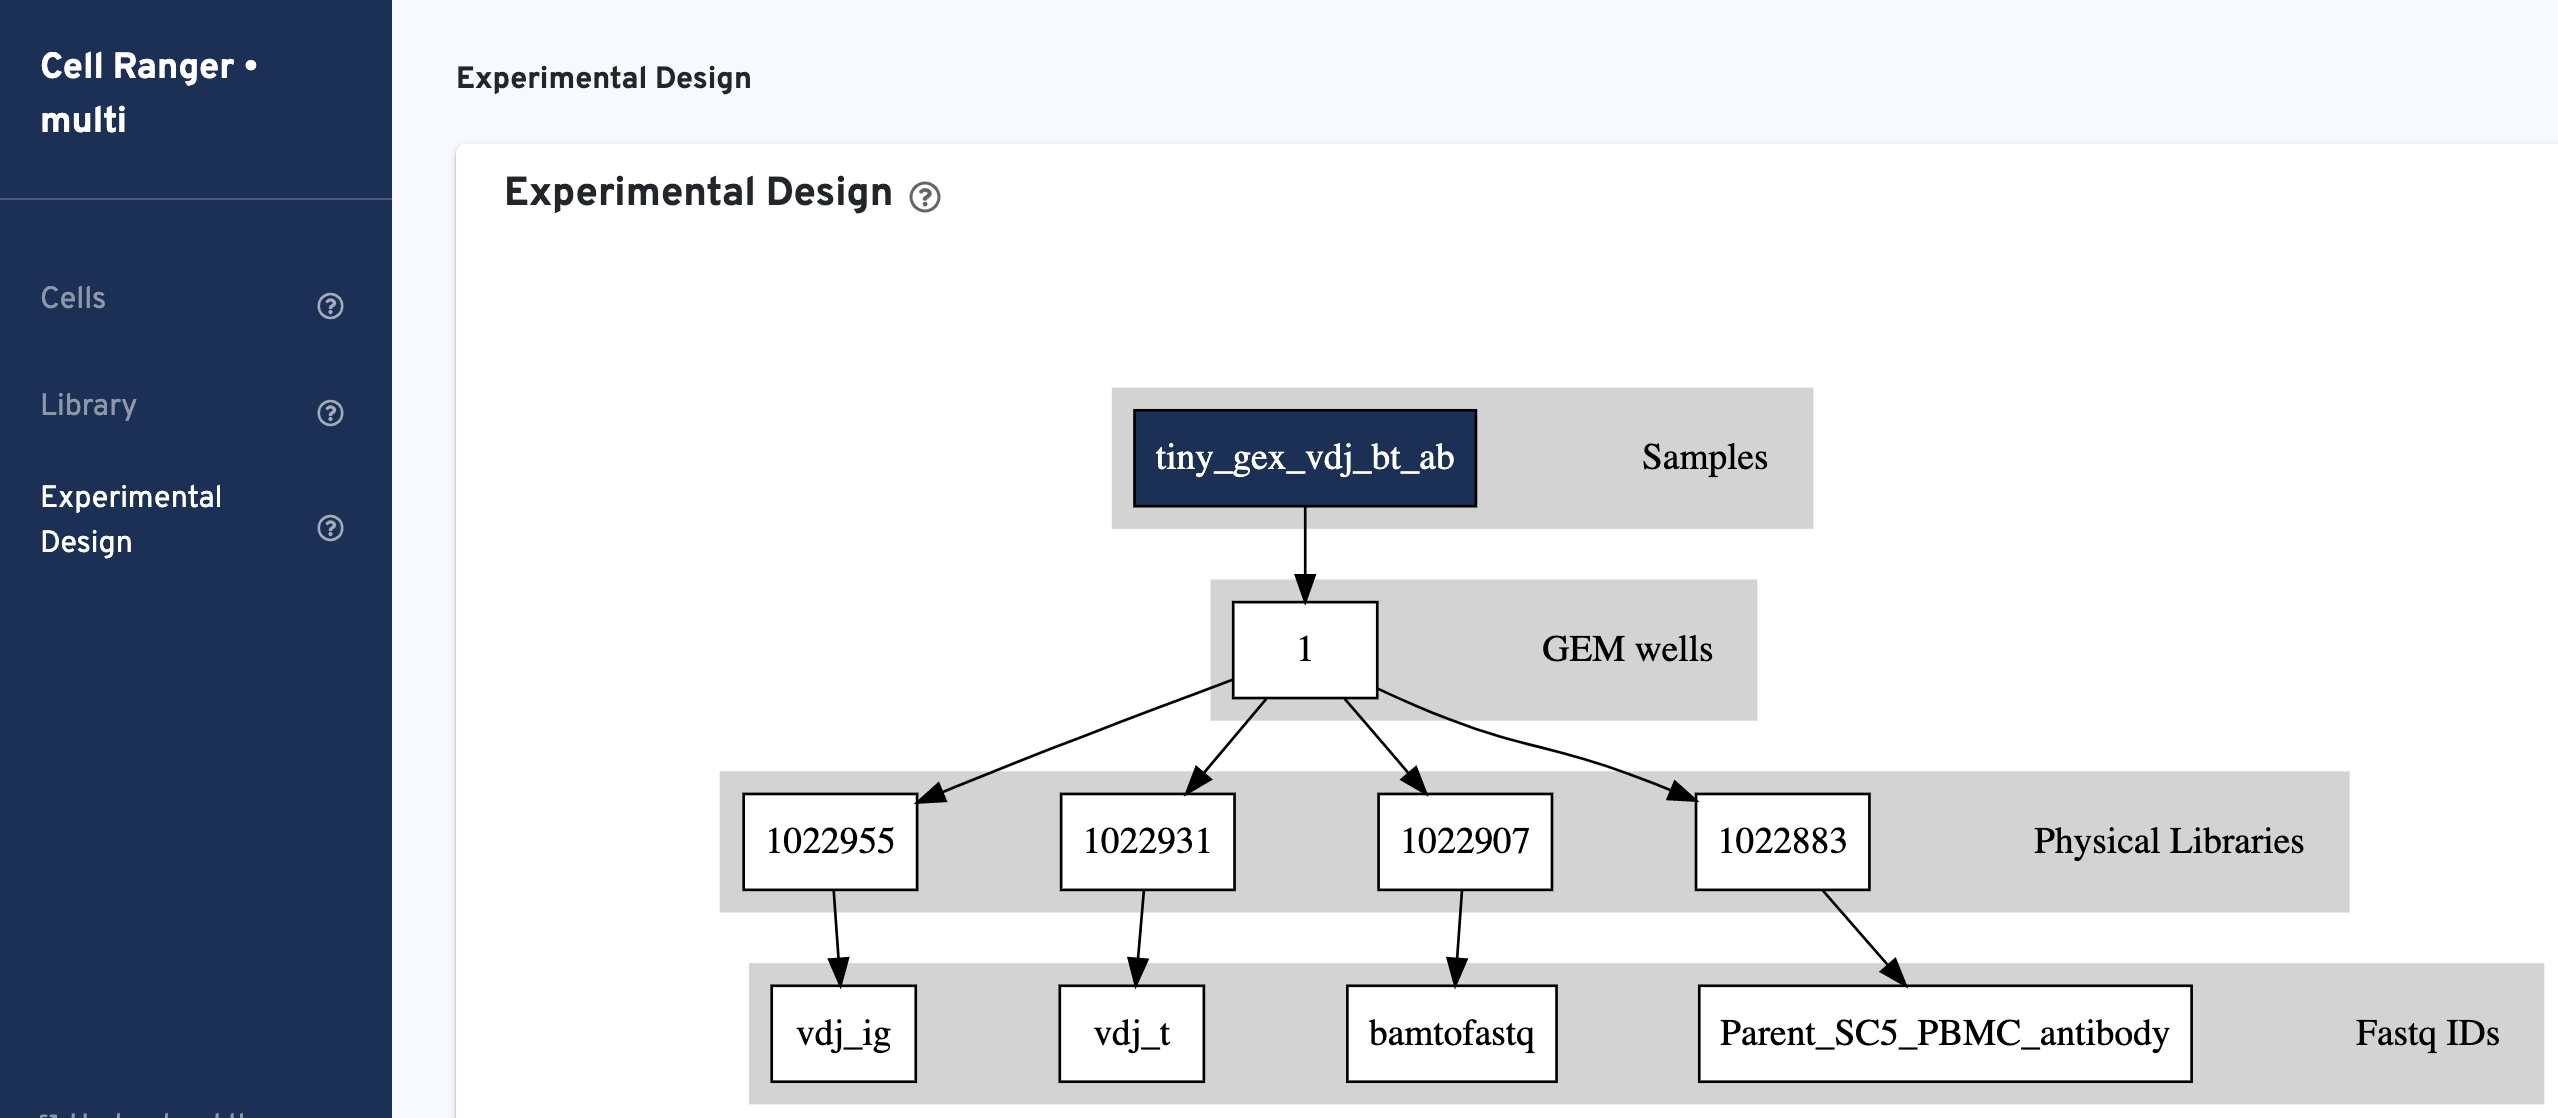
Experimental Design view shows the experimental design for the dataset:
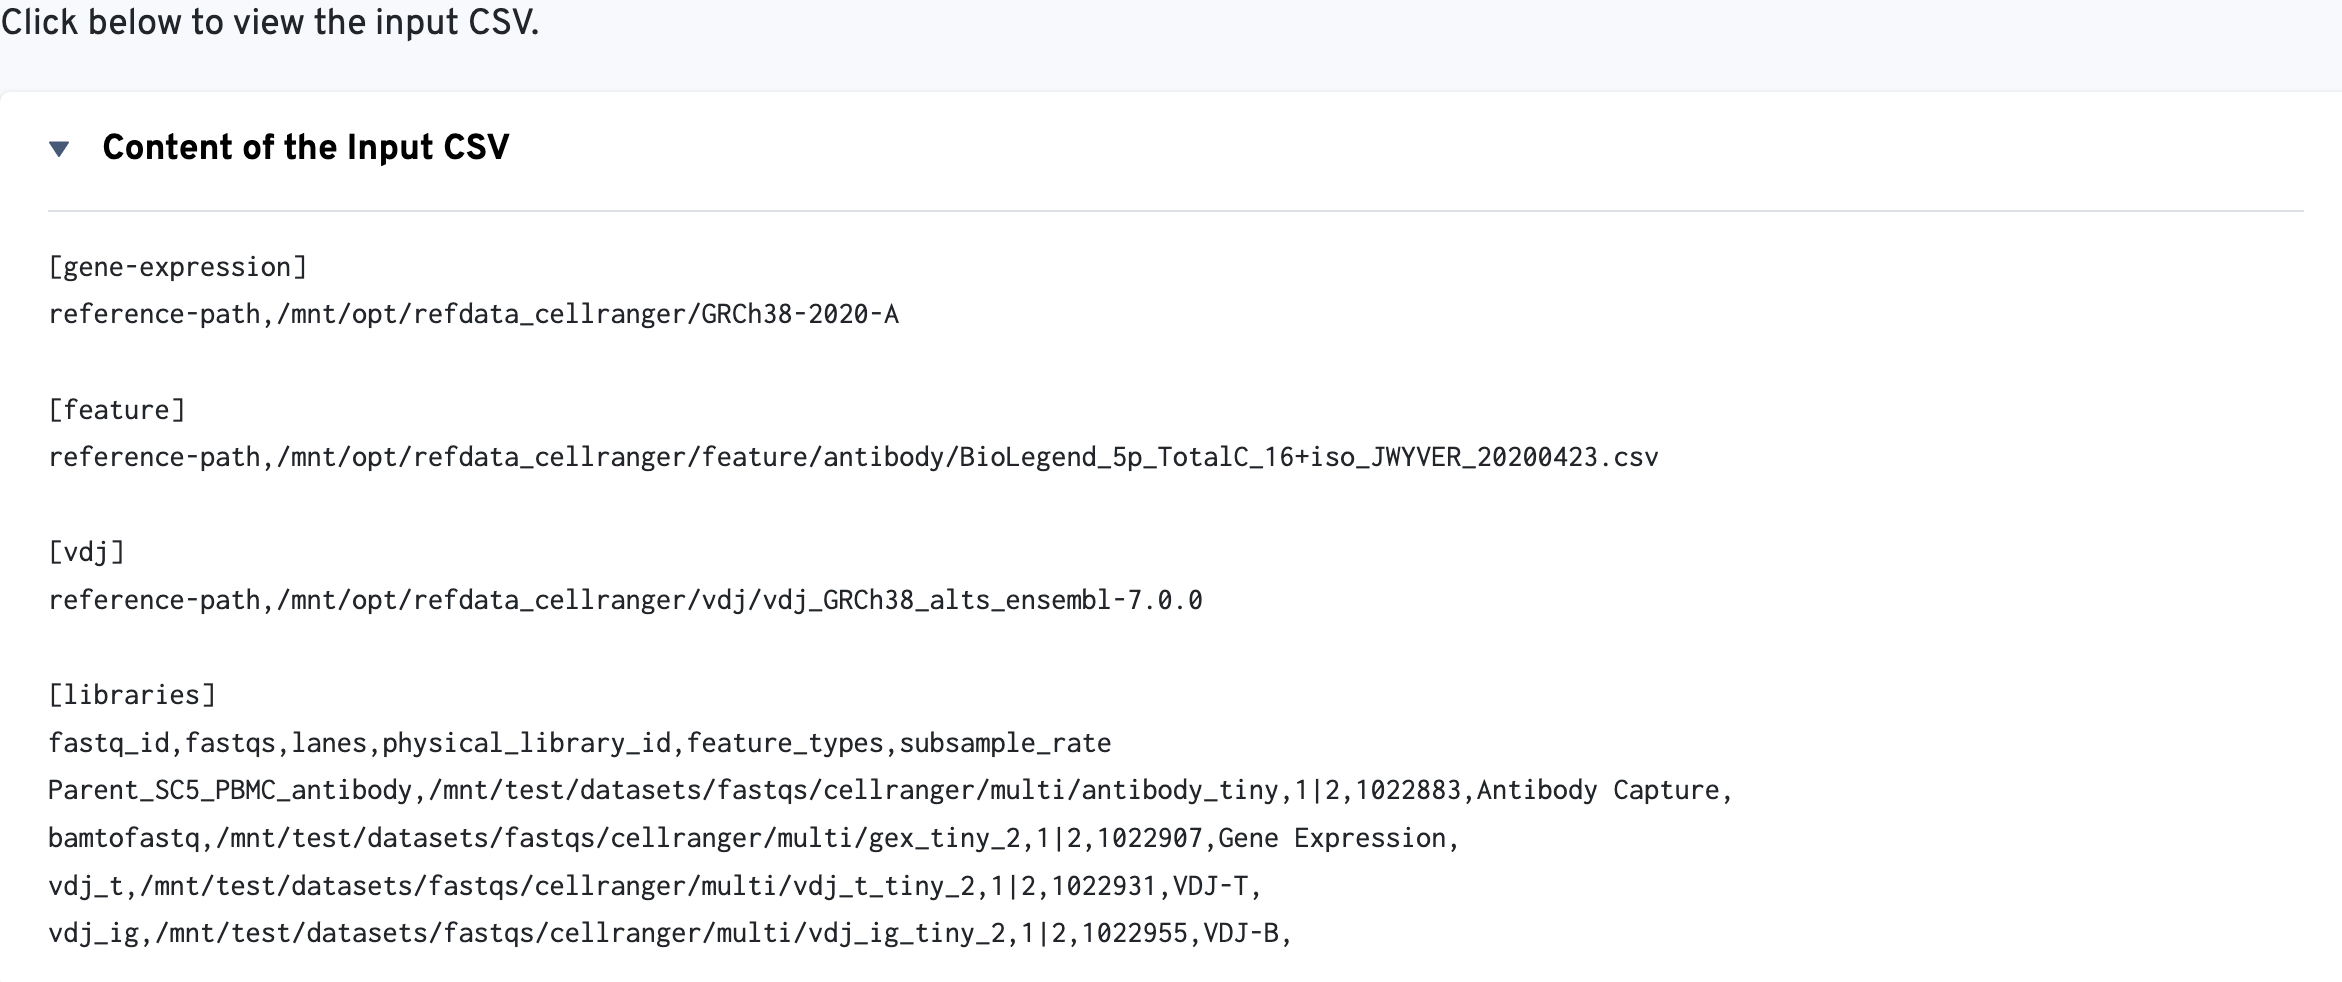
The multi config CSV file is also included for troubleshooting convenience:
Visit the Summary Metrics page to understand the metrics_summary.csv output file.
If you have any questions or feedback, please contact support@10xgenomics.com.
multi/ outputs directoryper_samples_outs/ outputs directory