Cell Ranger7.1, printed on 03/27/2025
Cell Ranger makes it possible to measure Immune Profiling and Gene Expression data along with additional analytes using Feature Barcode technology. This allows users to assess other cell features such as cell surface marker expression (Antibody Capture) or Antigen Capture to complement the Gene Expression and Immune Profile data.
To see an example of the integrated analysis of Immune Profiling data with Gene Expression and Antibody Capture (labeled withTotalSeq™-C barcoded antibodies), download the files from the link below:
This dataset was generated using roughly 8,000 PBMCs labeled with a panel of 17 TotalSeq™-C antibodies.
The .cloupe file below shows a conventional gene expression t-SNE plot:
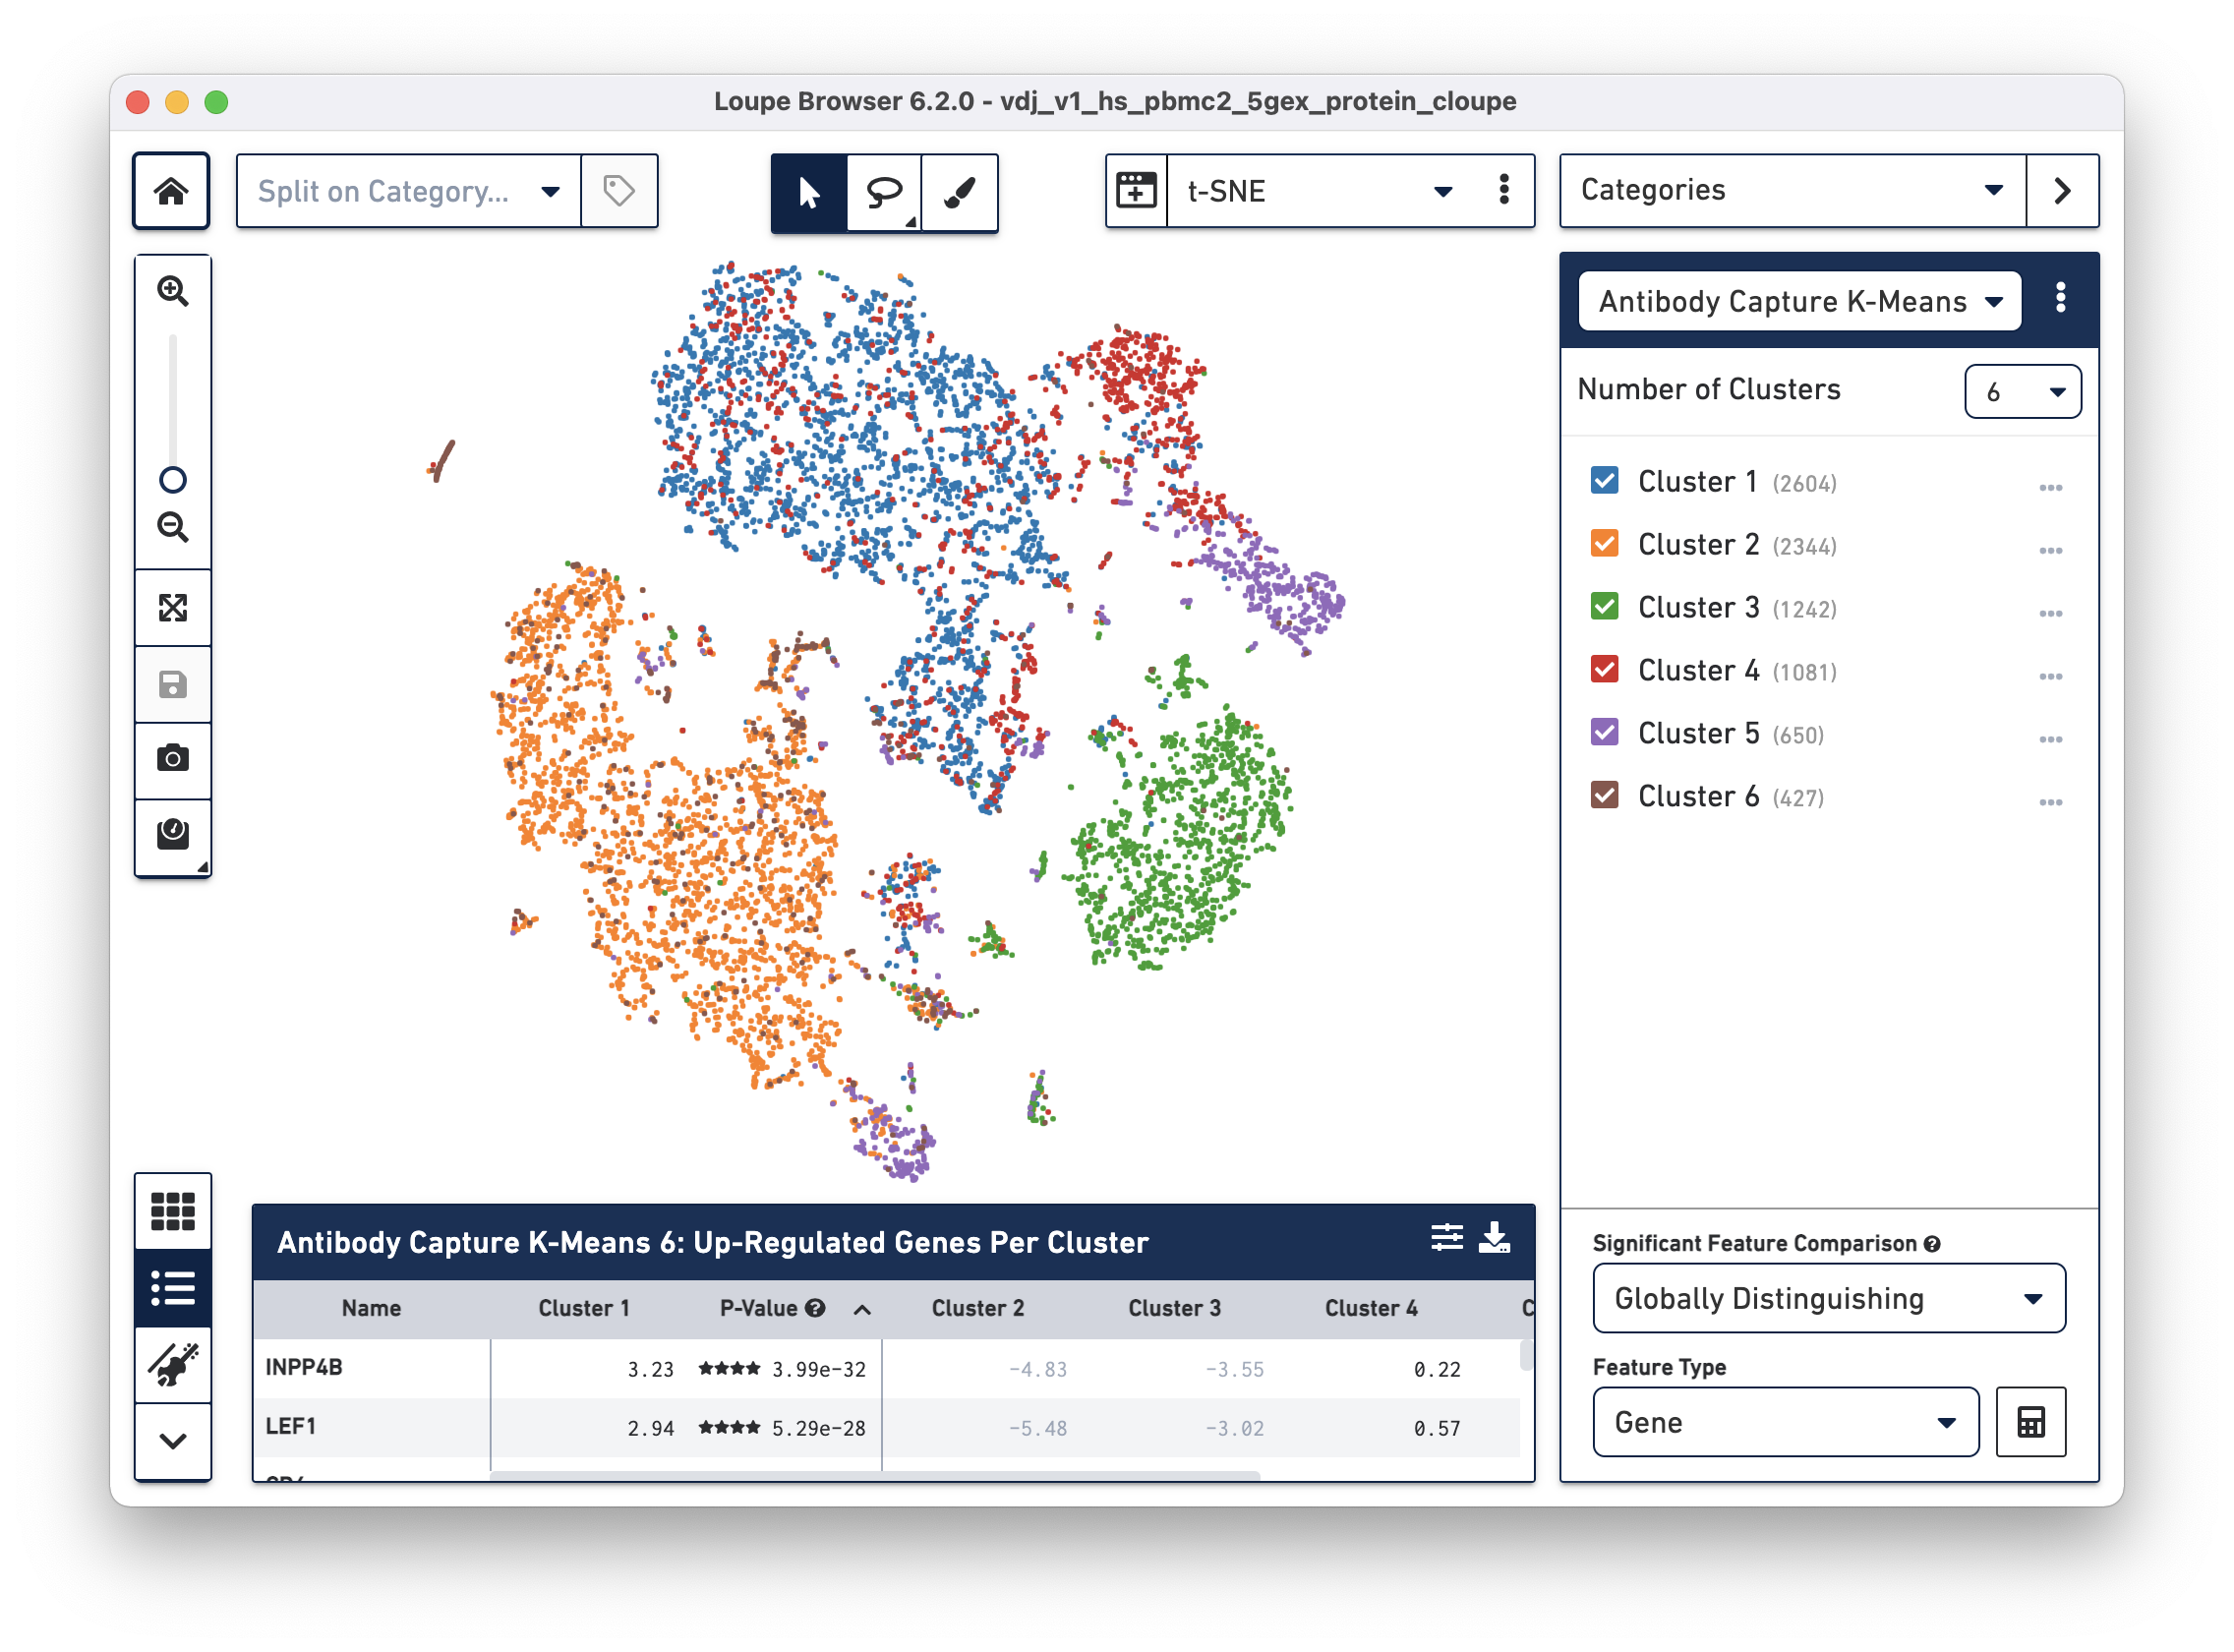
The additional cell surface marker expression data can be used to create new plots in Loupe Browser to more precisely identify markers of interest.
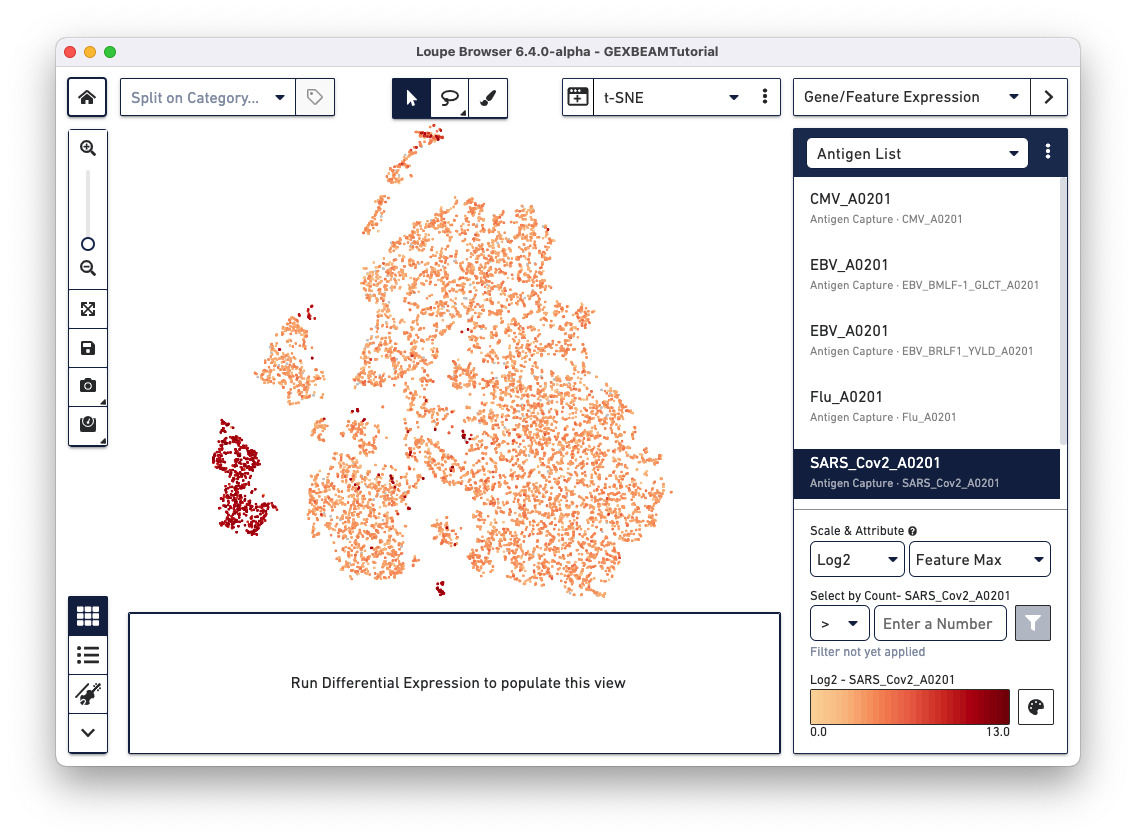
If your dataset has an Antigen Capture (BEAM) library, the Gene/Feature Expression section has an additional option called Antigen List that comes pre-populates with the list of antigens included in your TCR Antigen Capture (BEAM-T) or BCR Antigen Capture (BEAM-Ab) experiment. Clicking on specific antigens in the list, colors cells in the active plot by antigen UMI count.
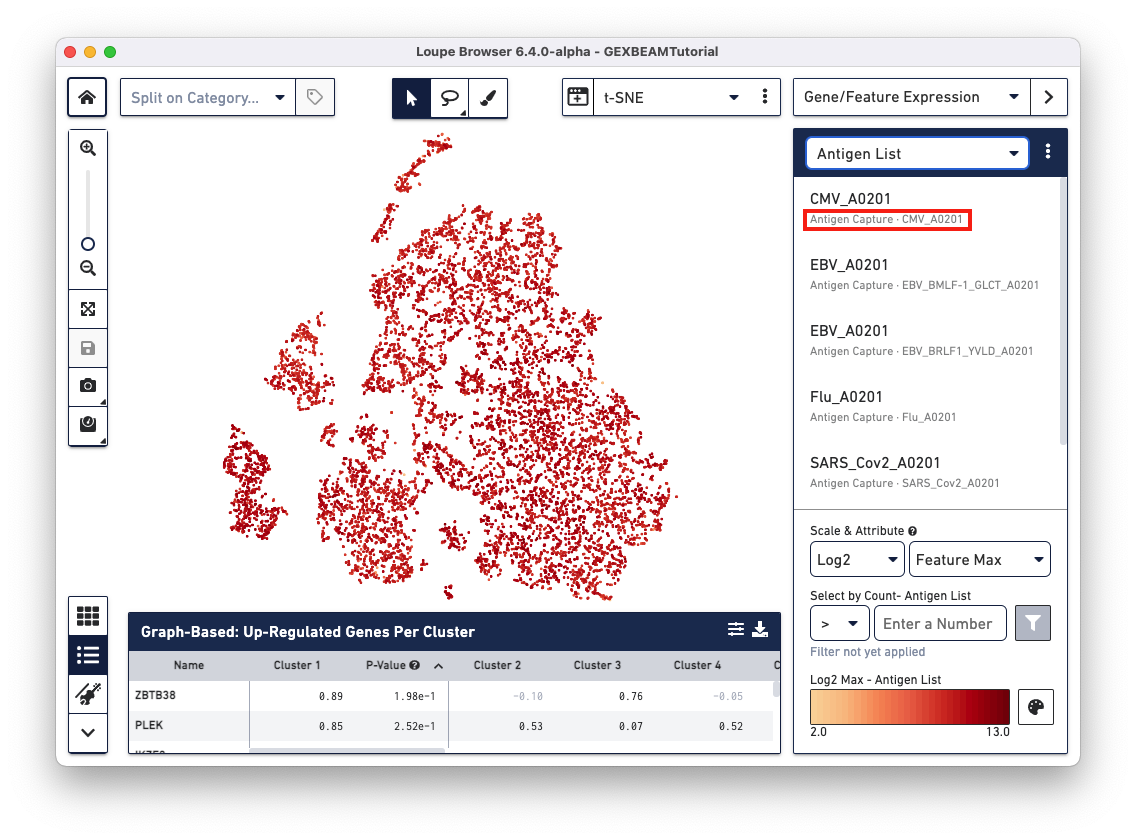
Loupe Browser v6.4 and Loupe V(D)J Browser v5.0 extract antigen names from the Feature Reference CSV. These names cannot be changed via the browser interface. In the Feature Reference CSV used to create this example .cloupe file, the id and name fields have the same entry per antigen. In Loupe Browser, the name field from the Feature Reference corresponds to the antigen name in grey (as shown below):
Loupe Browser 3.0 and later has a Feature Plot option that plots cell barcodes by the expression of one or two features, which makes it easy to threshold cell populations by expression levels, particularly for features with high dynamic range, such as cell surface markers.
To identify CD4+ T cells and CD8+ T cells, select Feature Plot in the projection dropdown. This will switch the axes from t-SNE axes to feature axes. Both the feature to plot and the scale (linear or log) of the axis can be changed using the selectors atop the Y axis and on the right side of the X axis.
Change the Y axis to plot the CD3_TotalSeqC surface marker expression, and
click the button next to the feature selector to select a log scale. See the
representative graph below:
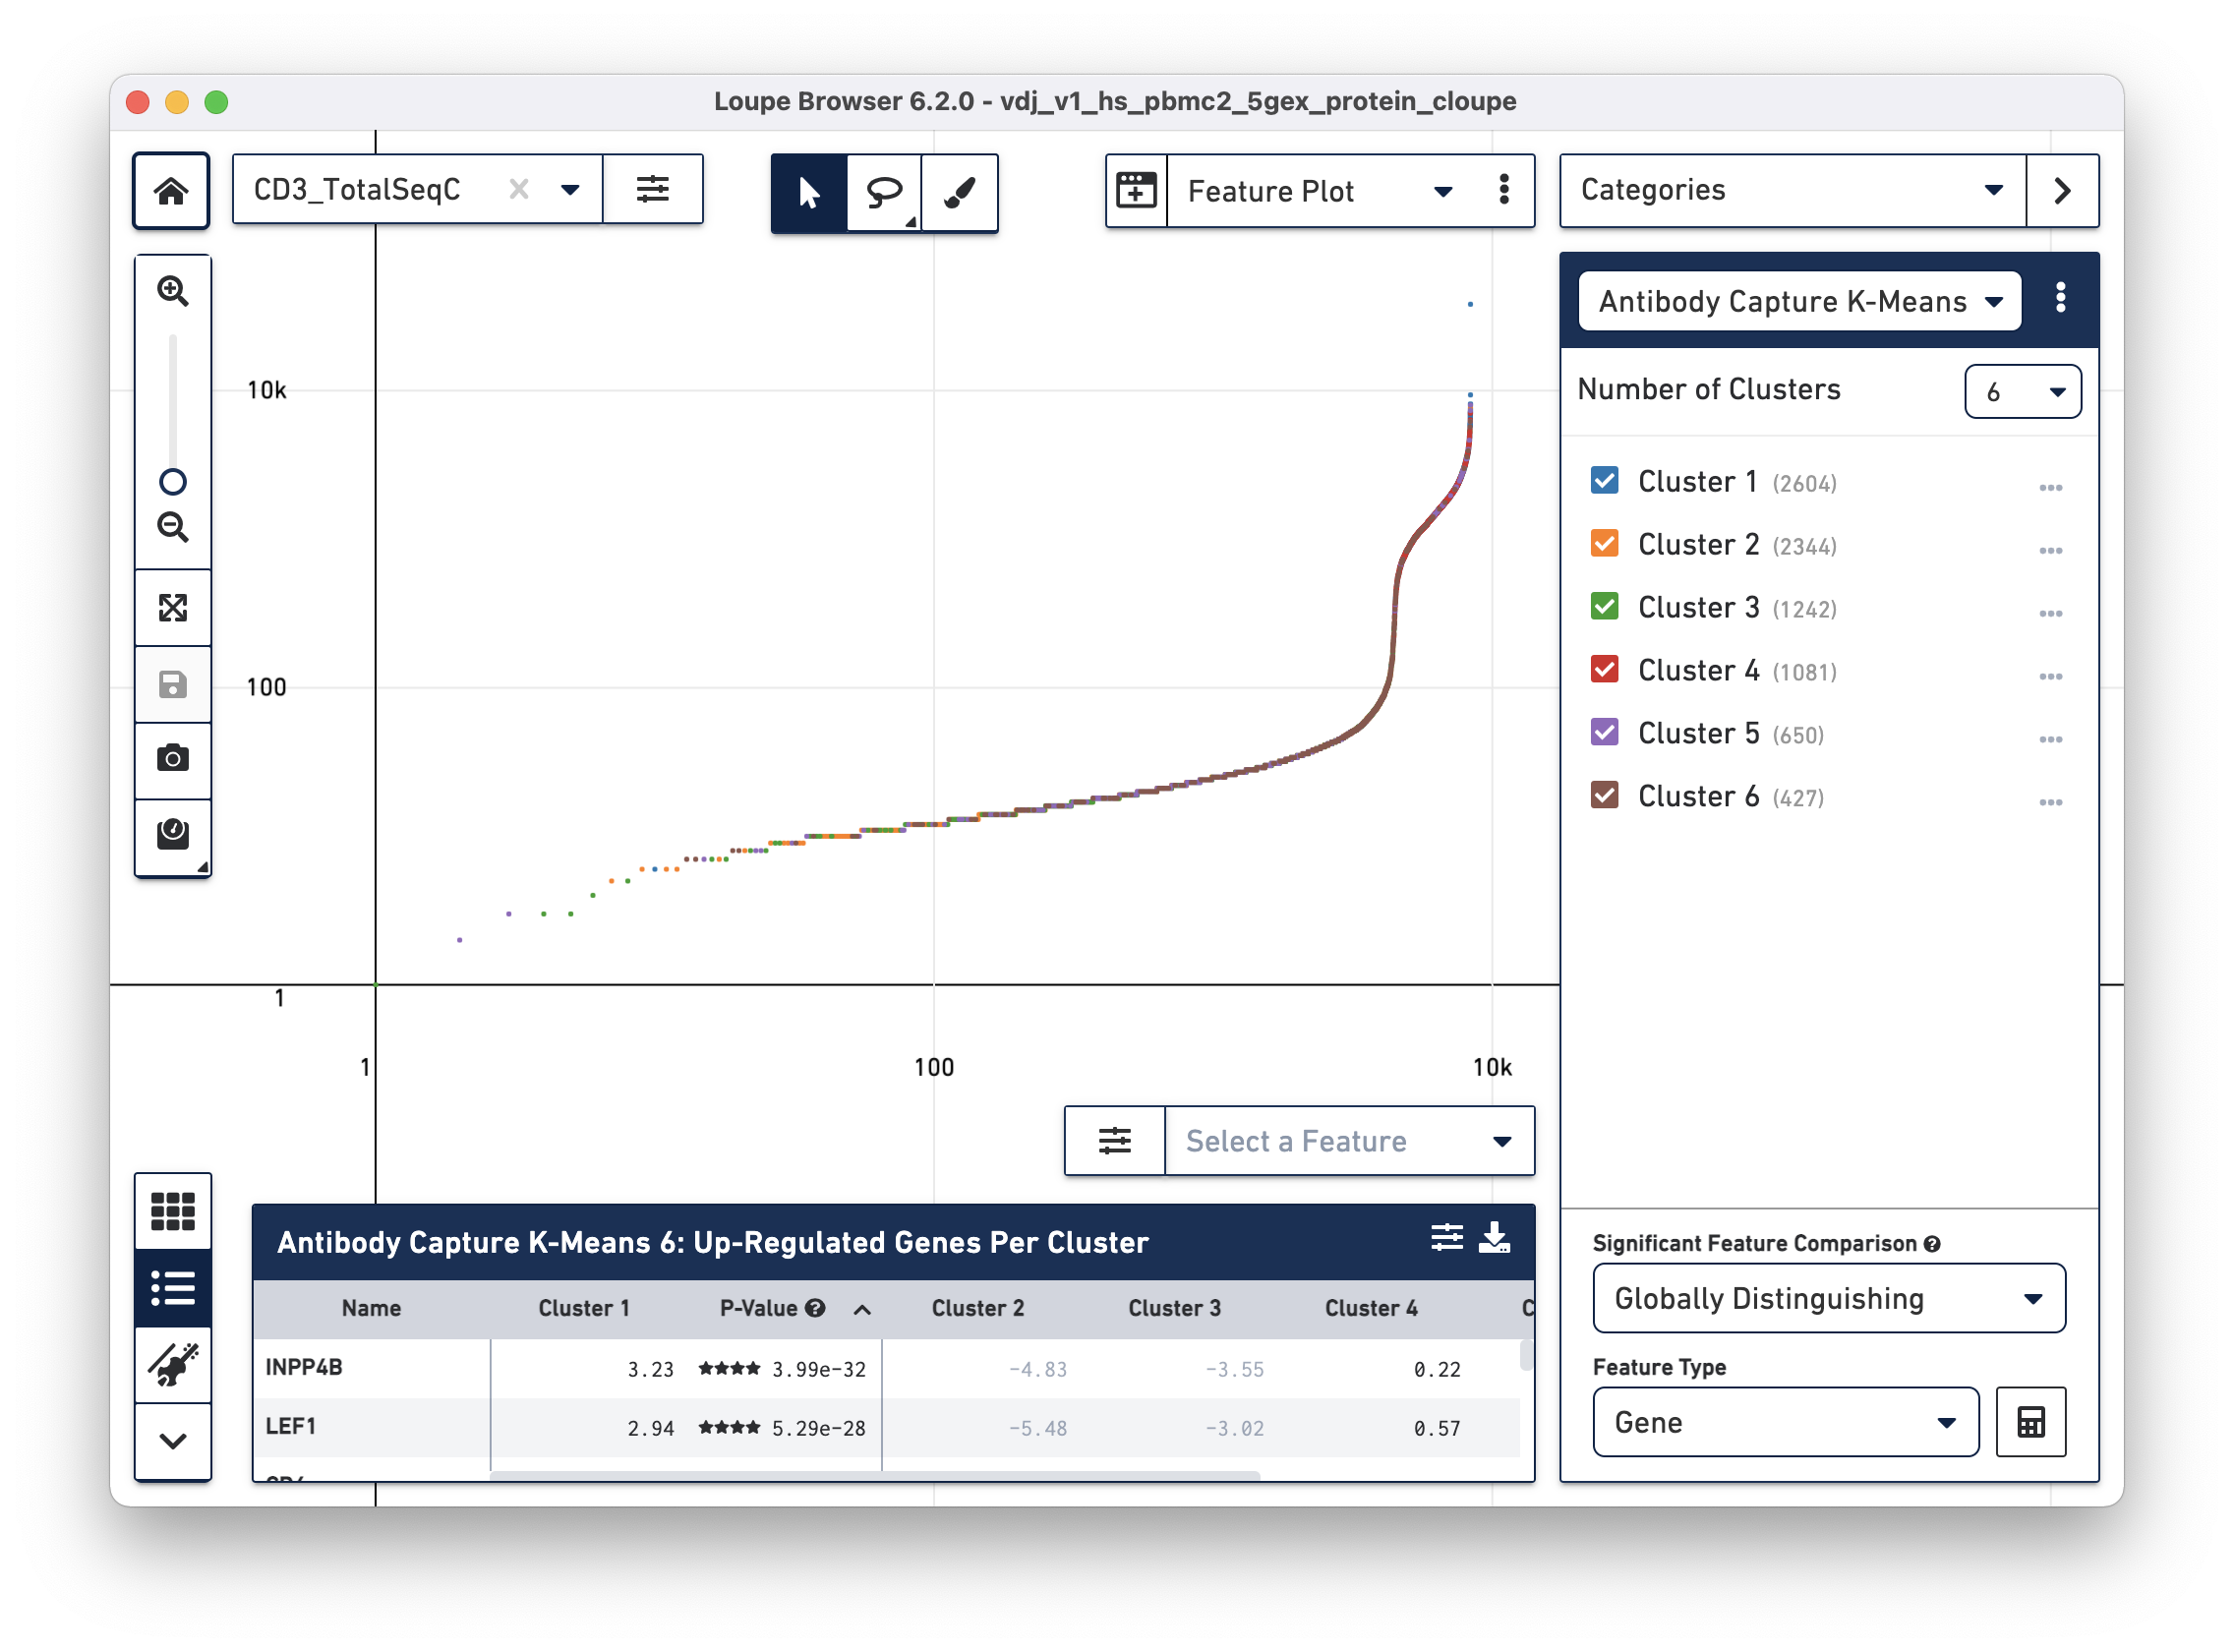
Several inflection points are seen in the curve. Around the 4200th cell on the X axis, the counts per cell increase dramatically; this is a representative threshold for CD3+ cells.
Another feature may be plotted on the X axis by choosing the CD4_TotalSeqC
antibody feature and log scale for the X axis (as well as coloring by total cell
surface marker expression per cell -- Antibody Capture Sum). See the
representative graph below:
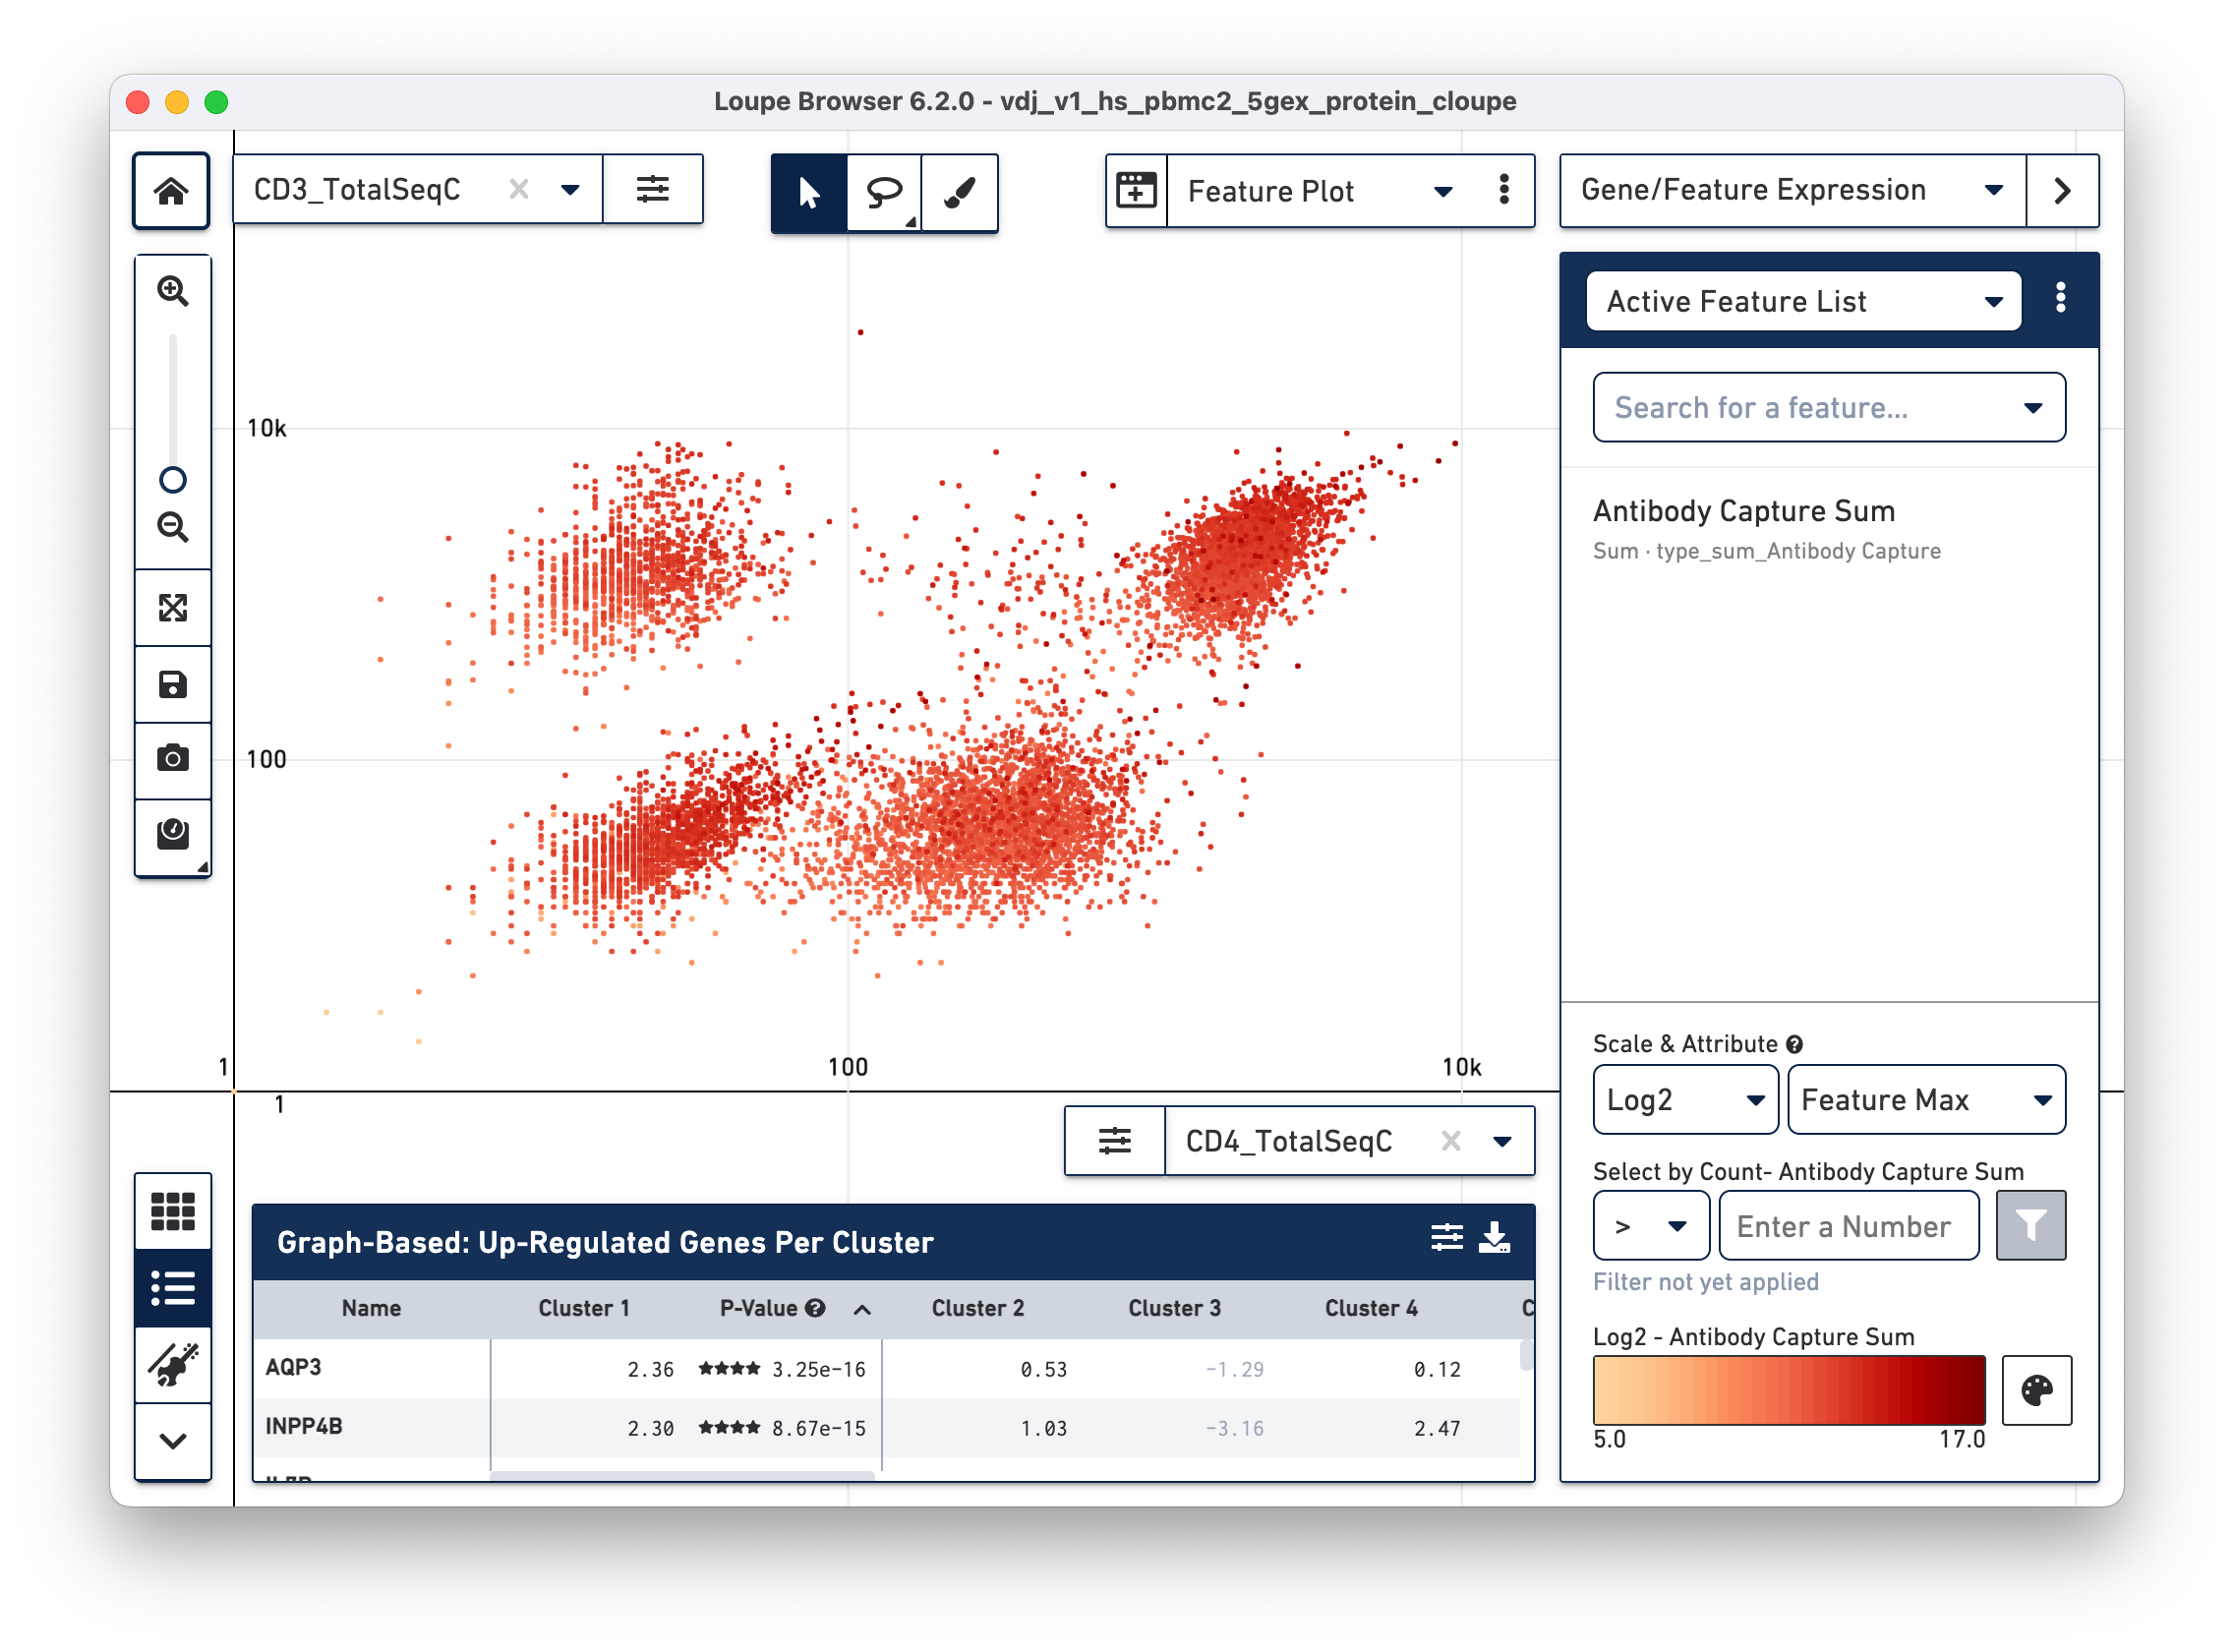
CD4+ helper T cells with high CD4 surface marker expression are at top right.
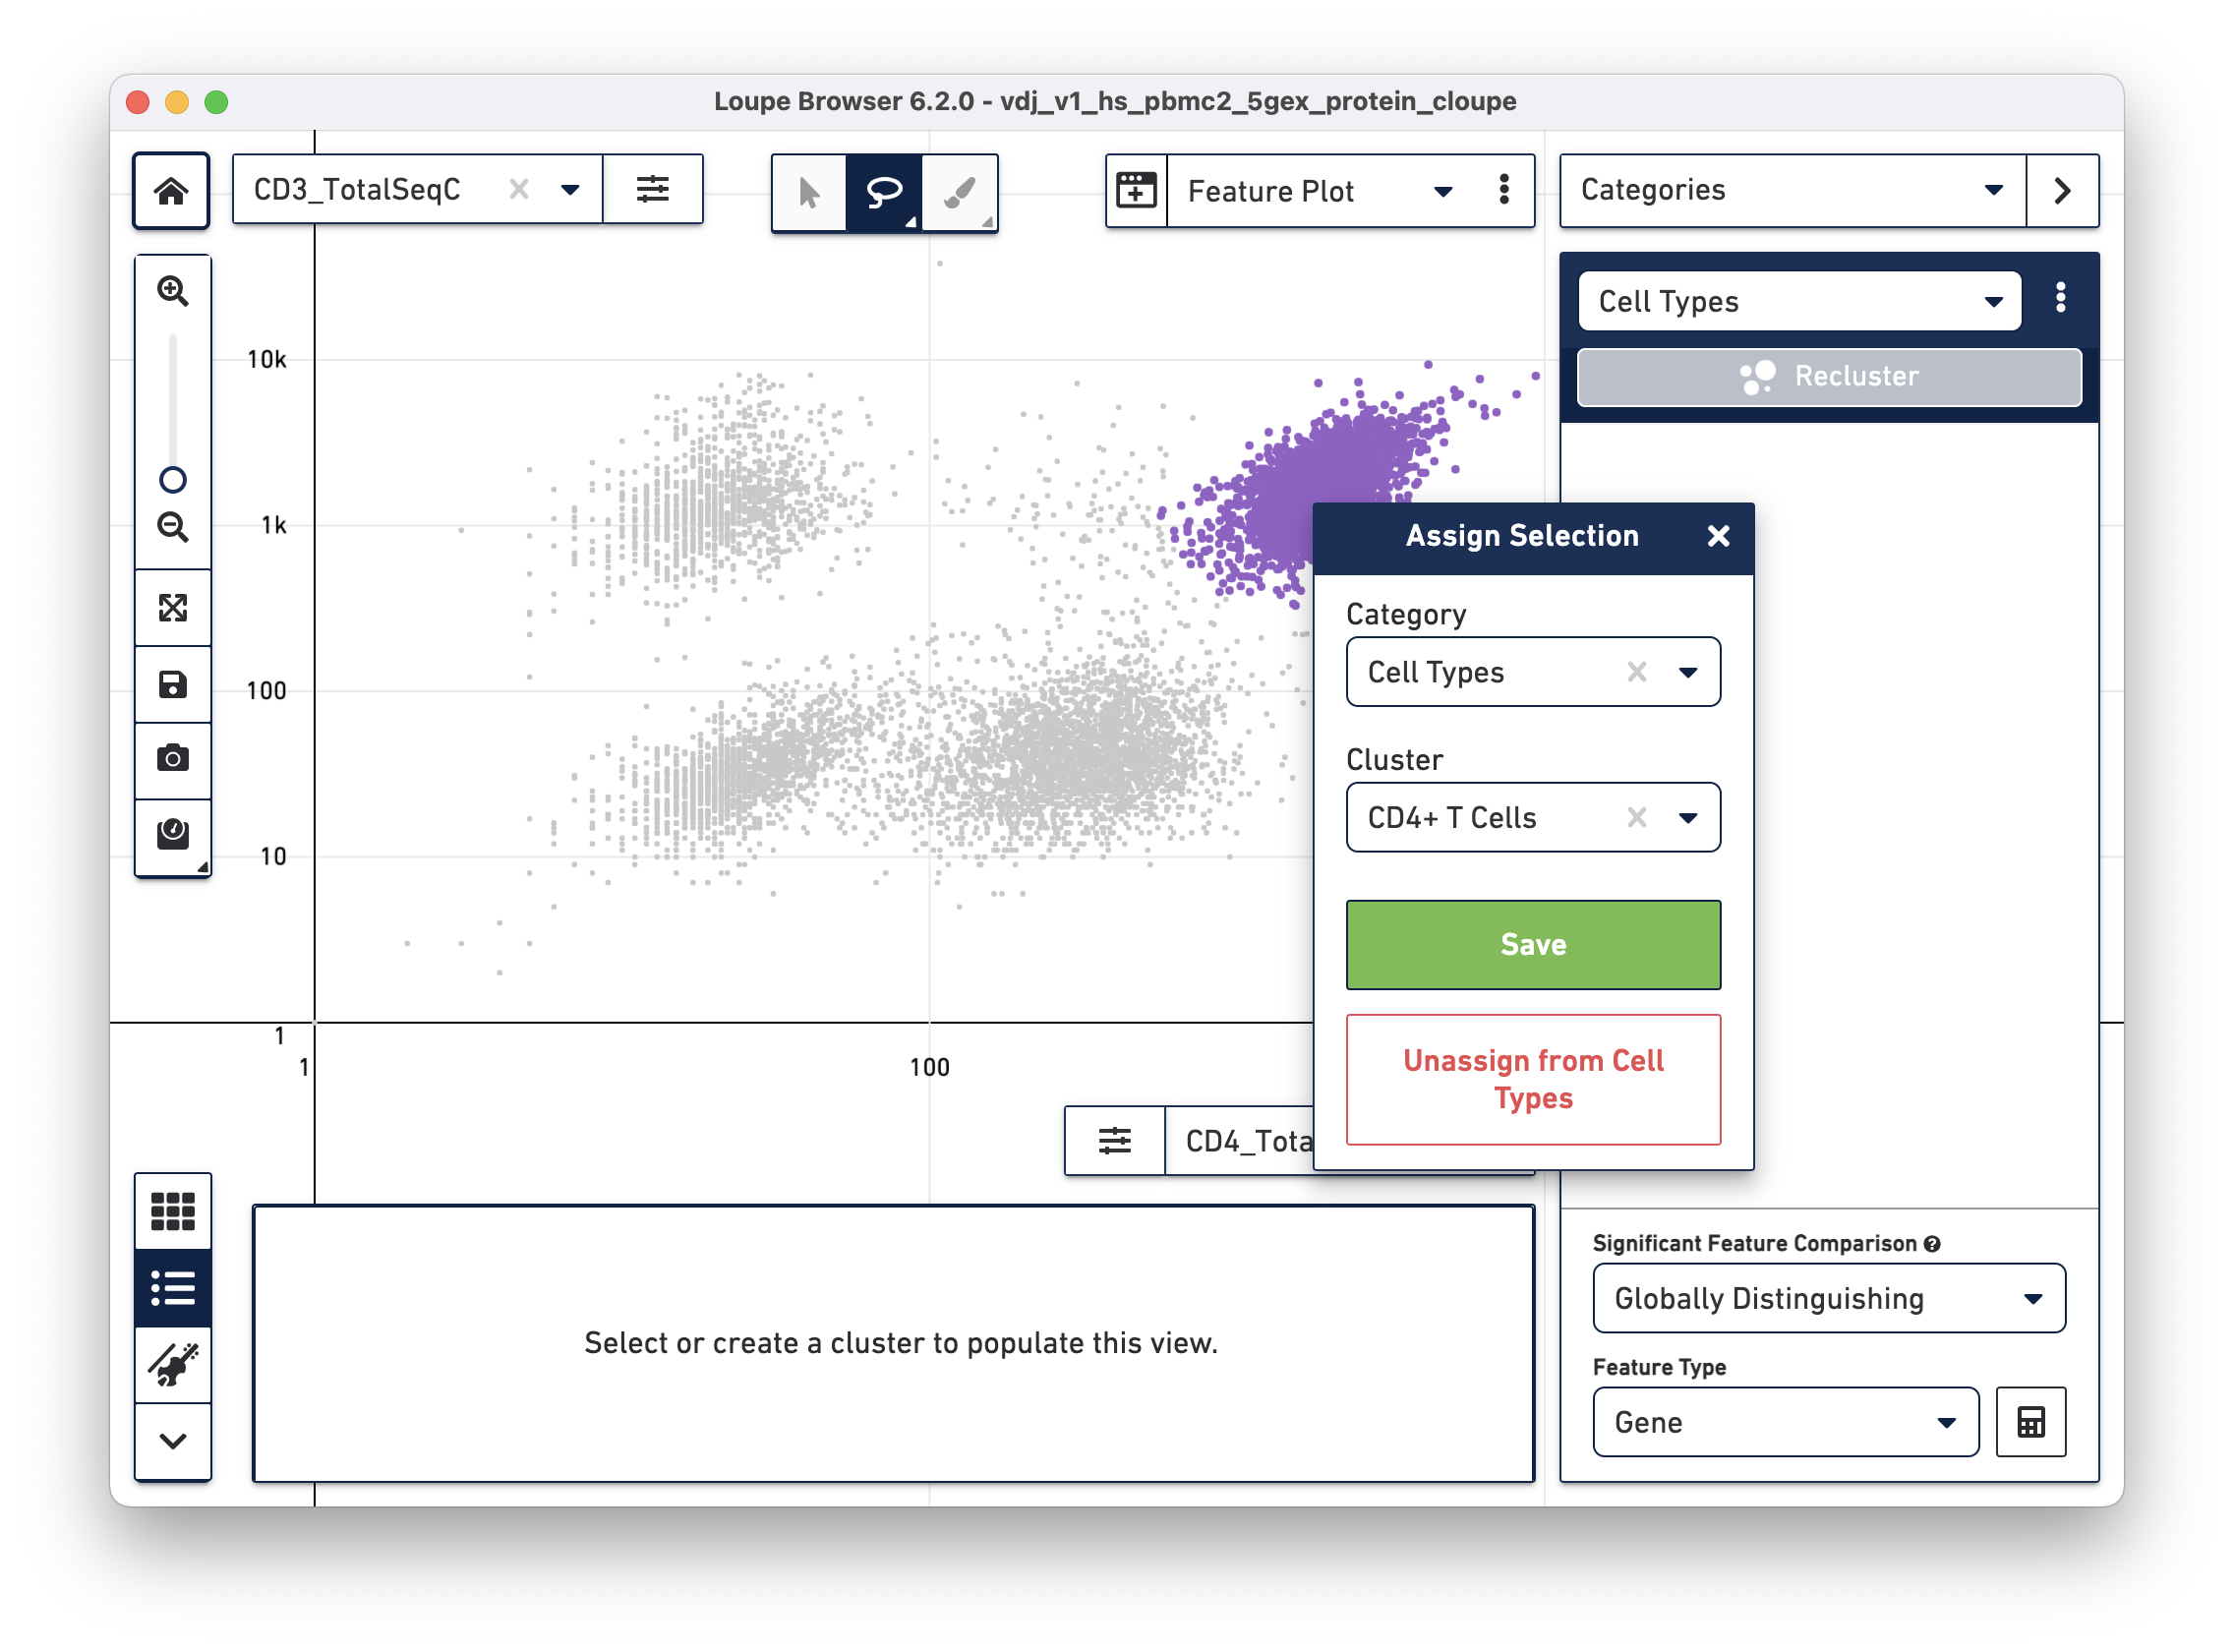
Using the rectangle or lasso tools assign the CD3+/CD4+ cells to a "CD4+ T
Cells" cluster.
Next, choose the CD8a_TotalSeqC antibody feature and log scale for the X axis and assign CD3+/CD8+ cells to a "CD8+ T Cells" cluster.
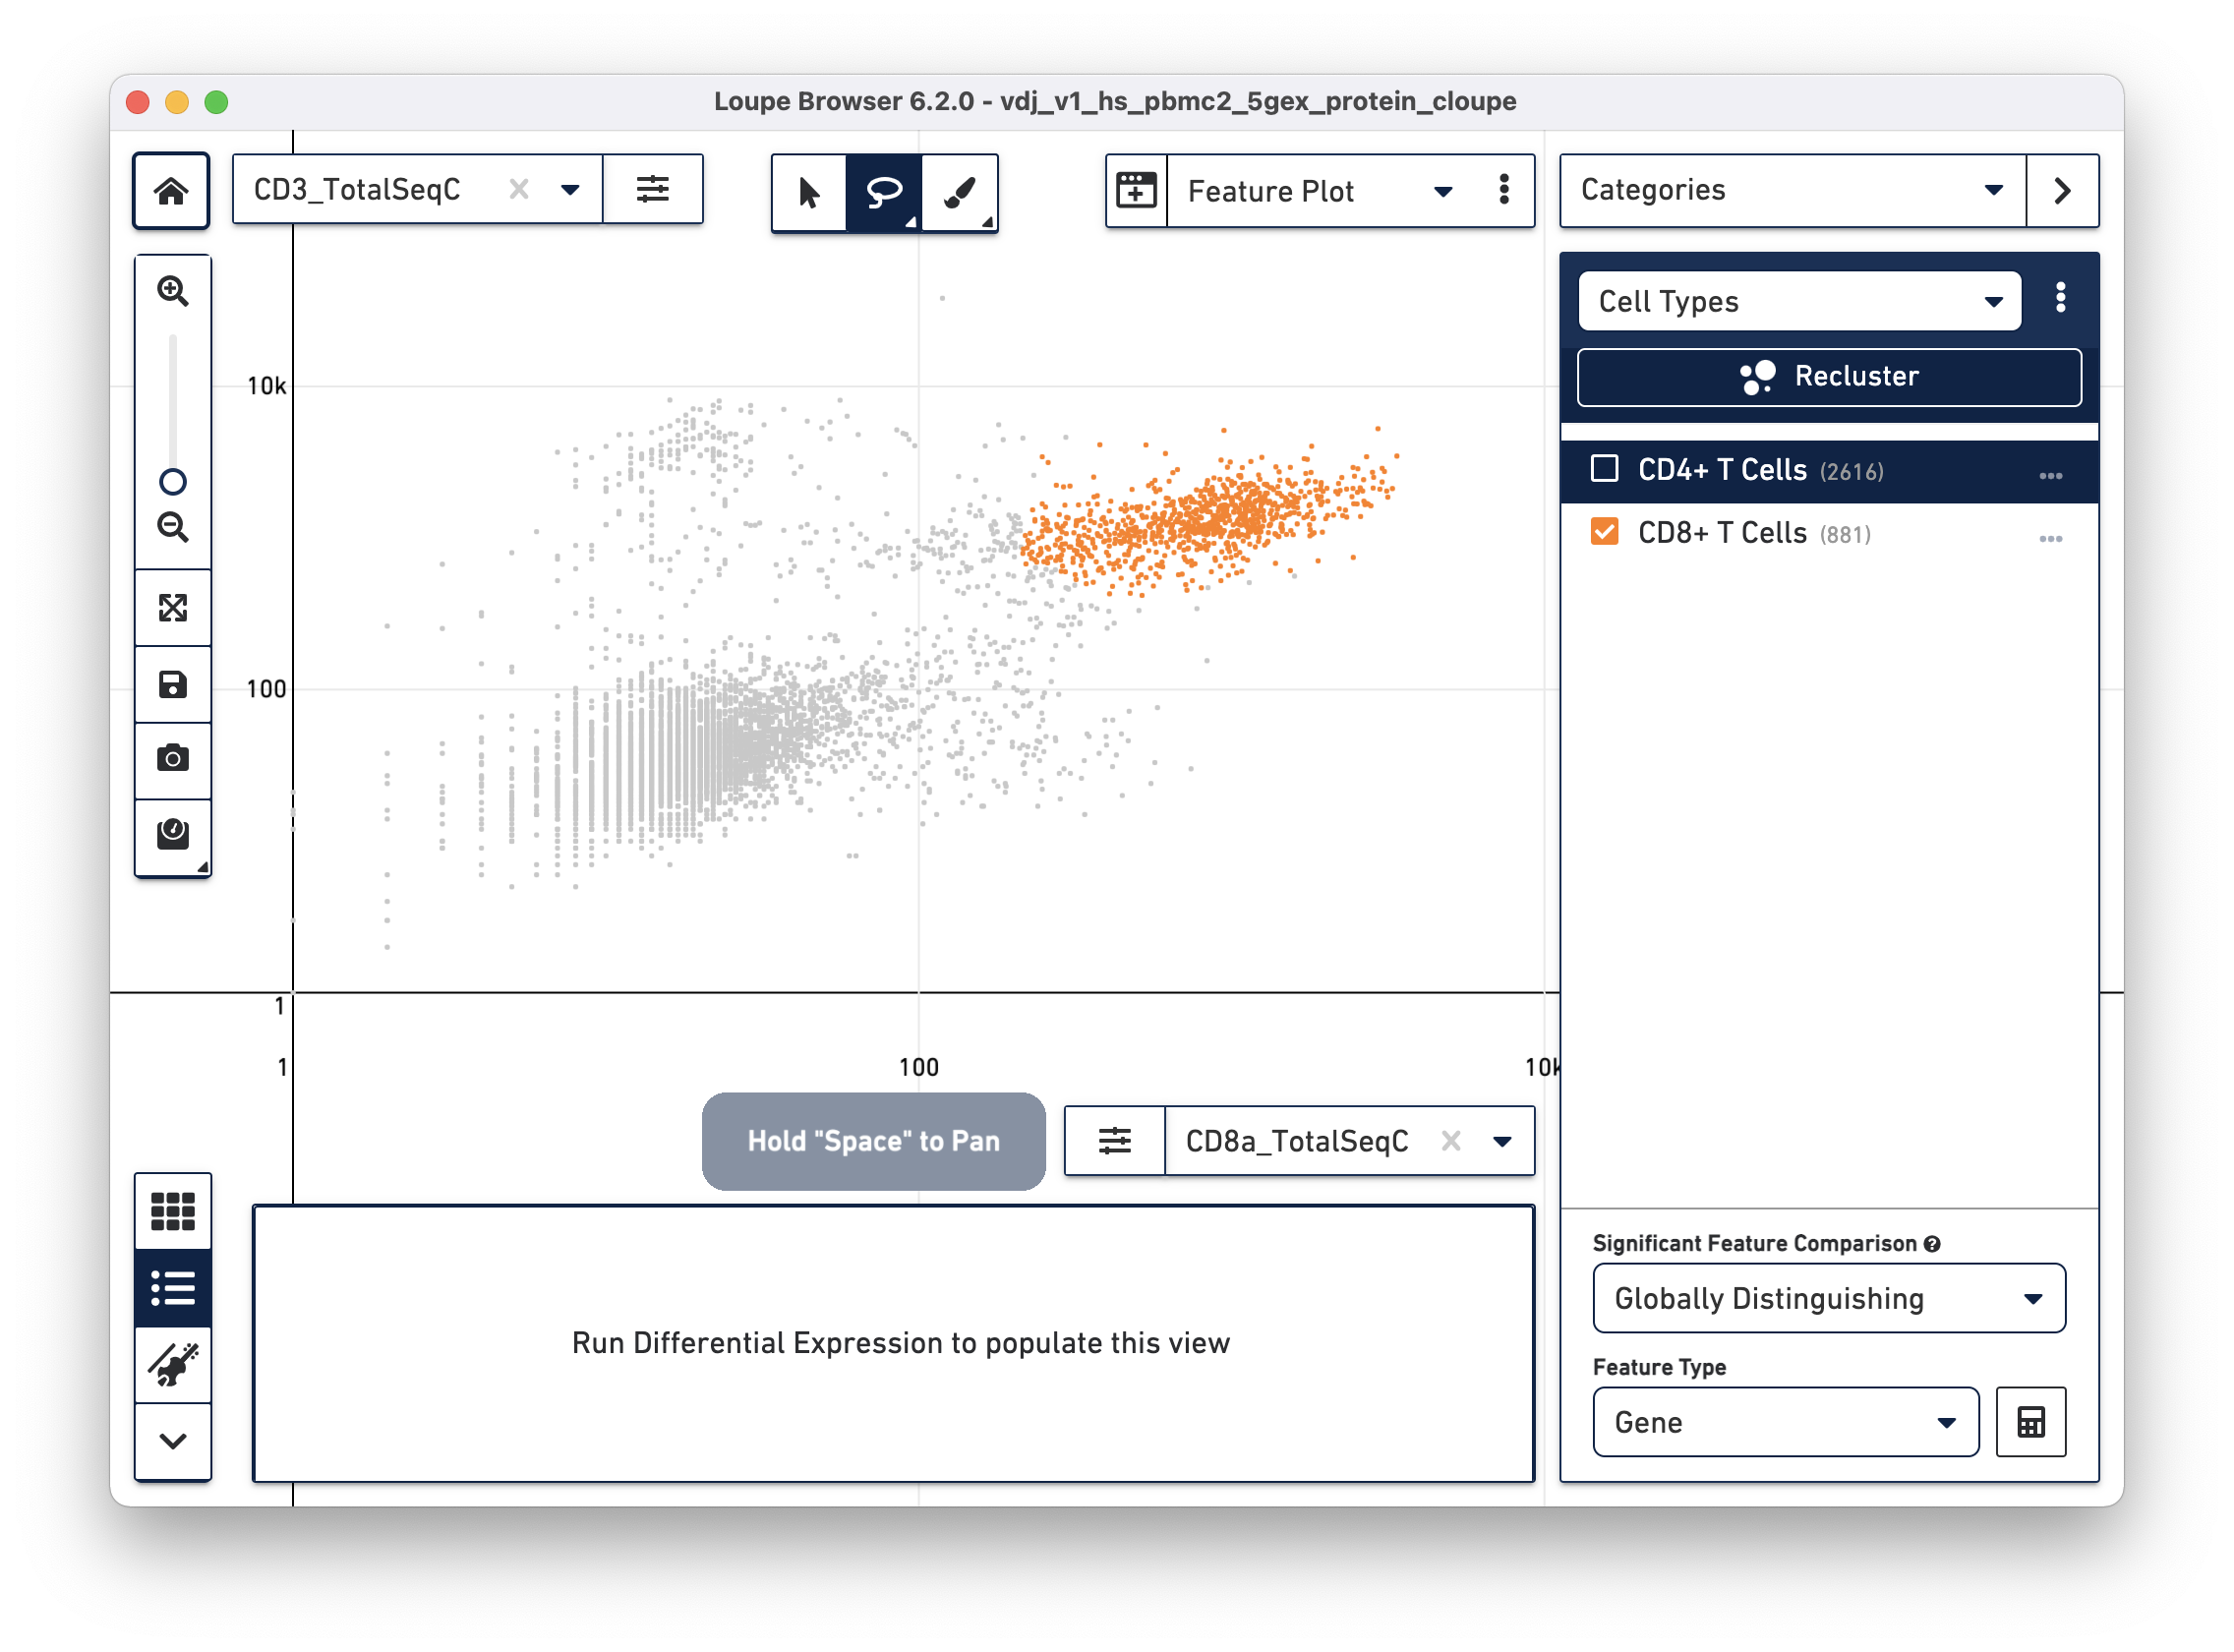
This assignment mechanism allows for more accurate filtering than through the t-SNE plots.
The feature plot is also useful for isolating true positive populations against negative control markers, in both antibody and antigen applications, or identifying and excluding possible doublets from existing clusters.
The rest of this exercise excludes cells with elevated counts of both CD8 and CD4 surface markers from cell type assignments.
With CD4+ and CD8+ T cell clusters established, clonotypes which are enriched
for those particular clusters can be identified. Switch to V(D)J Clonotypes
mode with the mode selector, and import the T cell receptor .vloupe file
downloaded from the link above. Next, in the Filter selector underneath the
clonotype list, select Cluster. Finally, choose the CD8+ T Cells cluster
created in the section above. See the representative graph below:
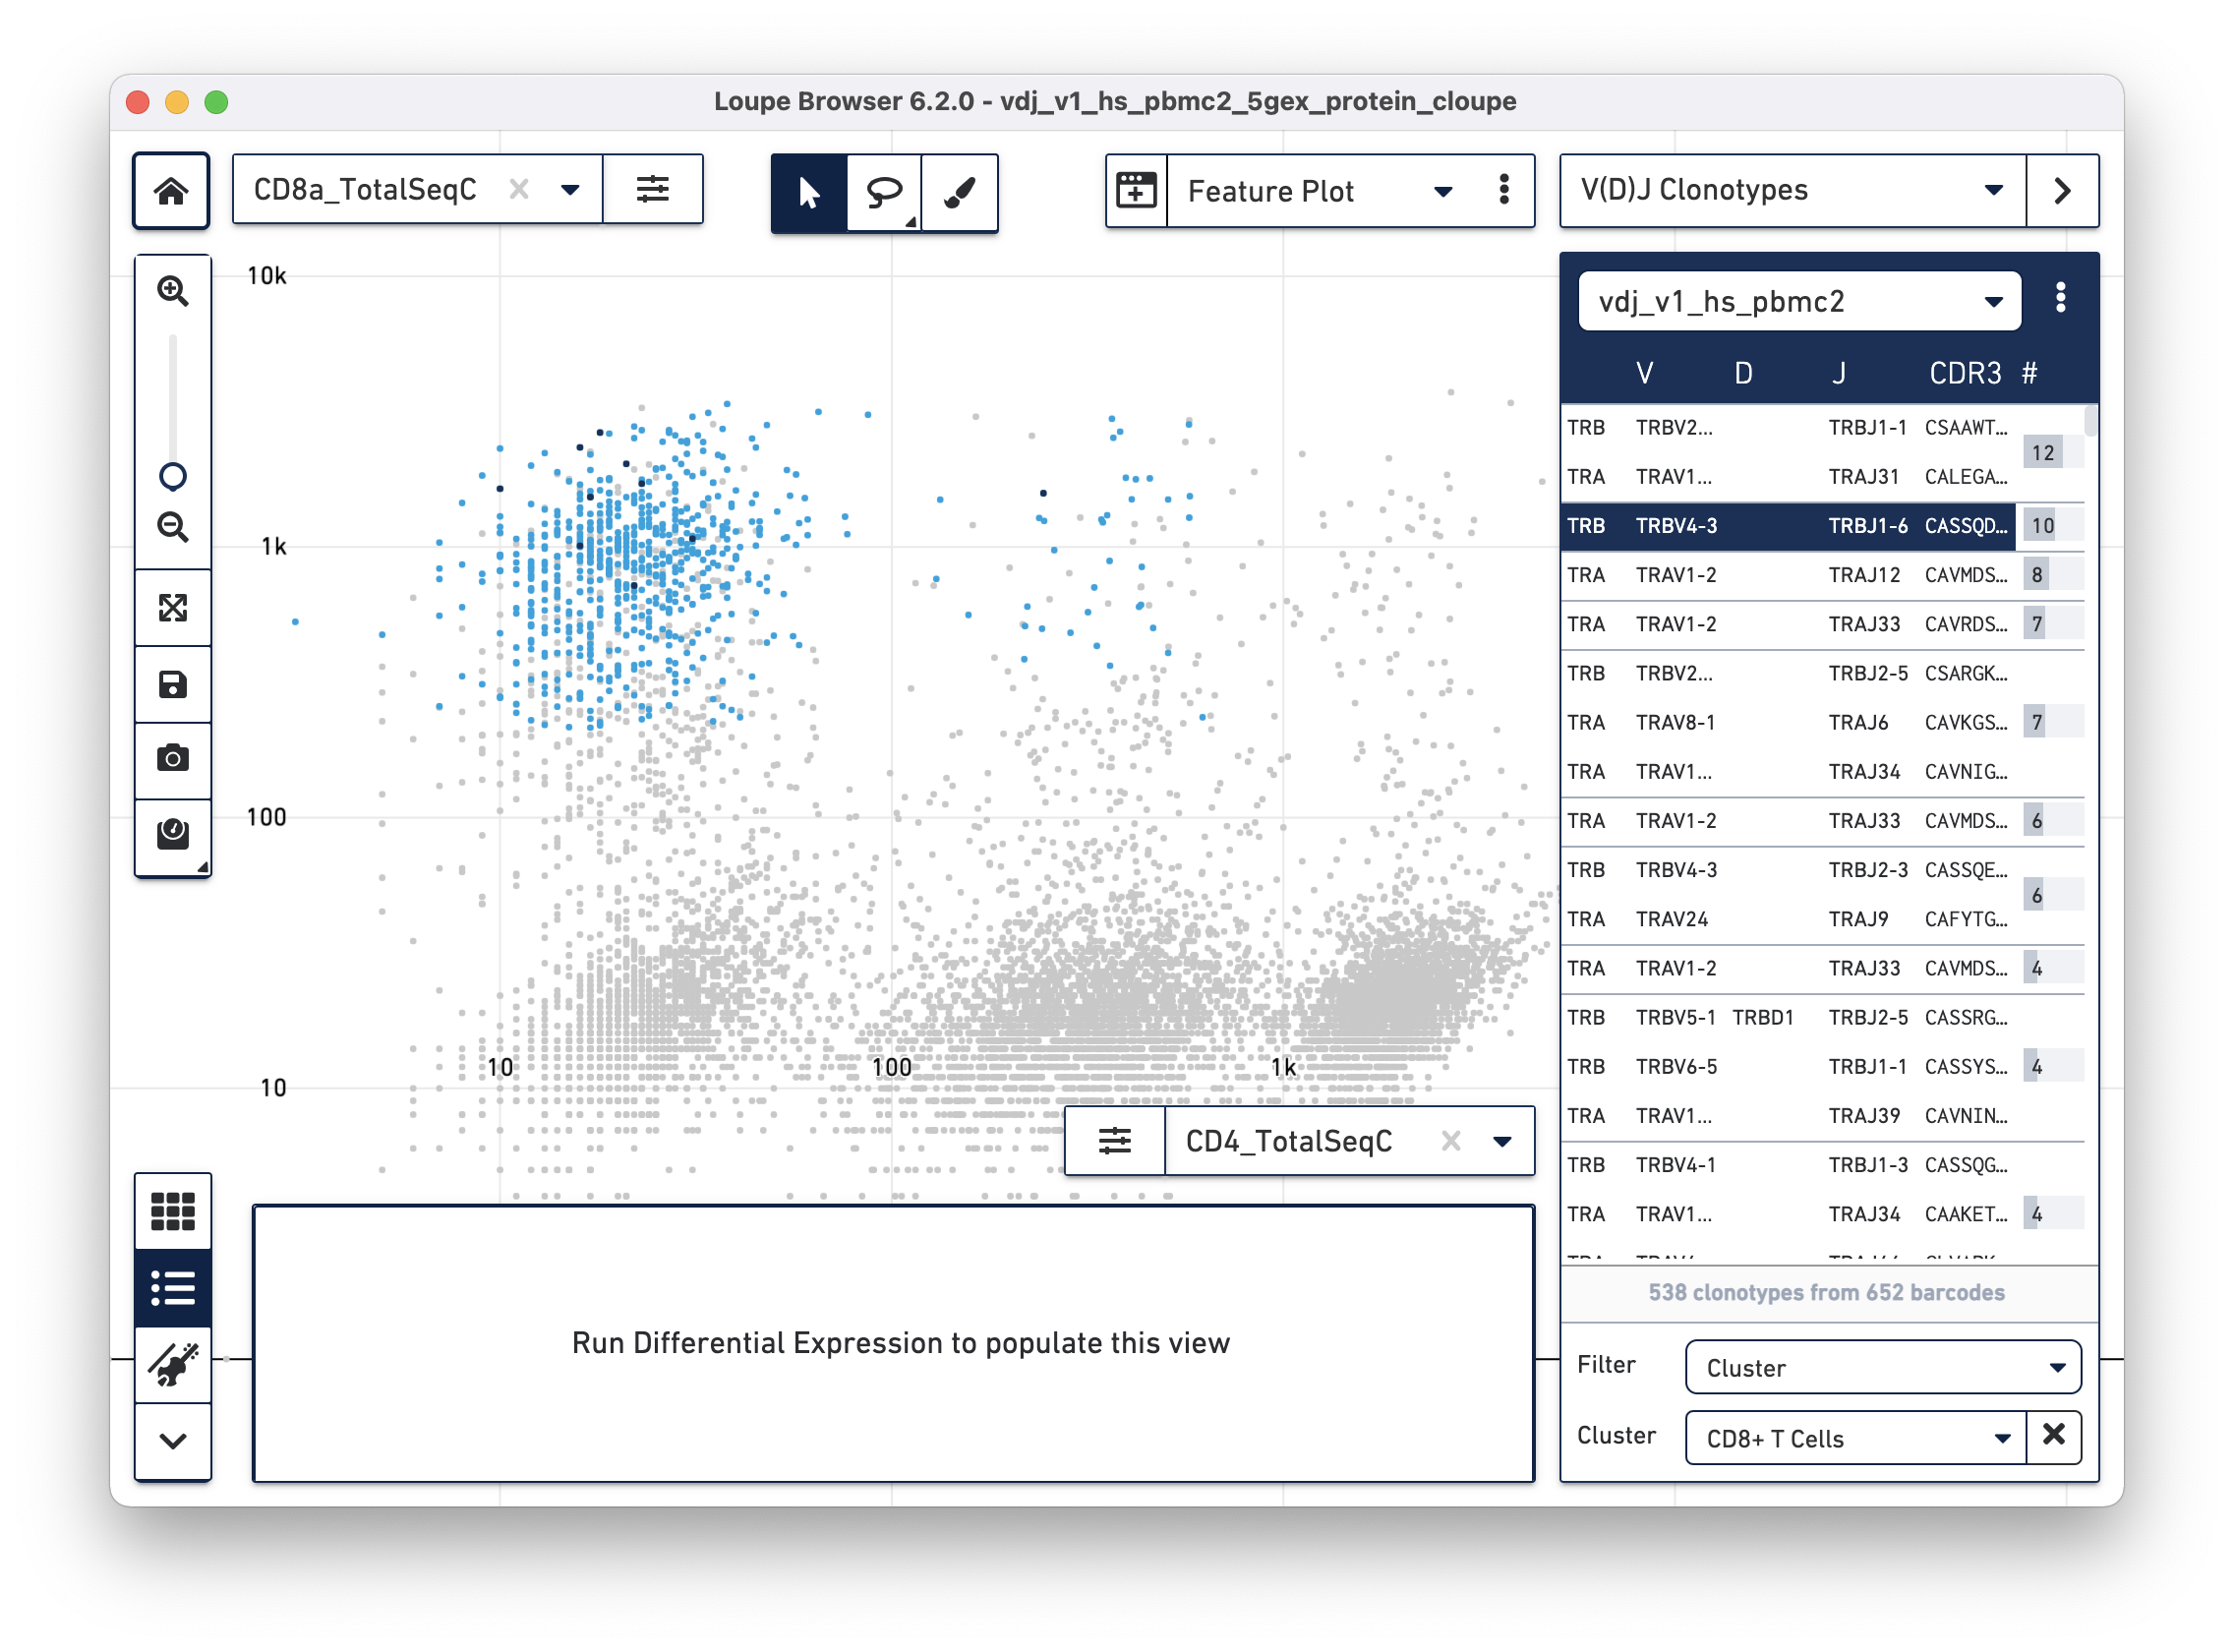
A list of clonotypes are enriched in the CD3+/CD8+ cluster and include some MAIT cells (TRAV1-2/TRAJ33), but there are a few more clonotypes enriched in that subset. Similar analysis can be performed for other T cell clusters.
Using the feature plot to identify subpopulations of interest and then measuring clonotype enrichment for those clusters is particularly interesting for analyzing datasets generated from cells labeled with peptide-MHC multimers conjugated to Feature Barcode oligonucleotides. T cell receptor clonotypes can be linked to Antigen Capture by using the Feature Plot to isolate cells with antigen binding counts higher than the negative control, and then using the clonotype list to find the paired chains of the cells bound to that antigen.
Antigens preferentially bound to a dominant clonotype can be identified in the datasets. Right-click on the clonotypes of interest and select 'Assign to Category...' to create a cluster out of cells with the selected clonotype(s). After assignment, find preferentially bound antigens by using the Significant Feature tool in Categories mode. Choose "Globally Distinguishing" from the Significant Feature Comparison dropdown, and "Antibody Capture" (includes cell surface markers and Antigen Capture) as the Feature Type. The data table shows preferentially bound antigens from the feature reference.
Using the surface marker dataset, choose a clonotype of interest, and choose "Antibody Capture" as the significant feature type:
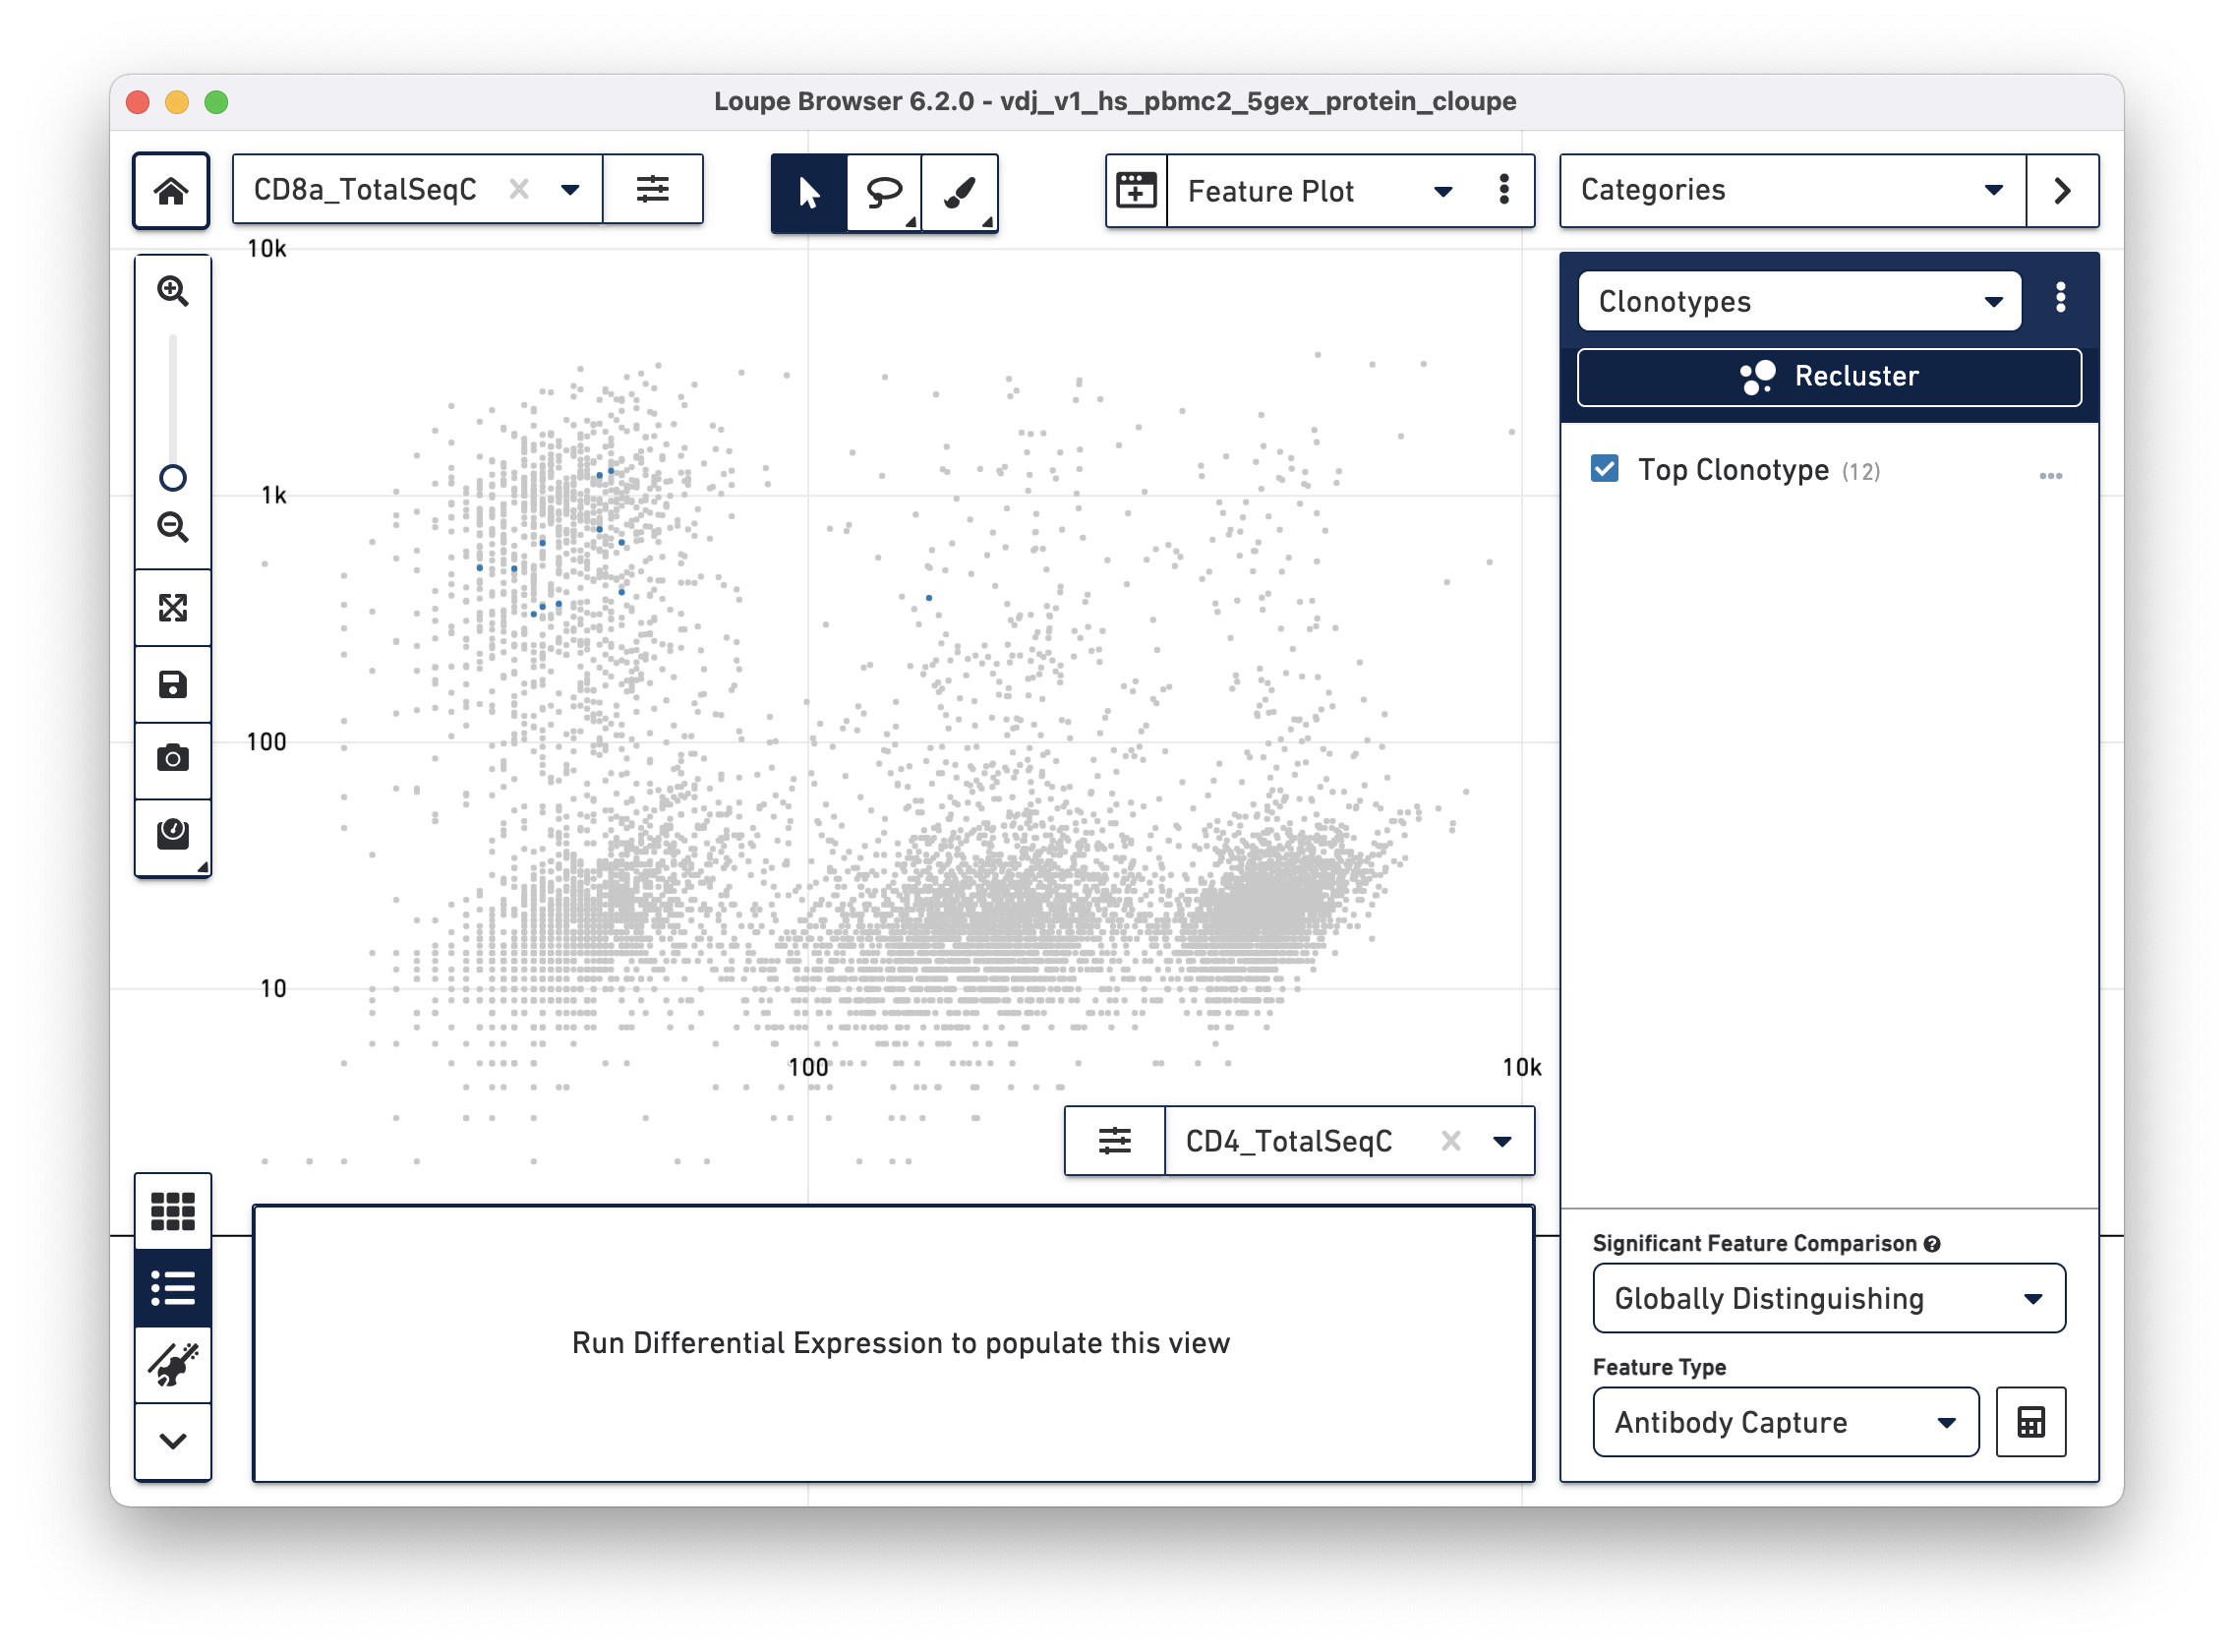
The cells in the top clonotype have higher levels of CD127 and CD3 surface marker expression, though not dramatically so from other T cells. When compared against the CD4+ and CD8+ T cell populations, the top clonotype is a MAIT cell clonotype with elevated CD56 surface marker expression.