Cell Ranger7.1, printed on 03/26/2025
The cellranger vdj pipeline outputs a web_summary.html that contains summary metrics and automated secondary analysis results. An alert appears on this page if an issue was detected during the pipeline run. Information about these alerts is provided in the troubleshooting documentation.
Additional help troubleshooting failed metrics can be found in this Web Summary Metrics for V(D)J Knowledge Base article.
The run summary can be viewed by clicking Summary tab (left corner). The summary metrics describe sequencing quality and various characteristics of the detected cells.
Click the ? next to the title of each dashboard for more information on that metric.
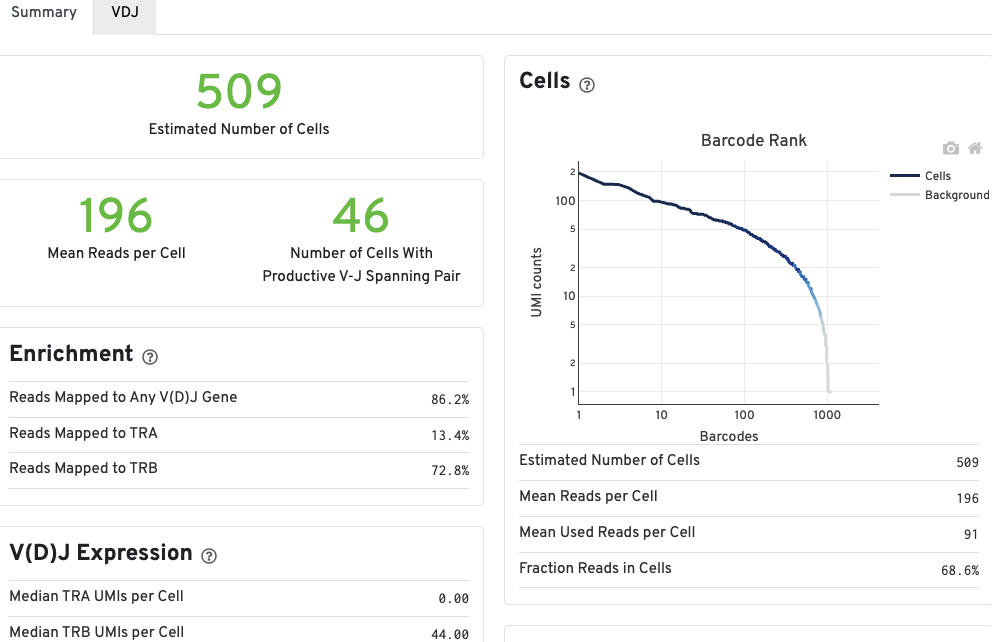
The number of cells detected, the mean read pairs per cell, and the number of V-J spanning productive paired cells are prominently displayed near the top of the page.
The Barcode Rank Plot under the Cells dashboard shows the count of filtered UMIs mapped to each barcode. A barcode must have a contig that aligns to a V segment to be identified as a targeted cell. If cellranger vdj was run in de novo mode, the only requirement is the presence of a contig. There must also be at least three filtered UMIs with at least two read pairs each. It is possible that a barcode with at least as many filtered UMIs as another cell-associated barcode is not identified as a targeted cell. Visit to the cellranger vdj algorithm page to learn more. The color of the graph is based on the local density of cell-associated barcodes. Read this Guided Tour of the Barcode Rank Plot for more details on its uses and interpretations.
The automated secondary analysis results can be viewed by clicking VDJ tab (left corner).
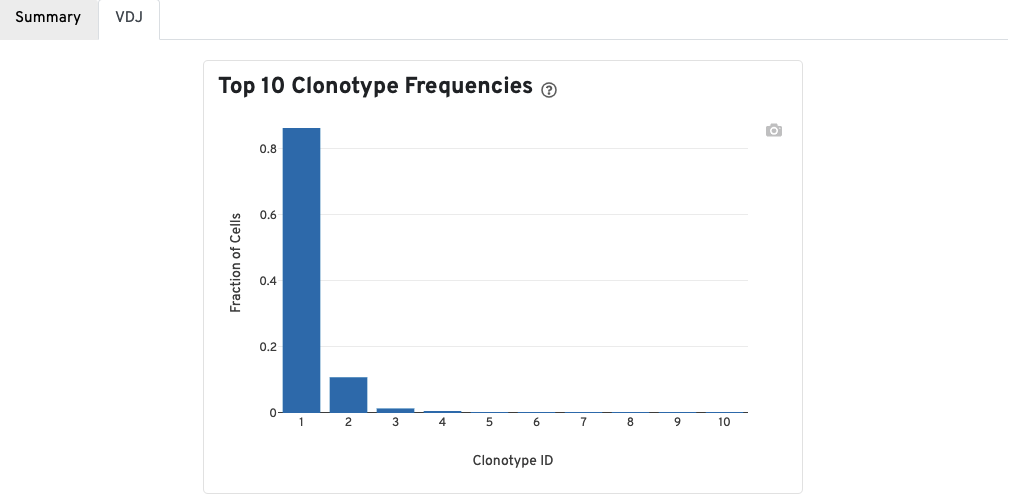
A bar chart showing the the distribution of the top 10 clonotypes in this sample.
A table of the top 10 clonotypes, their cell counts, their proportions, and the their associated sets of CDR3 amino acid sequences is also provided.
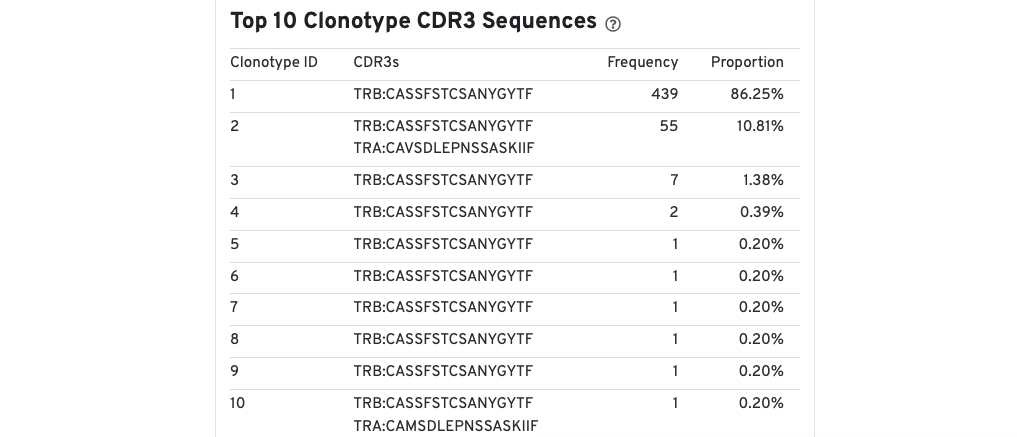
Note that because clonotypes are defined by productive sequences only, there are additional sequences that may not be displayed in the web summary. A more complete set of sequences associated with each cell can be found in the filtered contig files.
Do you have questions or feedback about this document? Please contact support@10xgenomics.com.