Cell Ranger7.1, printed on 04/25/2025
This tutorial is split into two parts:
Part I: We will investigate the clonality and diversity of lymphocytes within a non-small cell lung carcinoma sample, look at the distribution of clonotypes within two T cell phenotypes, and explore a well-conserved clonotype motif in the gene expression data.
Part II: We will explore the distribution of SARS-CoV-2 and Flu reactive cells within gene expression clusters in the Barcode Enabled Antigen Mapping (BEAM) tutorial dataset and identify genes that are upregulated in these antigen reactive cells.
For both parts of the tutorial, you will need to:
If you are new to Loupe Browser, read the Loupe Browser tutorial before continuing. For more information on how to set up integrated V(D)J and gene expression experiments, go back to the Single Cell V(D)J + 5′ Gene Expression overview.
This part of the tutorial was written using Loupe Browser v6.2. However, we recommend that you run the latest versions of Loupe Browser and Loupe V(D)J Browser. To follow along, download these data files:
Open the LungTumorGEX.cloupe file in Loupe Browser. In Categories mode, if you select Cell Types from the Category select menu, you will see the plot below:
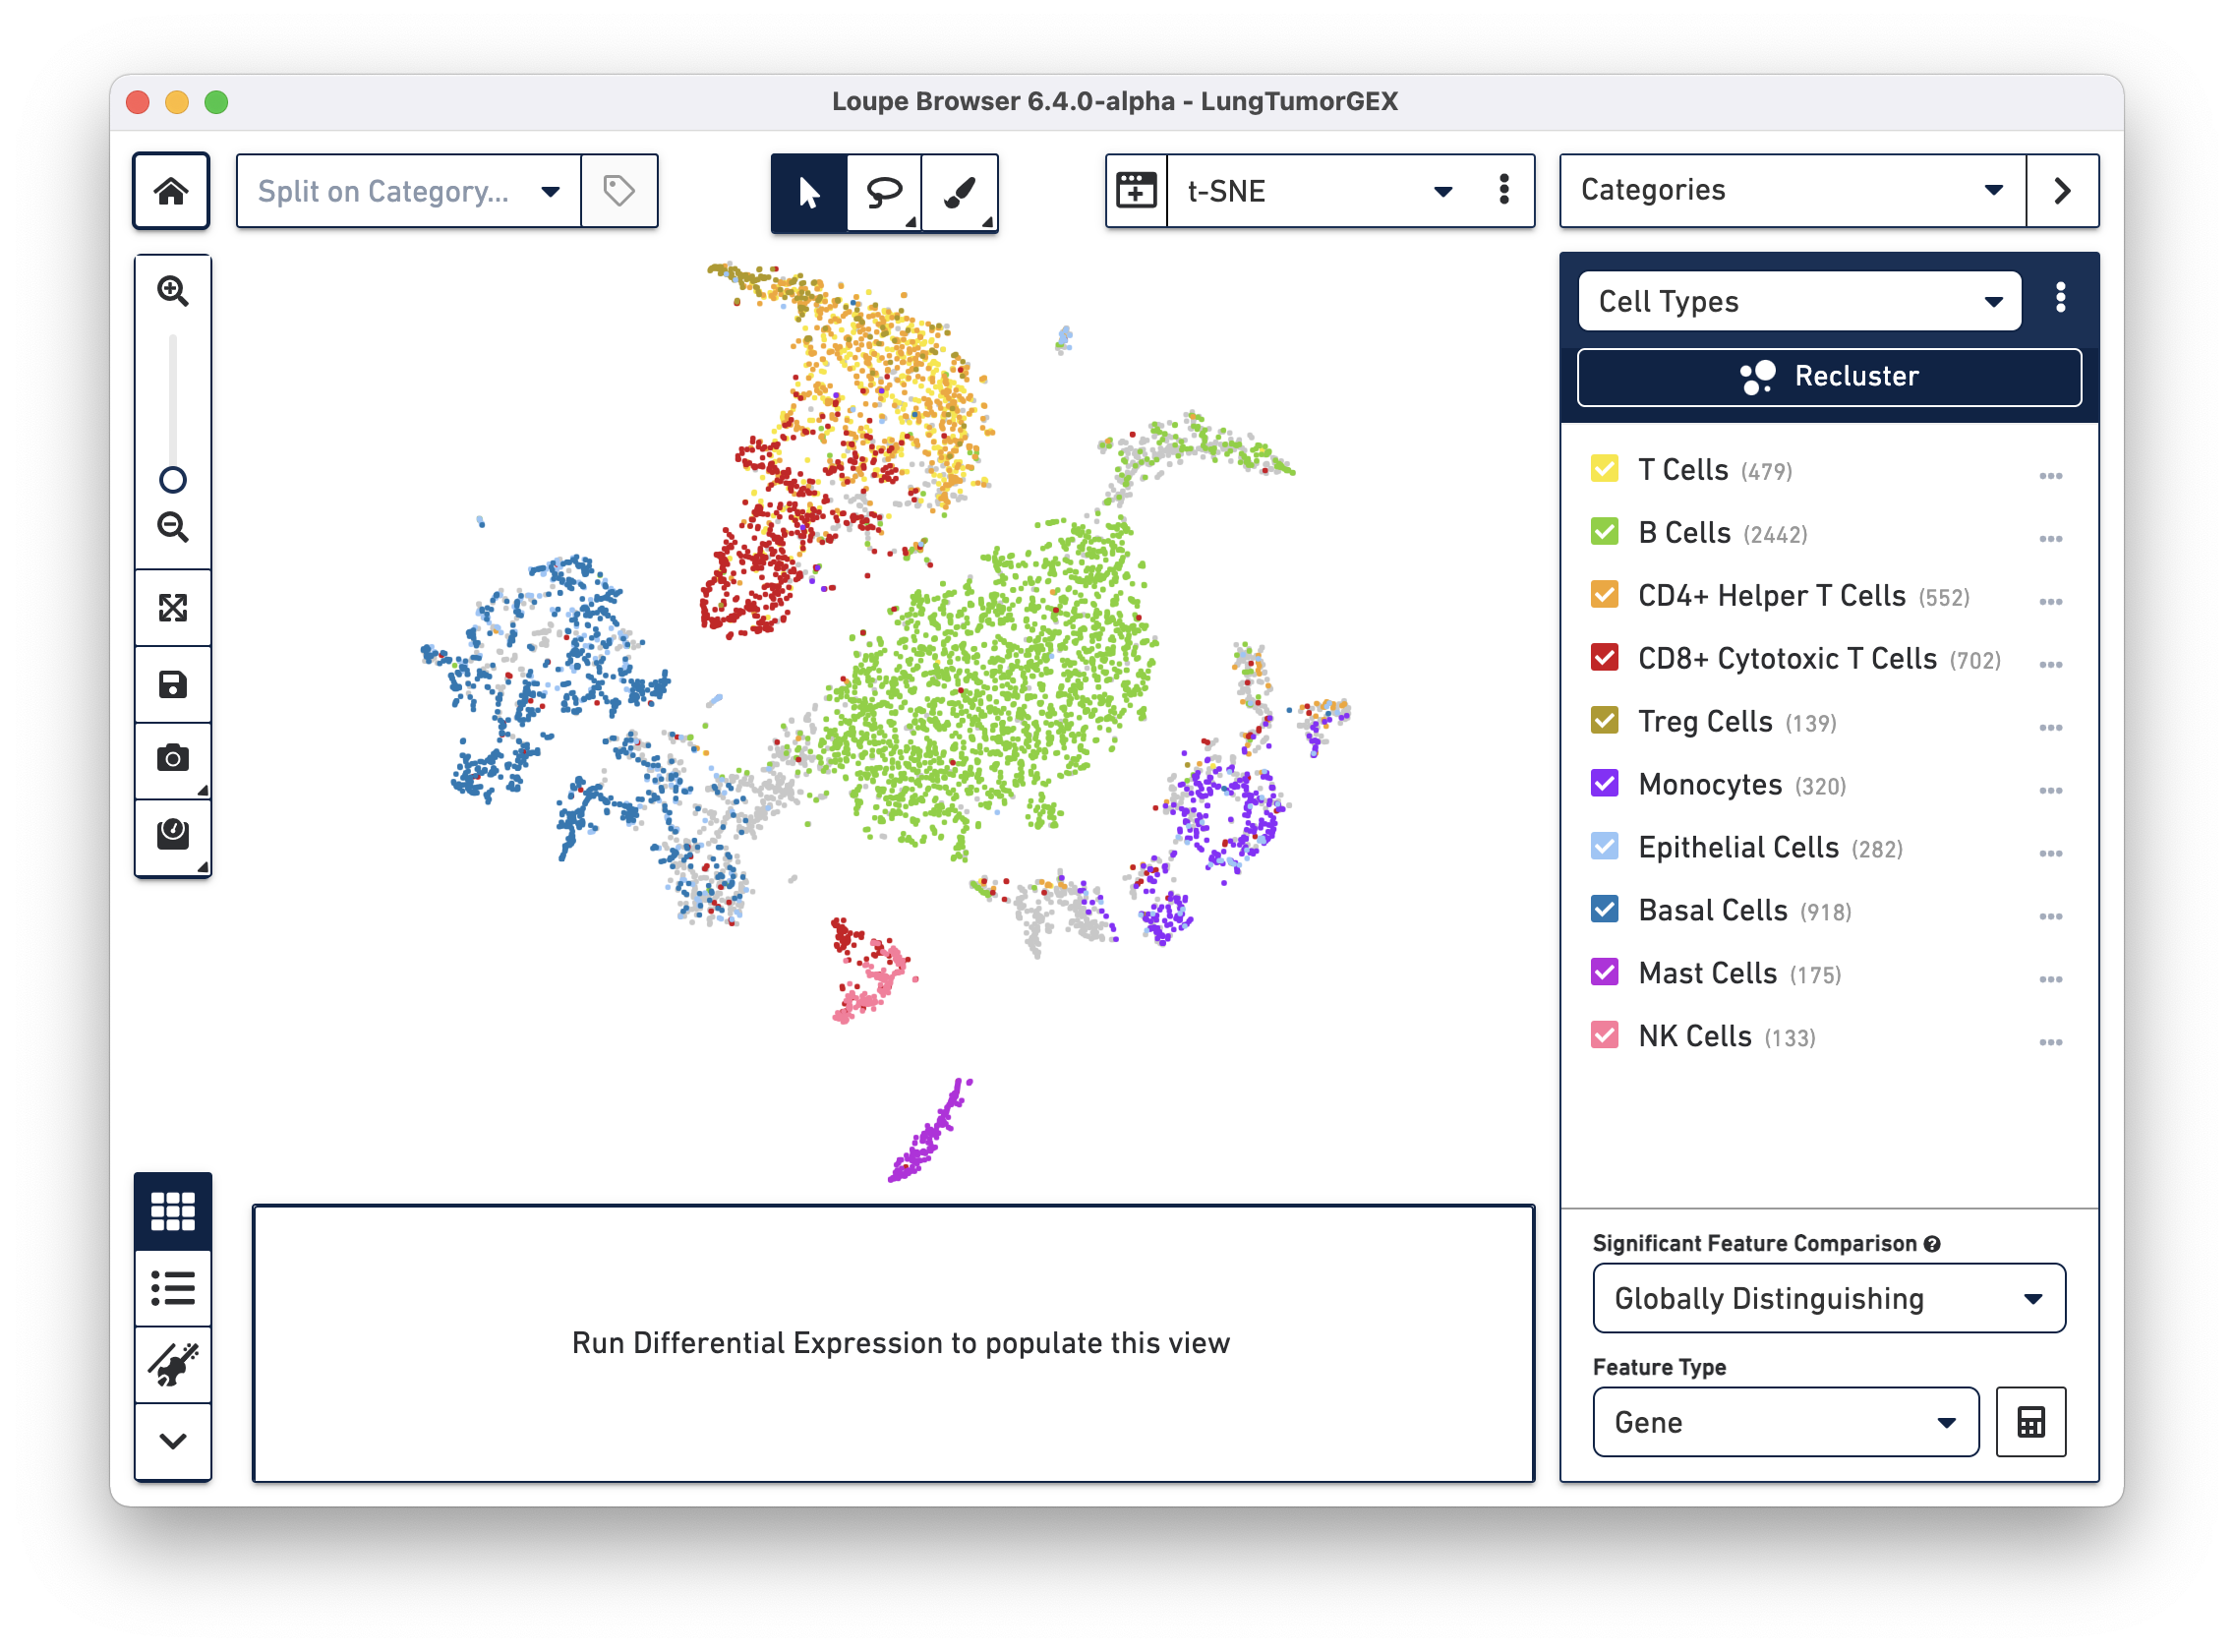
We have manually annotated this dataset in Loupe Browser, using gene markers (also saved with the dataset) to determine cell types. There are large clusters of CD8+ cytotoxic T cells (red), CD4+ helper T cells (orange), other T cells (yellow), B cells (green), lung epithelial, and basal cells (blue, dark blue). For more information on how to create cell types using gene markers, visit the Exploring Substructure tutorial in the Loupe Browser documentation.
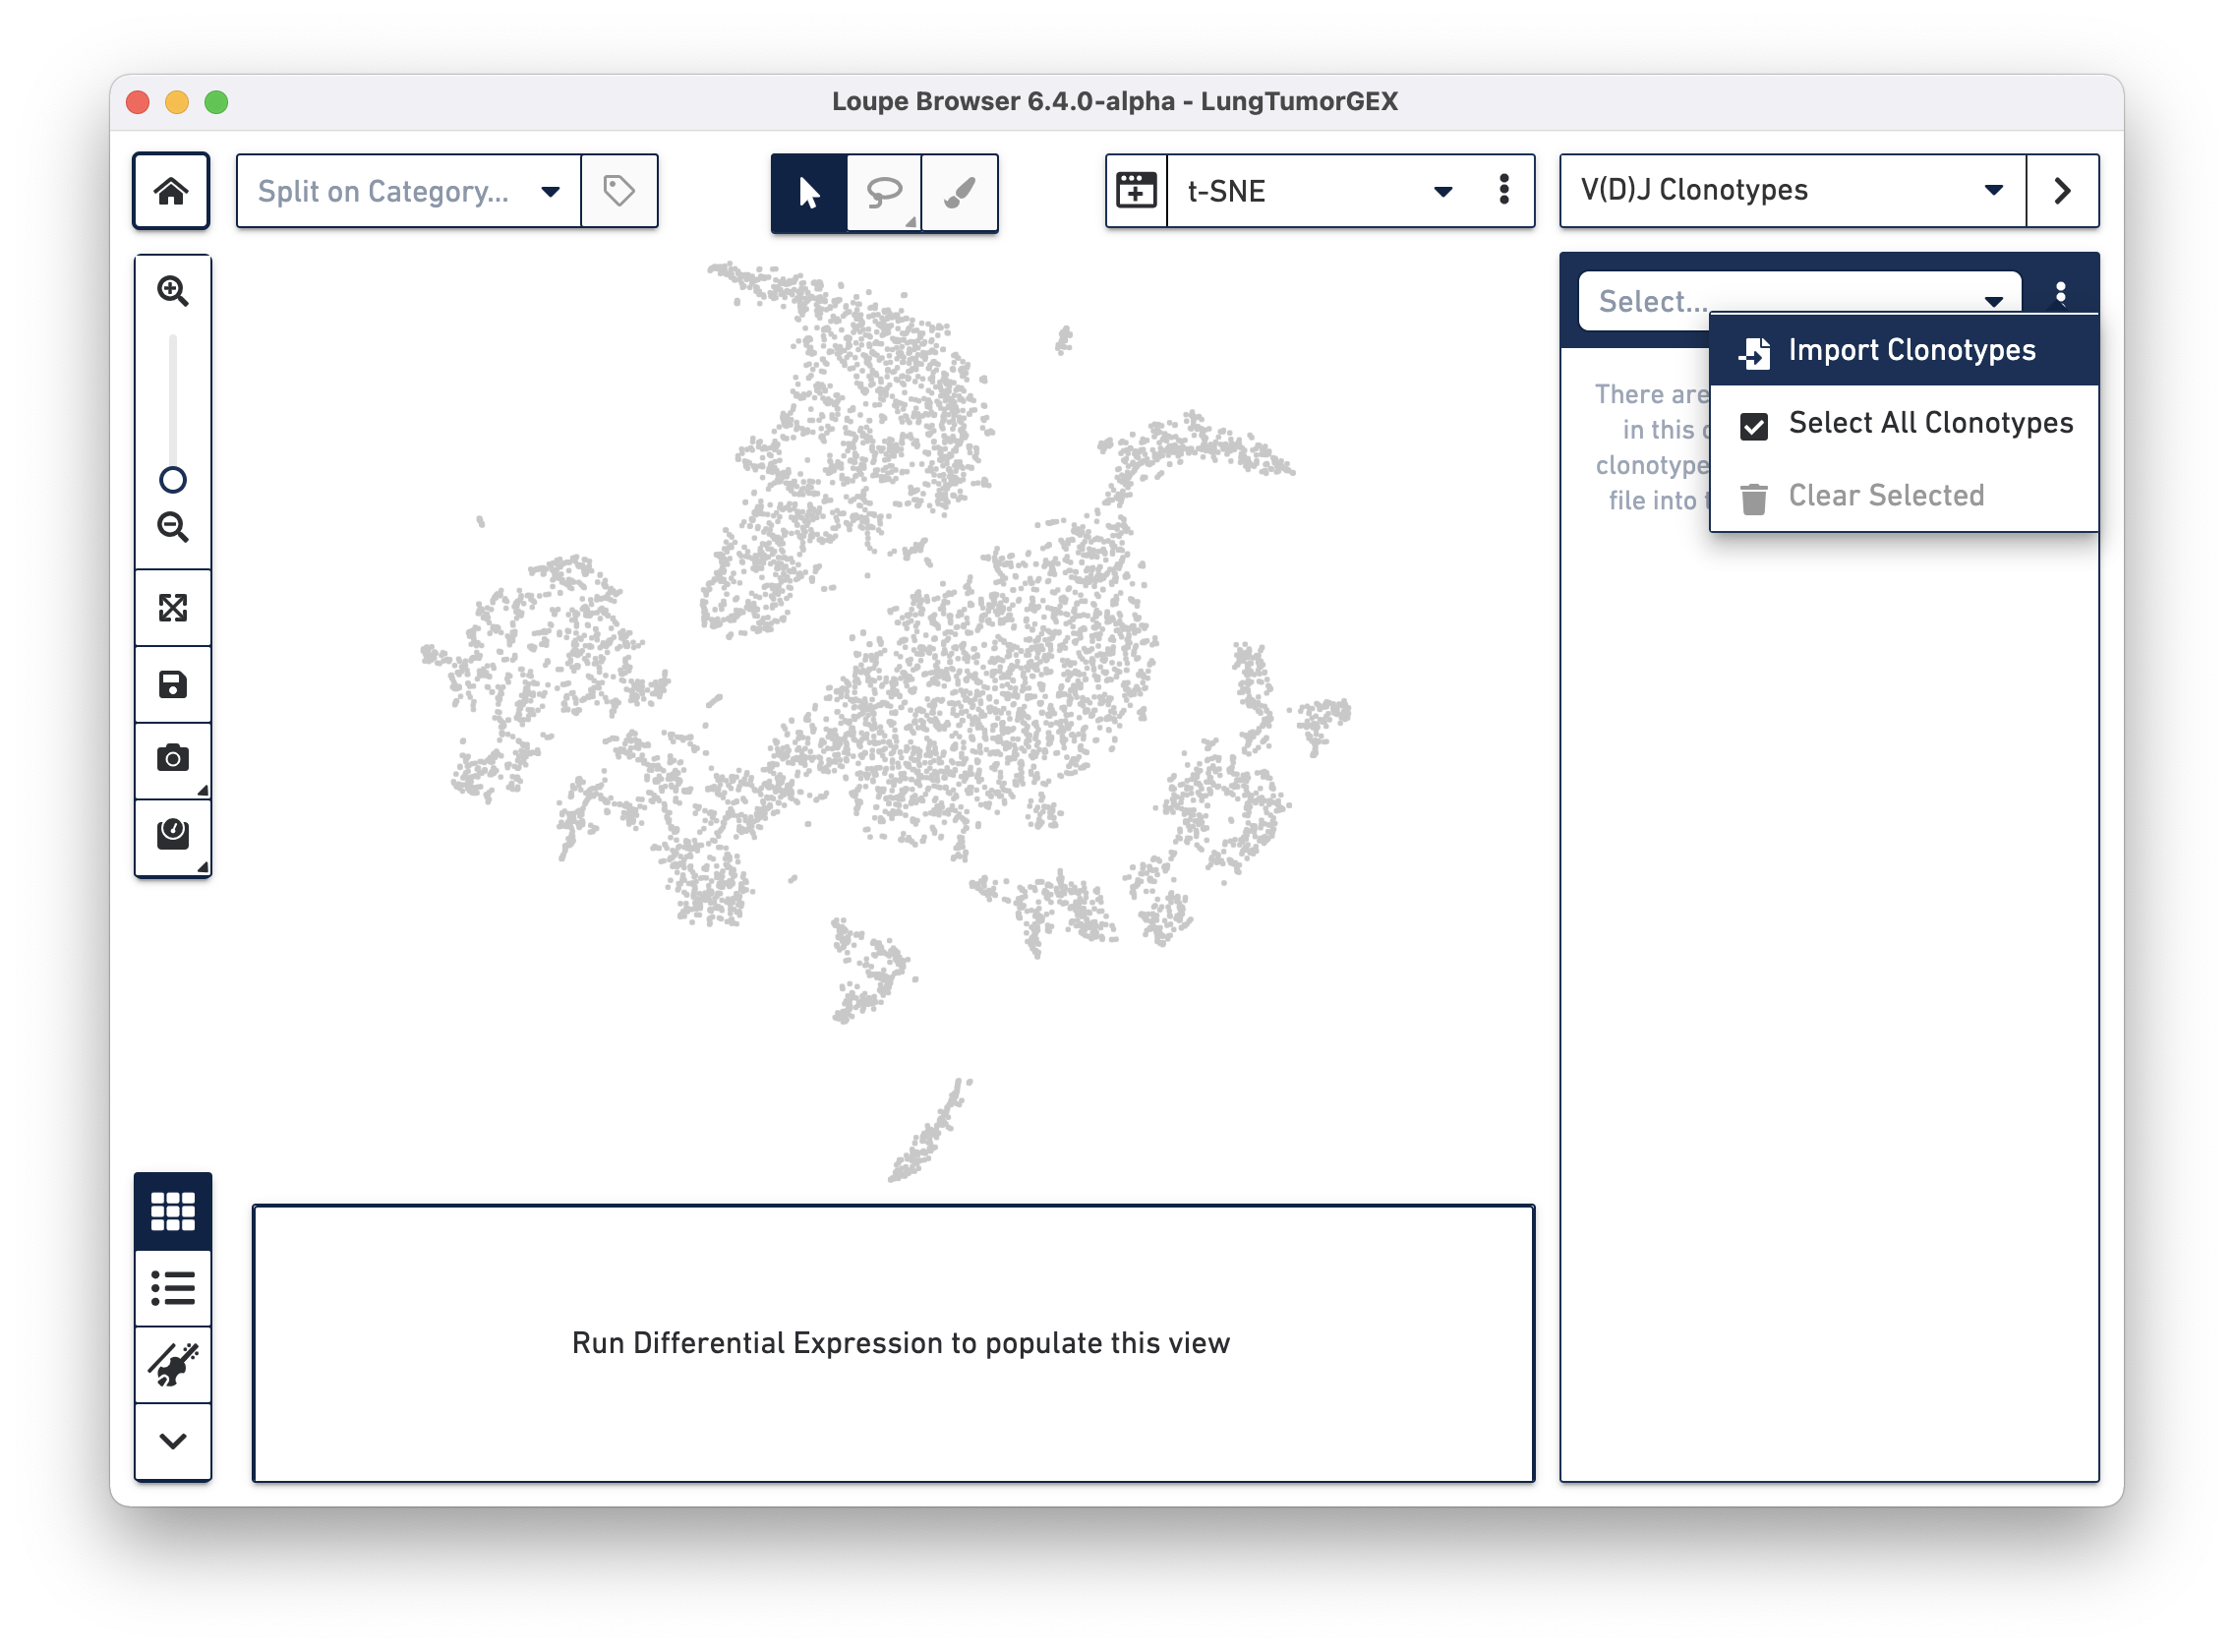
Importing a .vloupe file into the workspace allows you to explore the clonotypes within gene expression clusters. To do this, select V(D)J Clonotypes from the mode selector at the upper right, and either select Import Clonotypes from the sidebar action menu, or click on the link inside the sidebar:
Select the LungTumorT.vloupe file you downloaded from the links above. The sidebar is populated with the list of paired clonotypes from the V(D)J data, and the cells from the complete T cell receptor clonotype list are highlighted in blue:
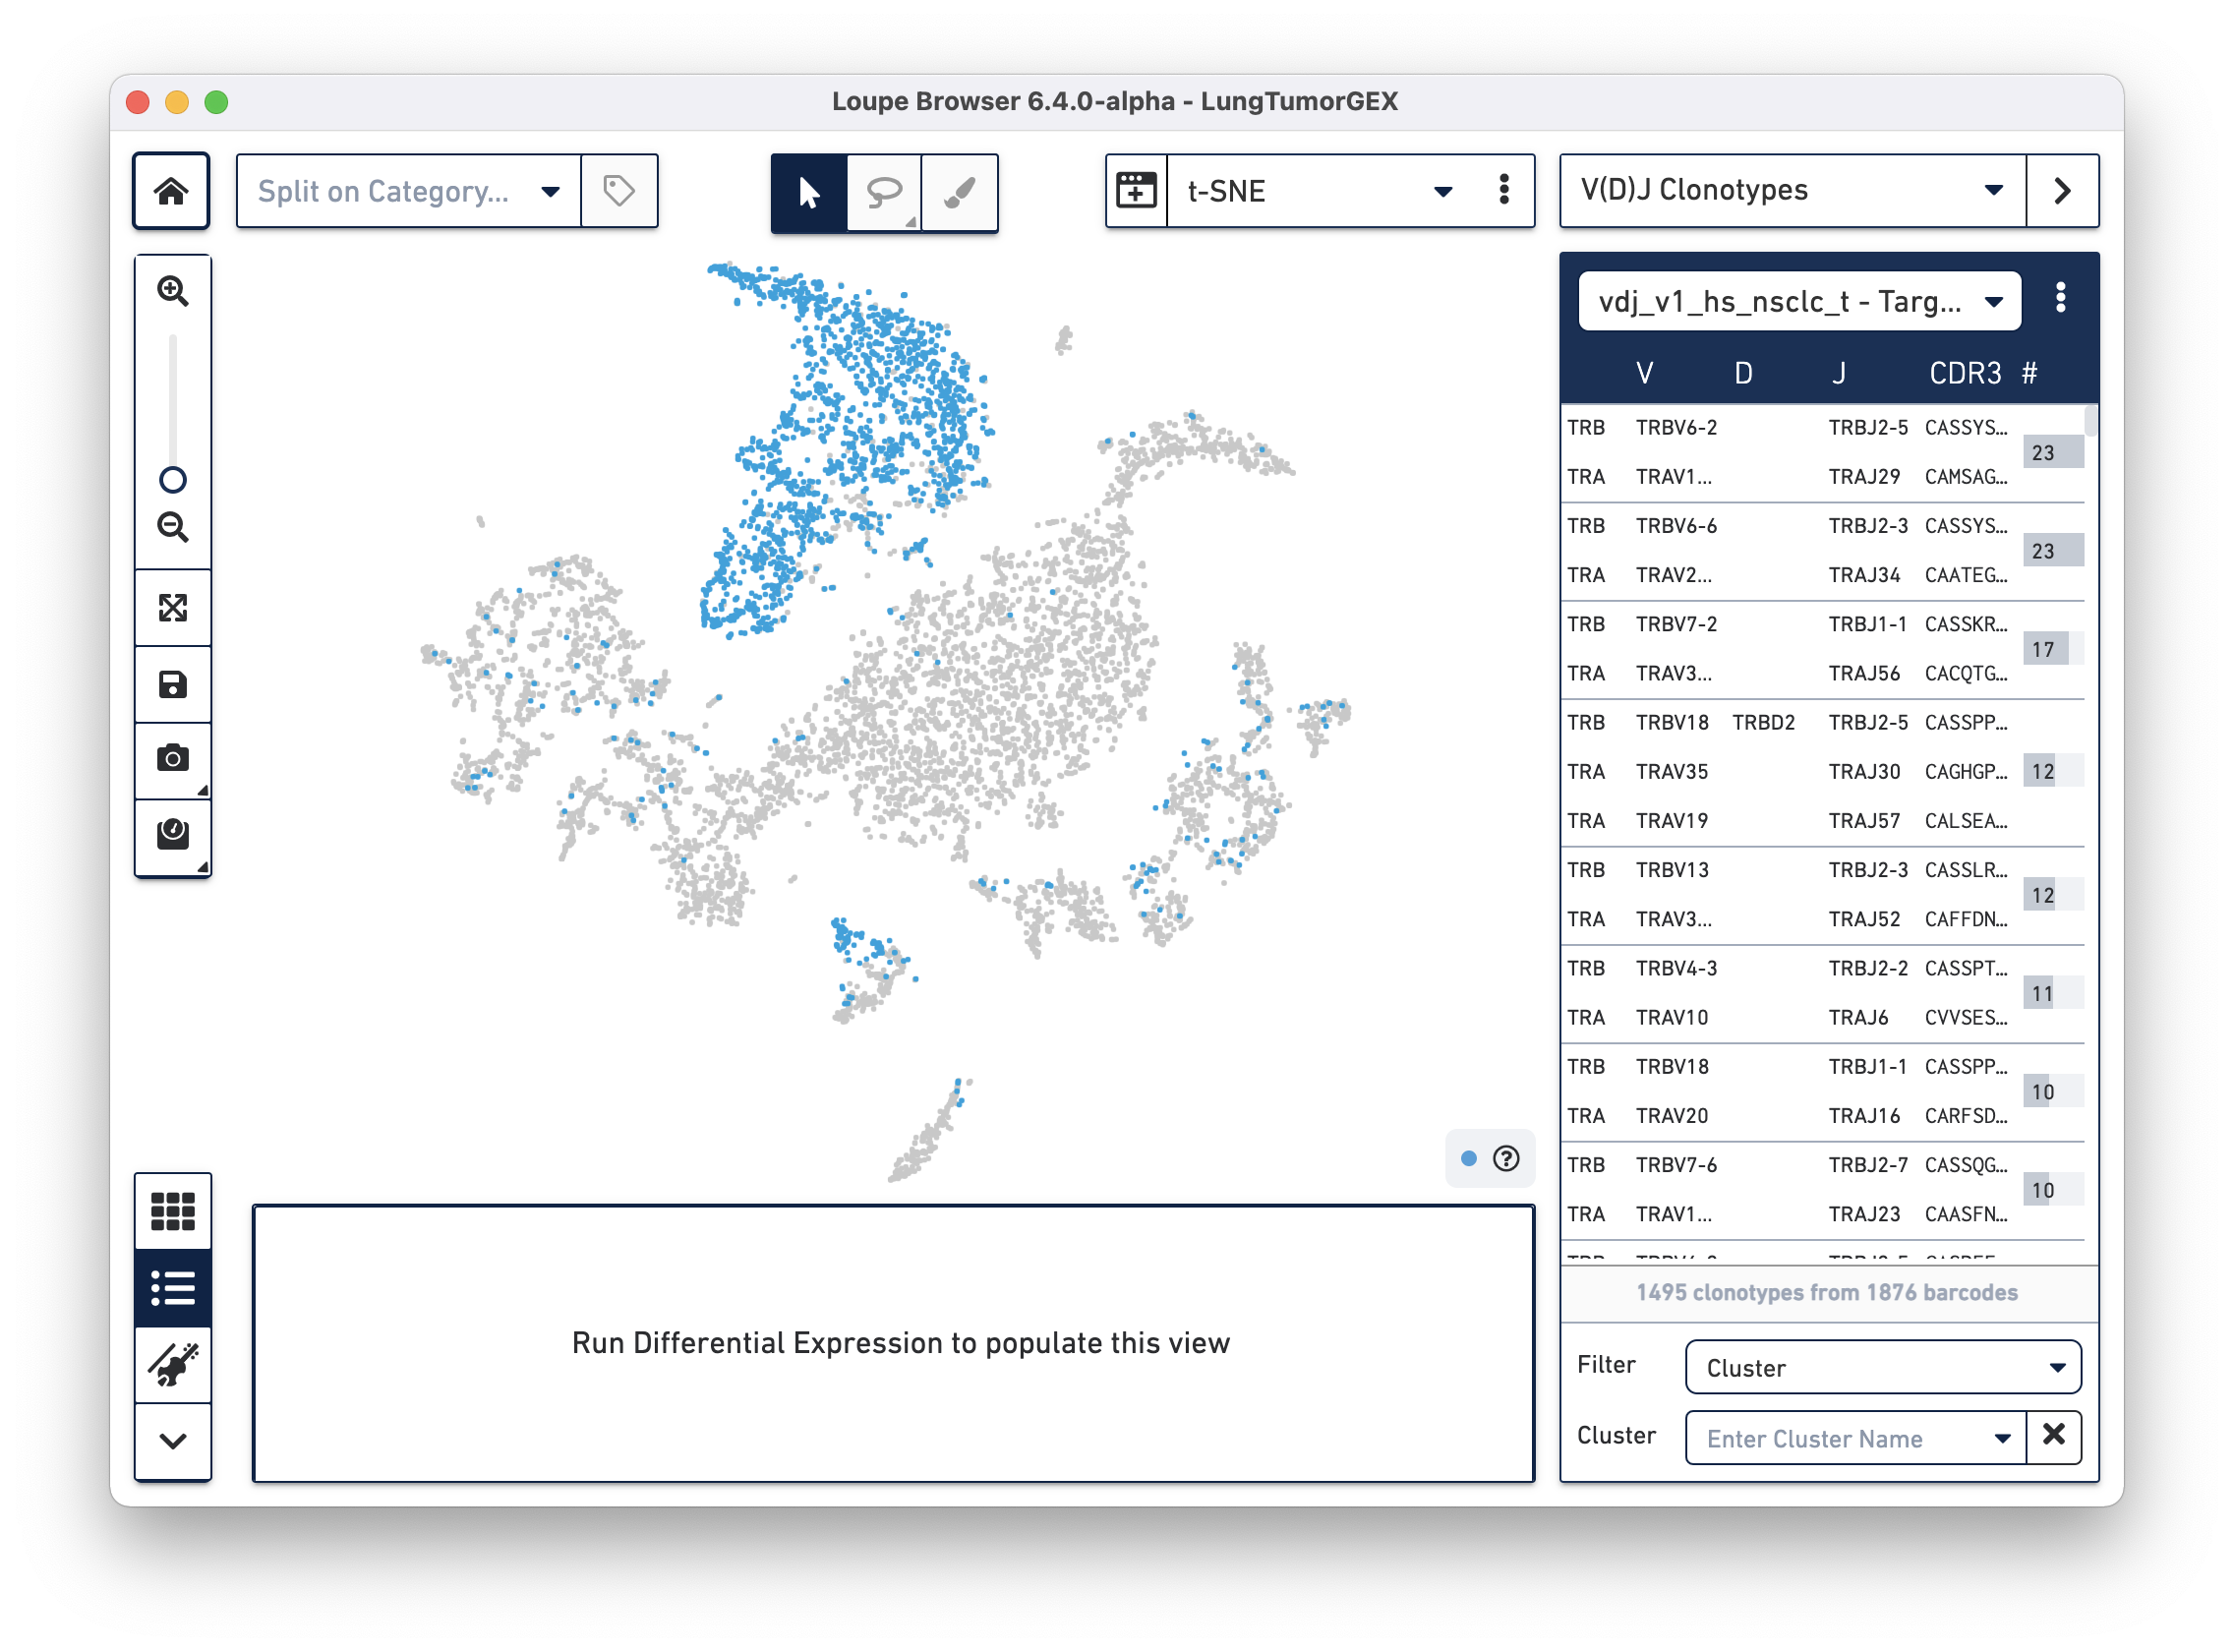
The numbers to the right of the clonotype list are the number of cells within that V(D)J clonotype that were also found in the Gene Expression dataset. Because barcoding happened before the sample was divided into V(D)J and Gene Expression libraries, the same cells appear in both data sets, and the barcodes match.
The sidebar dropdown menu has options to select all clonotypes in the active list and import or remove clonotype lists. It is possible to load multiple V(D)J files for a single Gene Expression file to look at T cell clonotypes, B cell clonotypes, and gene expression profiles, all in the same view.
One key benefit of running an integrated 5' Gene Expression and V(D)J experiment is the ability to associate phenotypes with clonotypes of interest. There are several ways to do this in Loupe Browser.
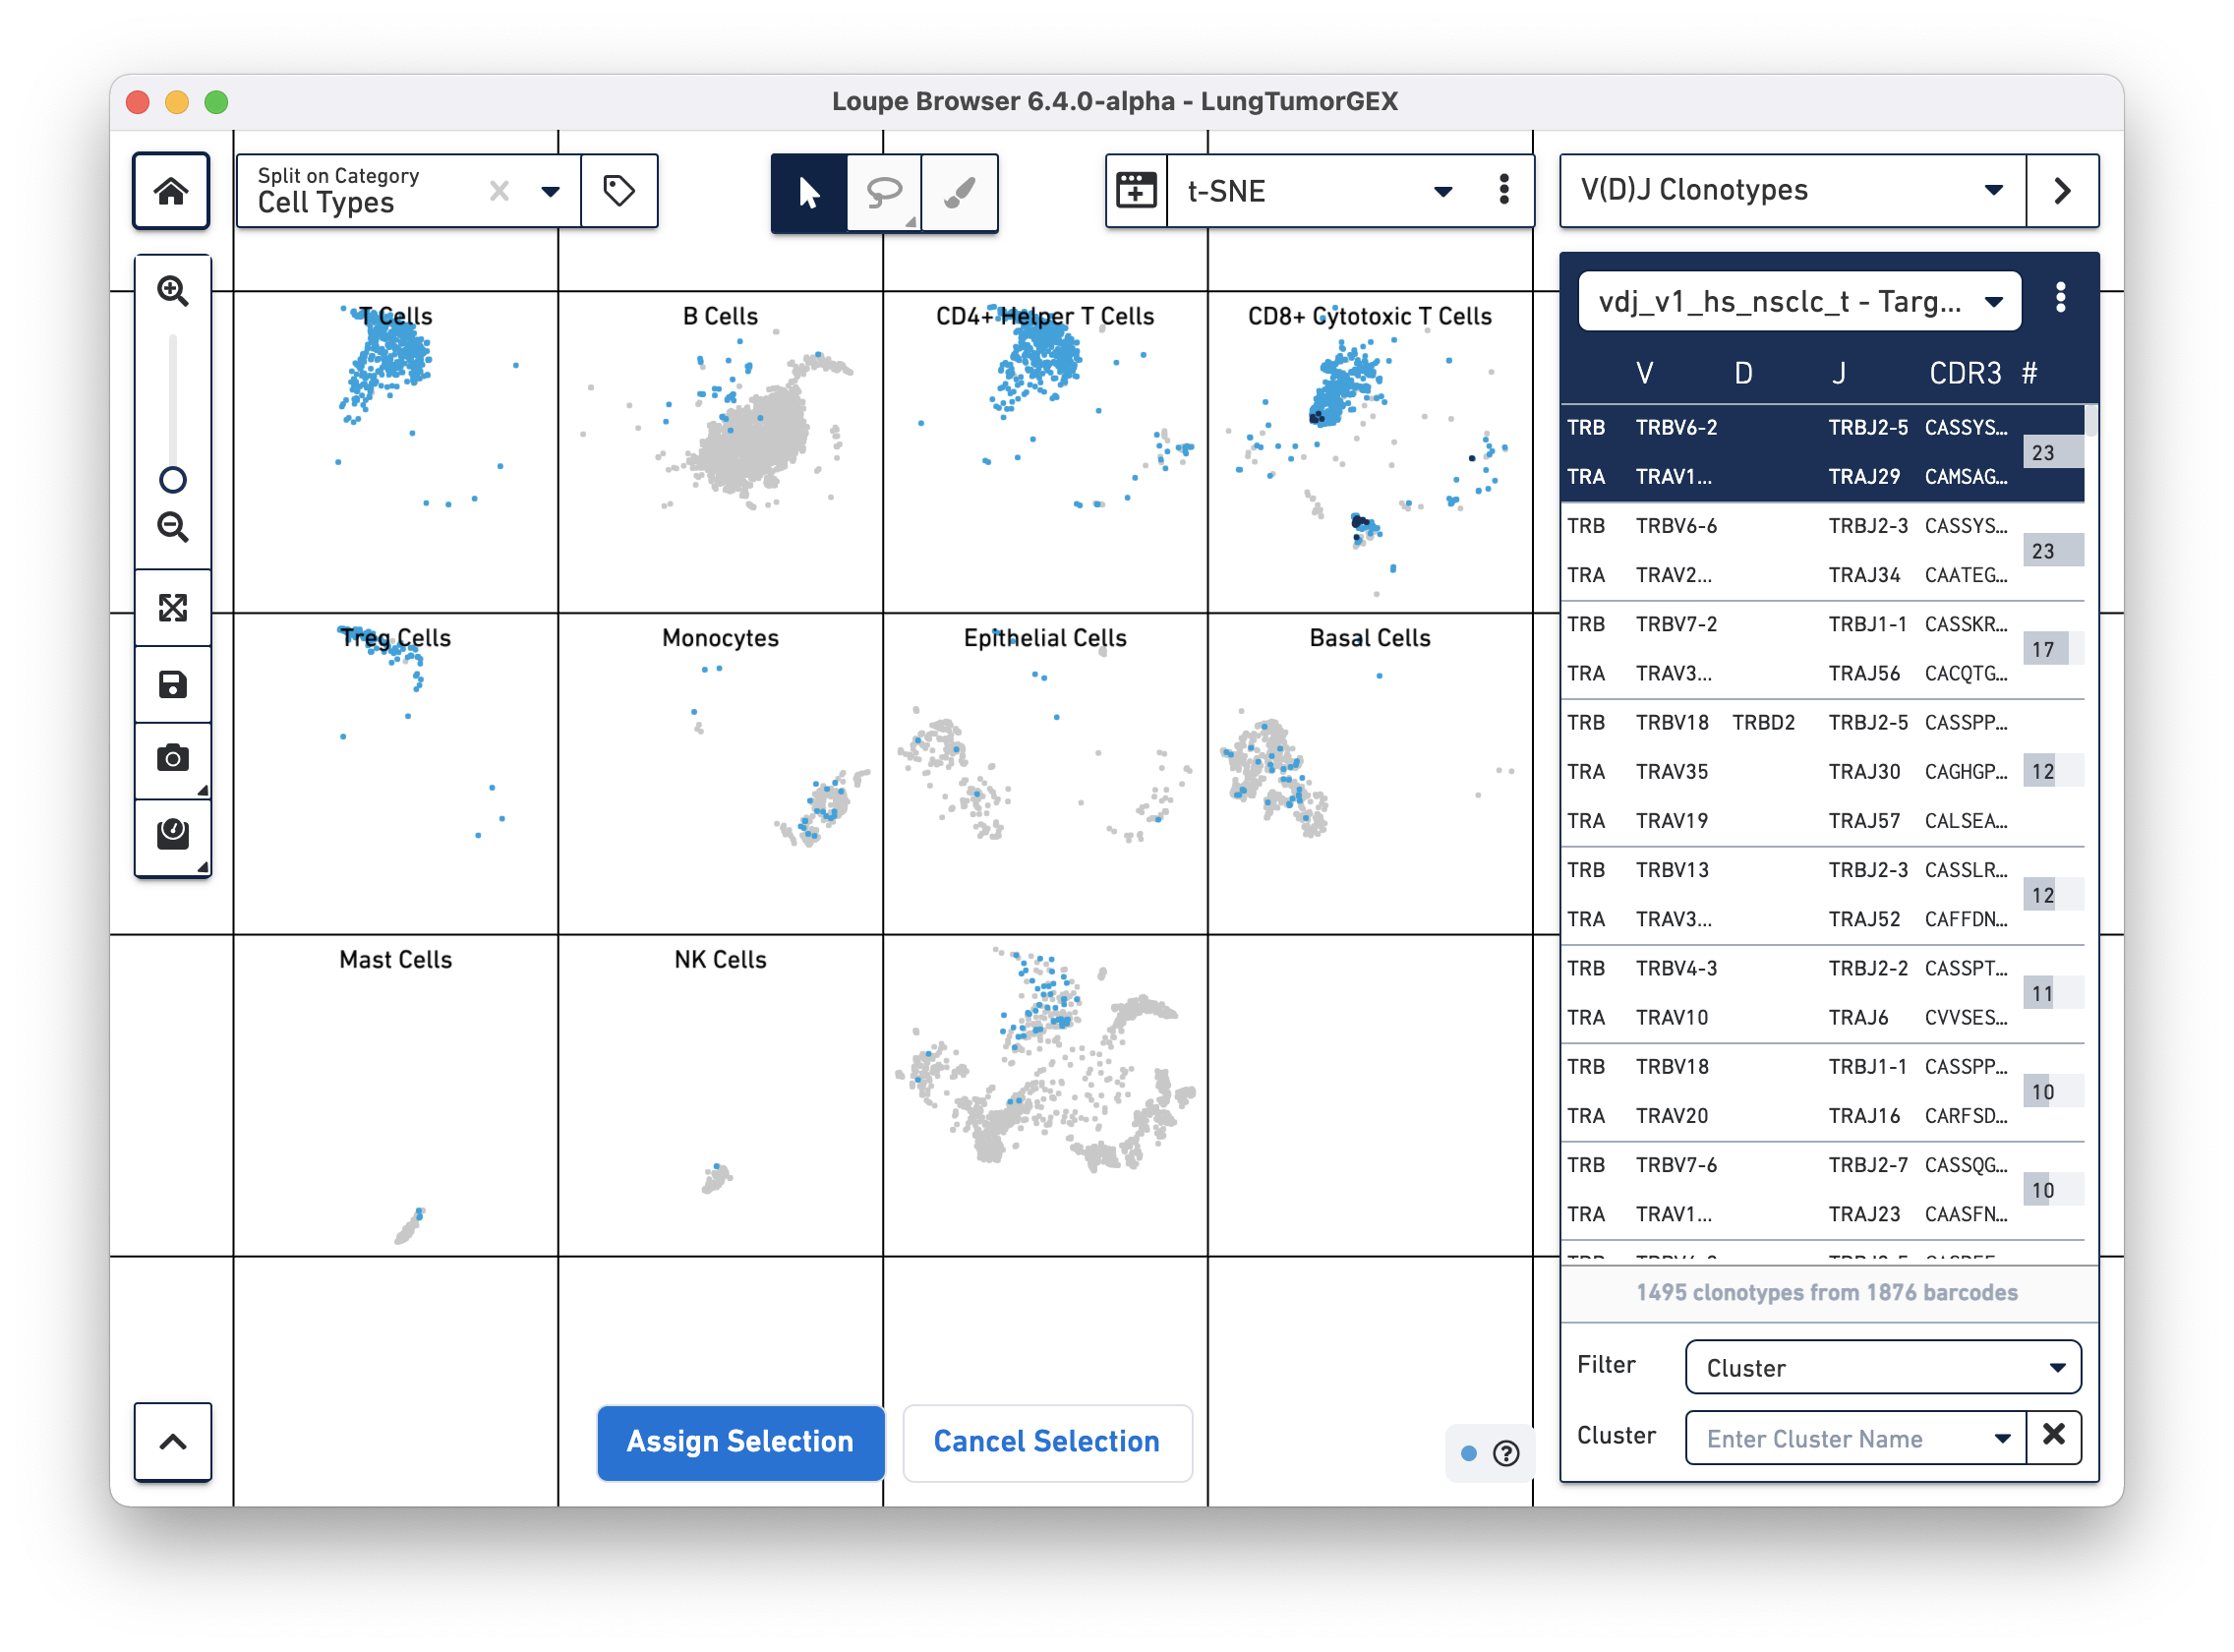
To identify the phenotype of the top T cell clonotypes, select Cell Types from the Split on Category... box in the top left corner of the browser. We assigned the "Cell Types" category when we manually annotated the dataset. You can see that the CD4+ helper T cells are in the third box on the top row, CD8+ cytotoxic T cells are at the upper right, CD4-/CD8- T cells are at the upper left, and Treg cells are directly below those in the first box on the second row.
You can highlight the location of the cells of a single clonotype by clicking on the clonotype in the sidebar. The top clonotype, highlighted in dark blue on the tSNE plot, falls exclusively within the top right CD8+ cytotoxic T cell cluster, as shown below
For this dataset, clicking on the top few clonotypes shows that the most abundant clonotypes here are often those of cytotoxic T cells.
Another way of looking at the relationship between phenotype and clonotype is to filter the clonotype list by a gene expression cluster. Select Cluster from the Filter selector in the sidebar, and then start typing the name of the cluster in the Cluster field. As you type, the field offers autocomplete suggestions. Selecting the CD4+ helper T Cell cluster shows the complete list of clonotypes among the cells in that group, and highlights only those cells in the plot:
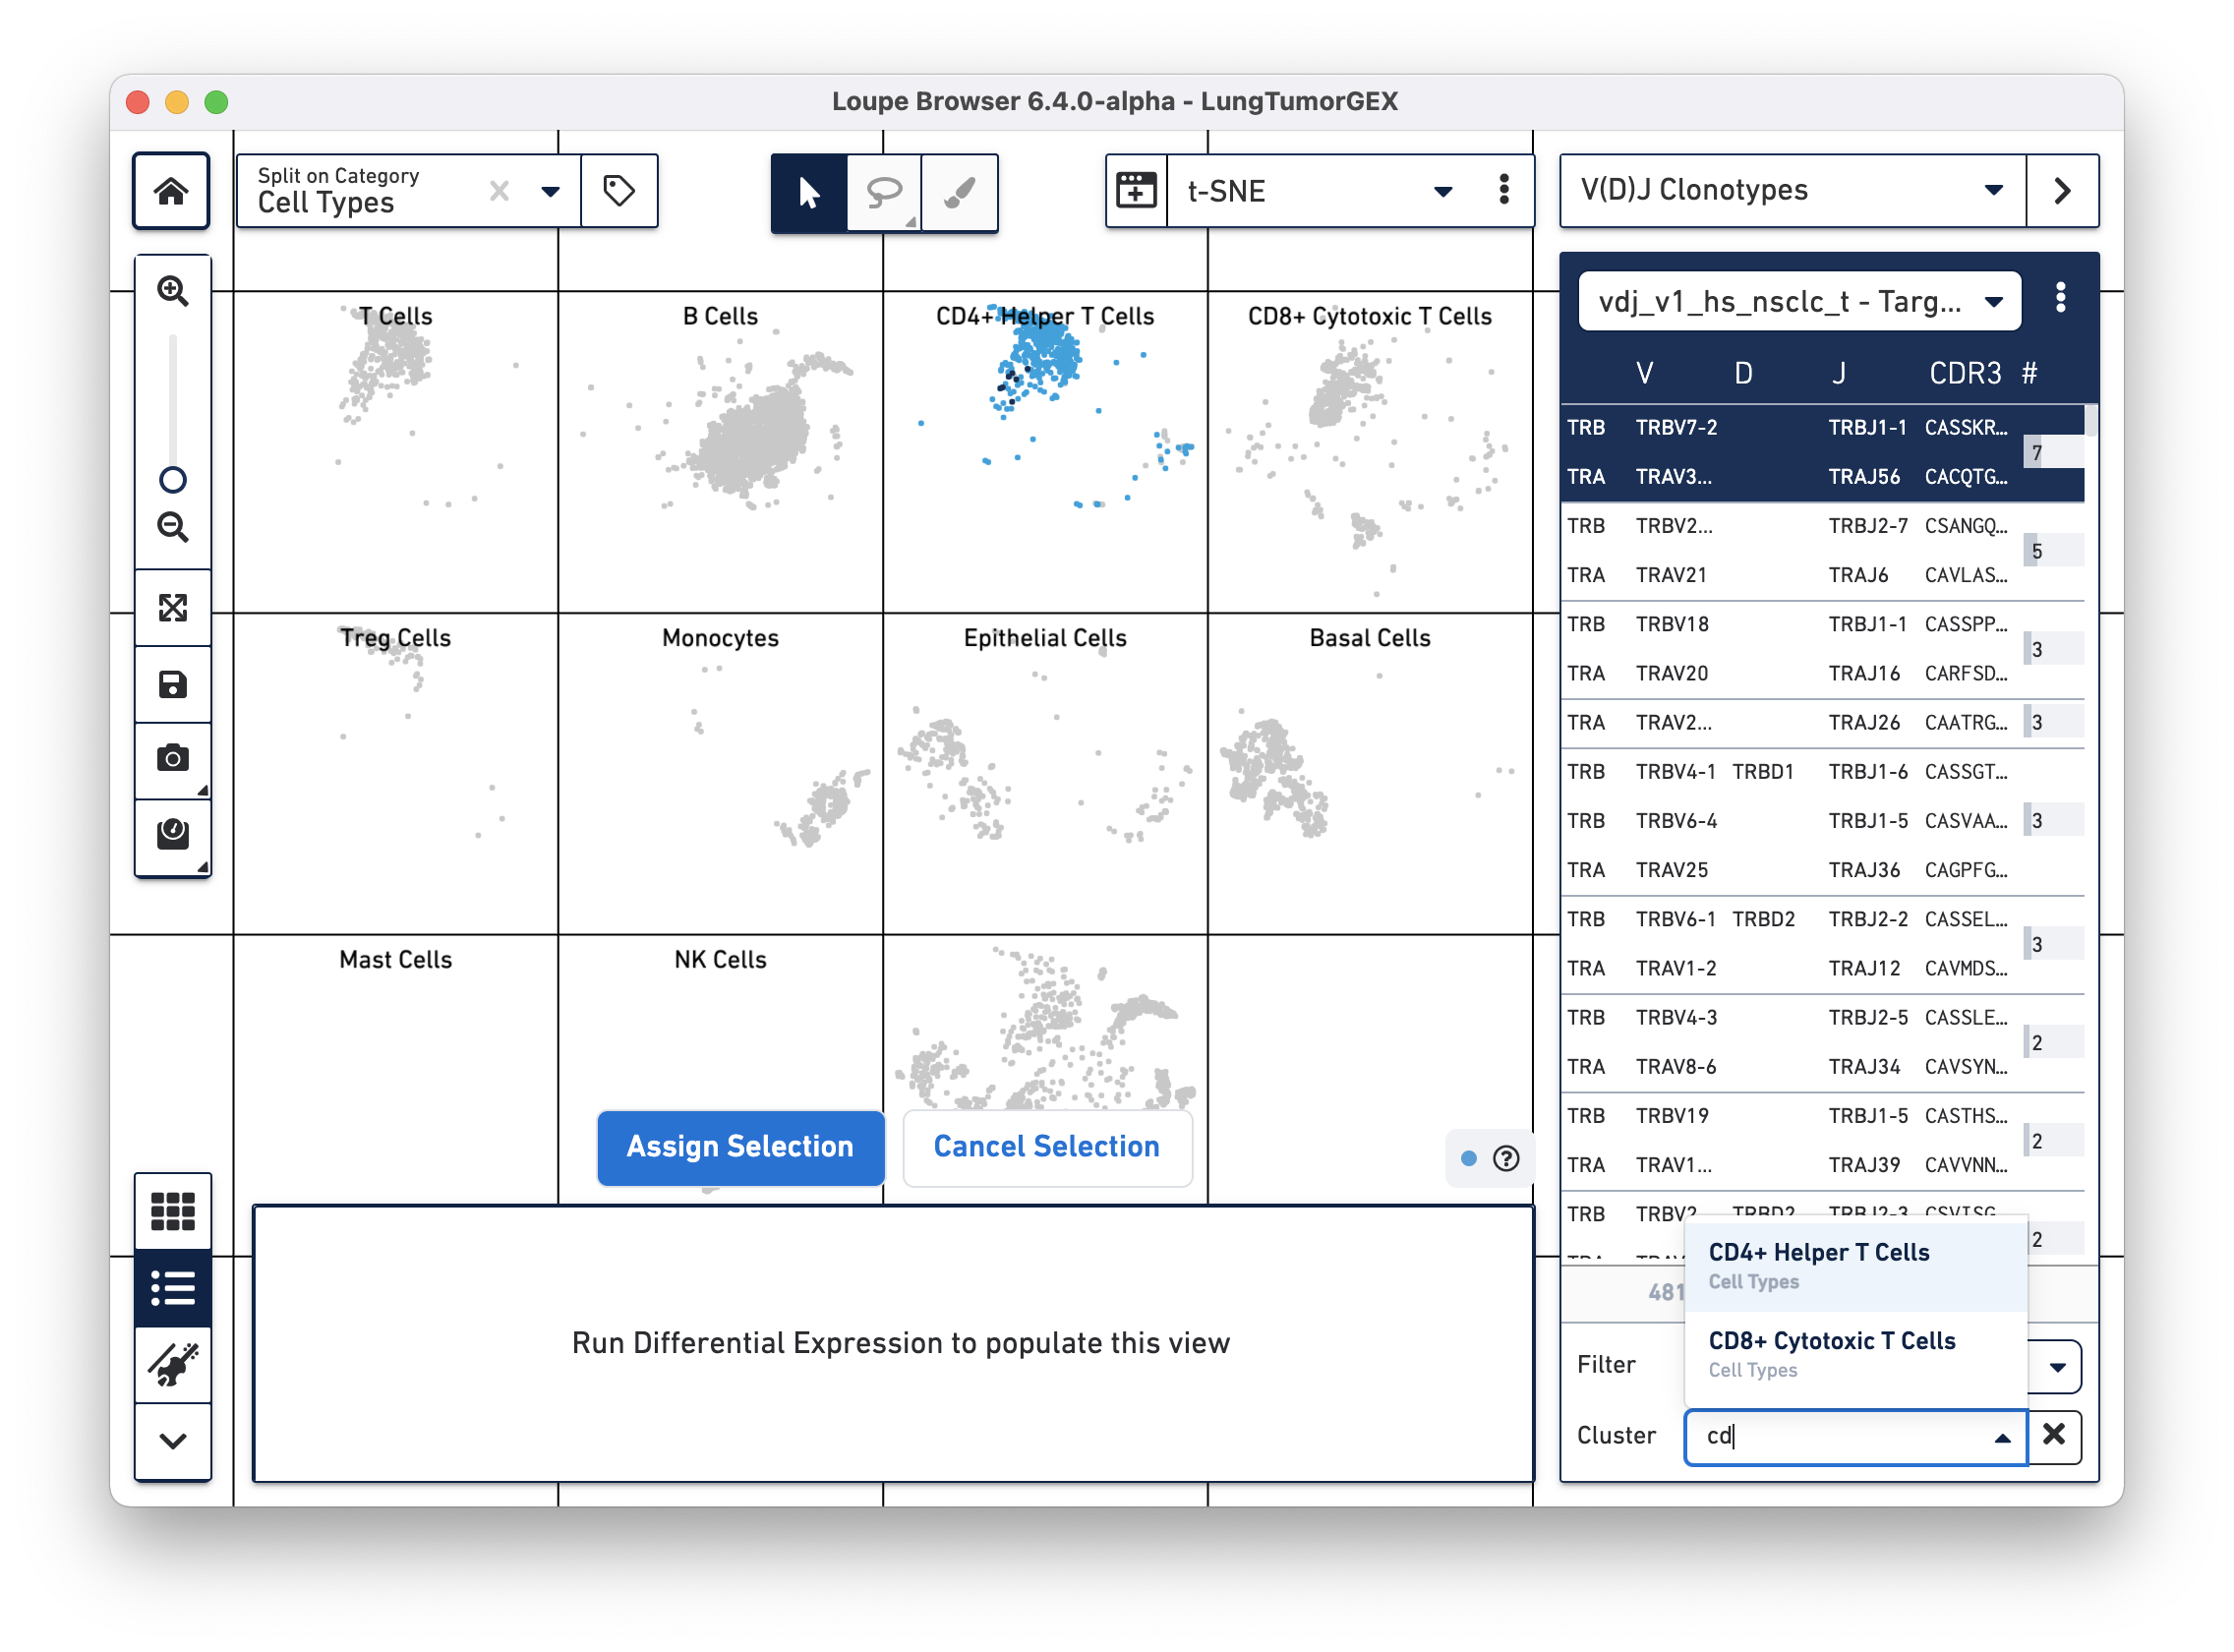
You can see there are a few expanded helper T cell clones as well.
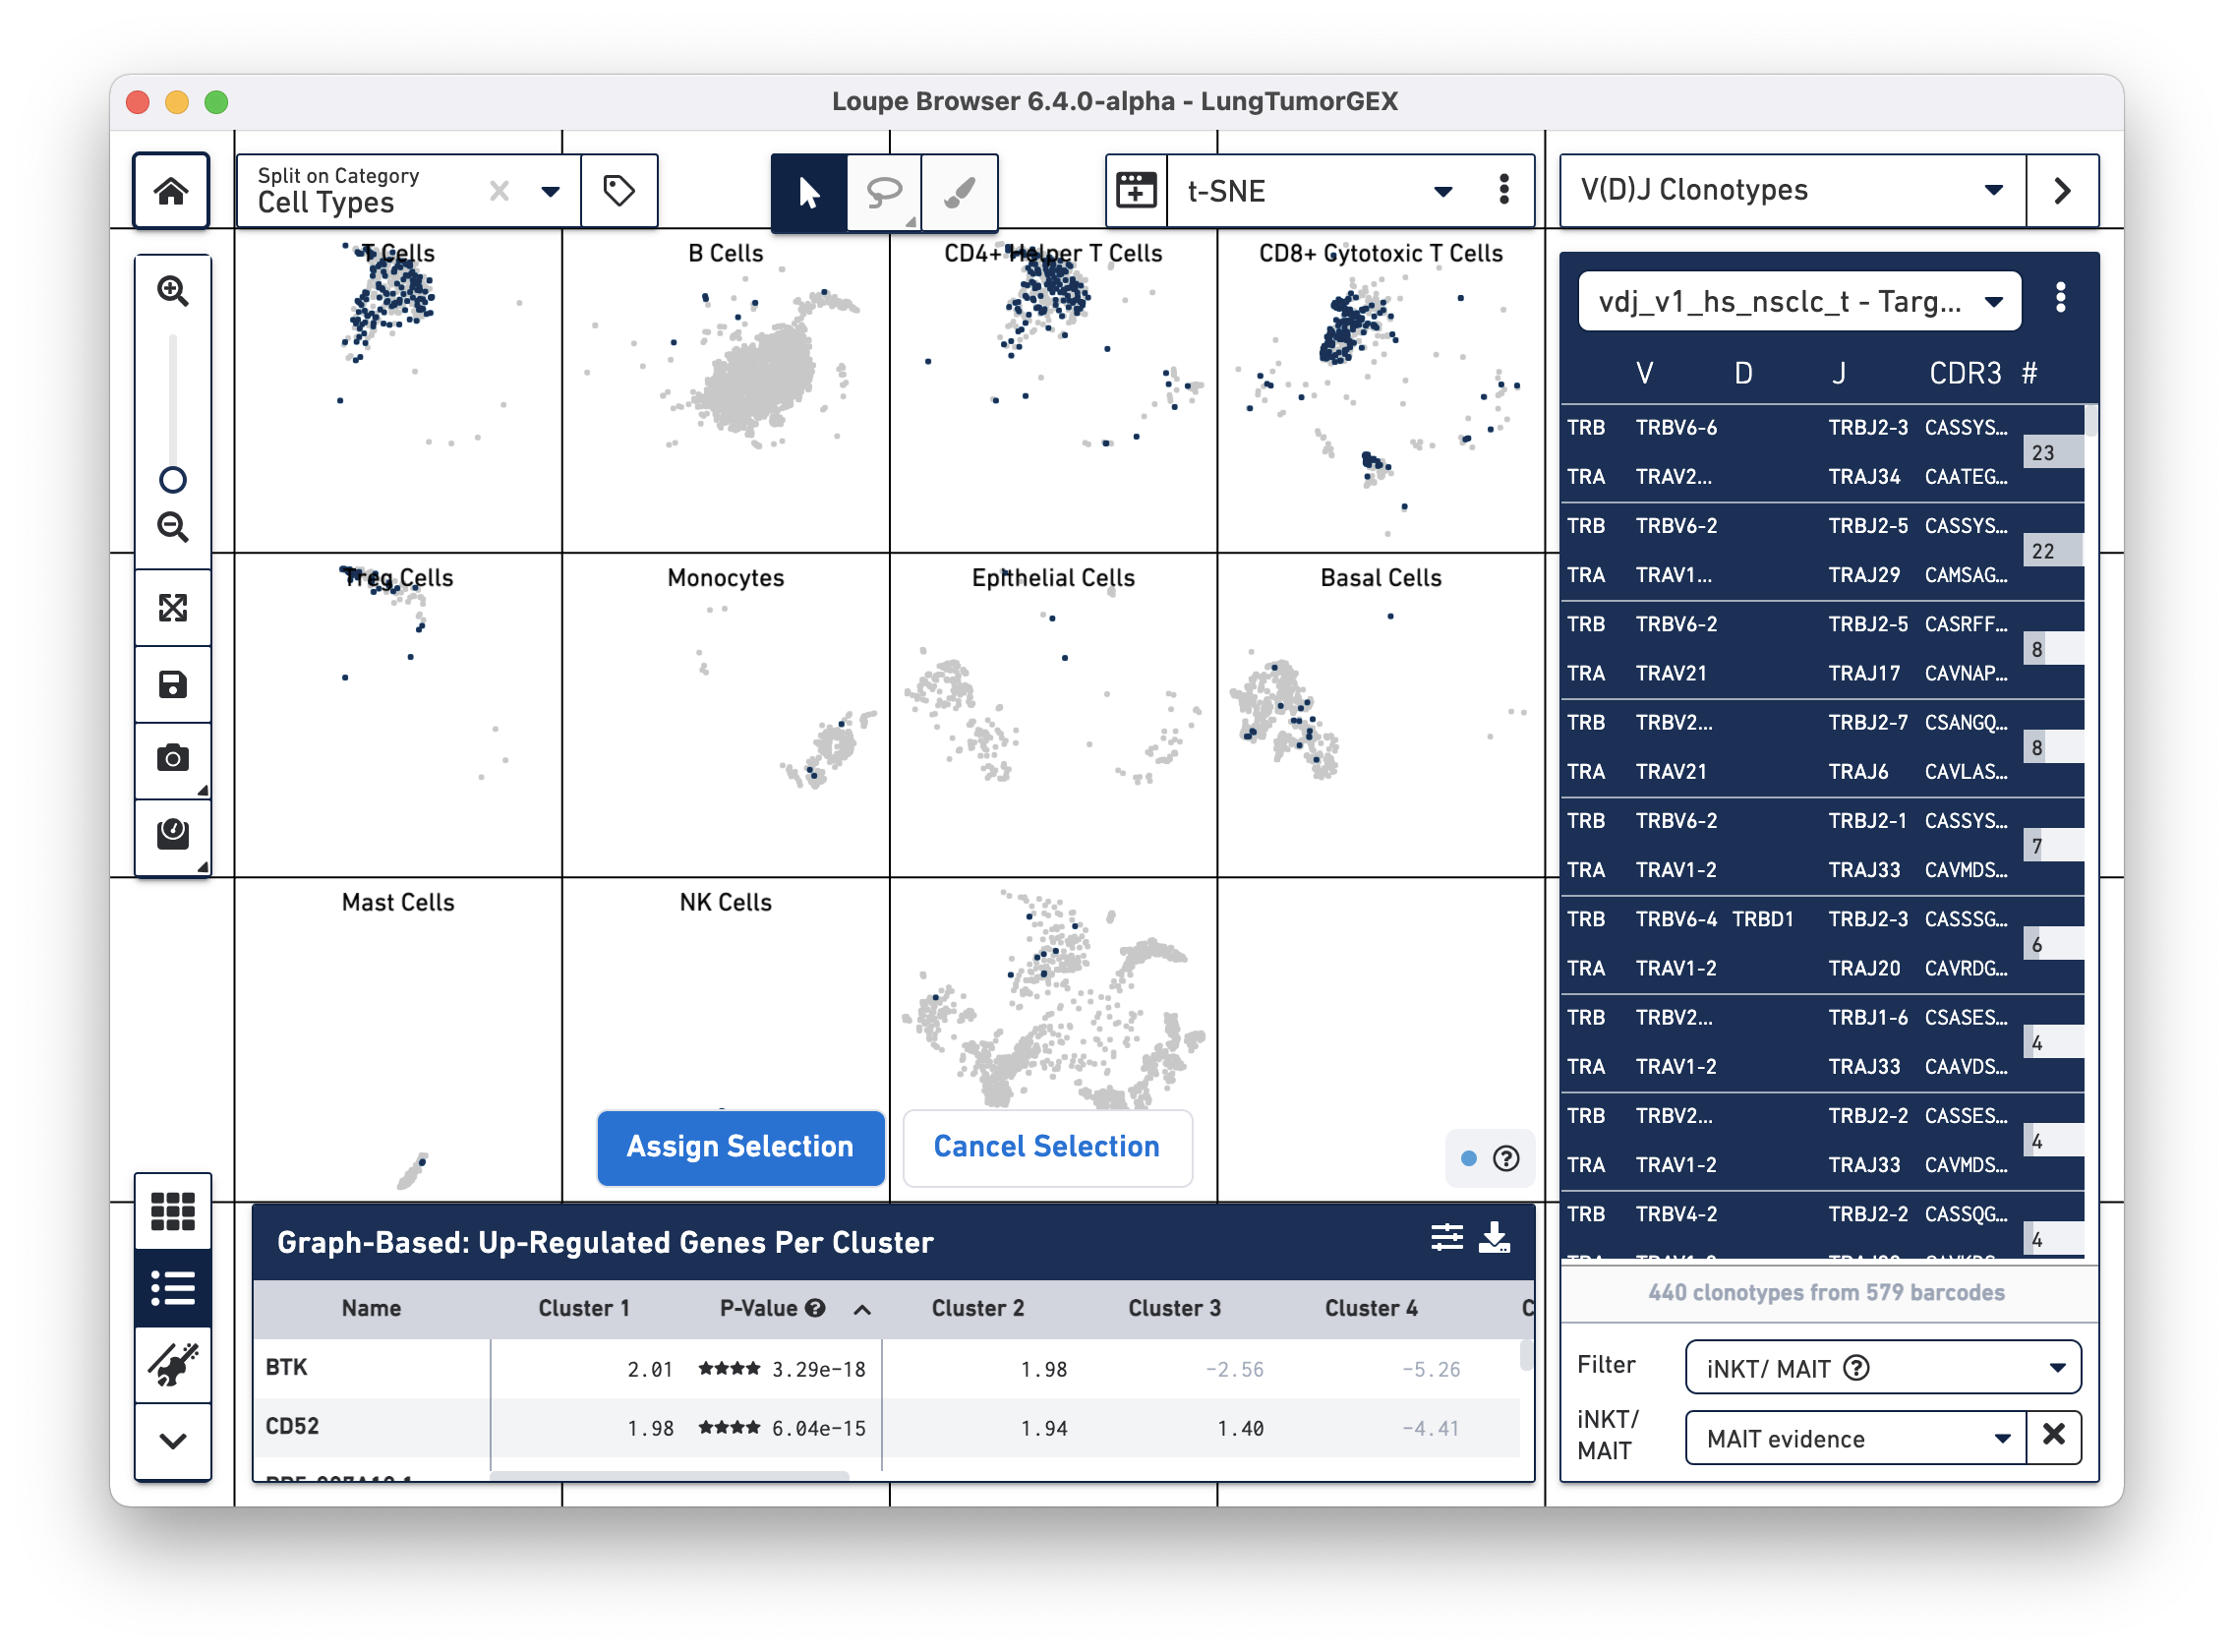
It is also possible to create new groups of cells based on the clonotypes. MAIT cells (mucosal-associated invariant T cells) are a small subset of T cells that guard against microbial activity and infections and have a semi-invariant TCR alpha chain, derived from the TRAV1-2 V gene and one of TRAJ12, TRAJ20, and TRAJ33 J gene segments. Here we will illustrate how to put the MAIT cells into their own cluster within the Cell Types category.
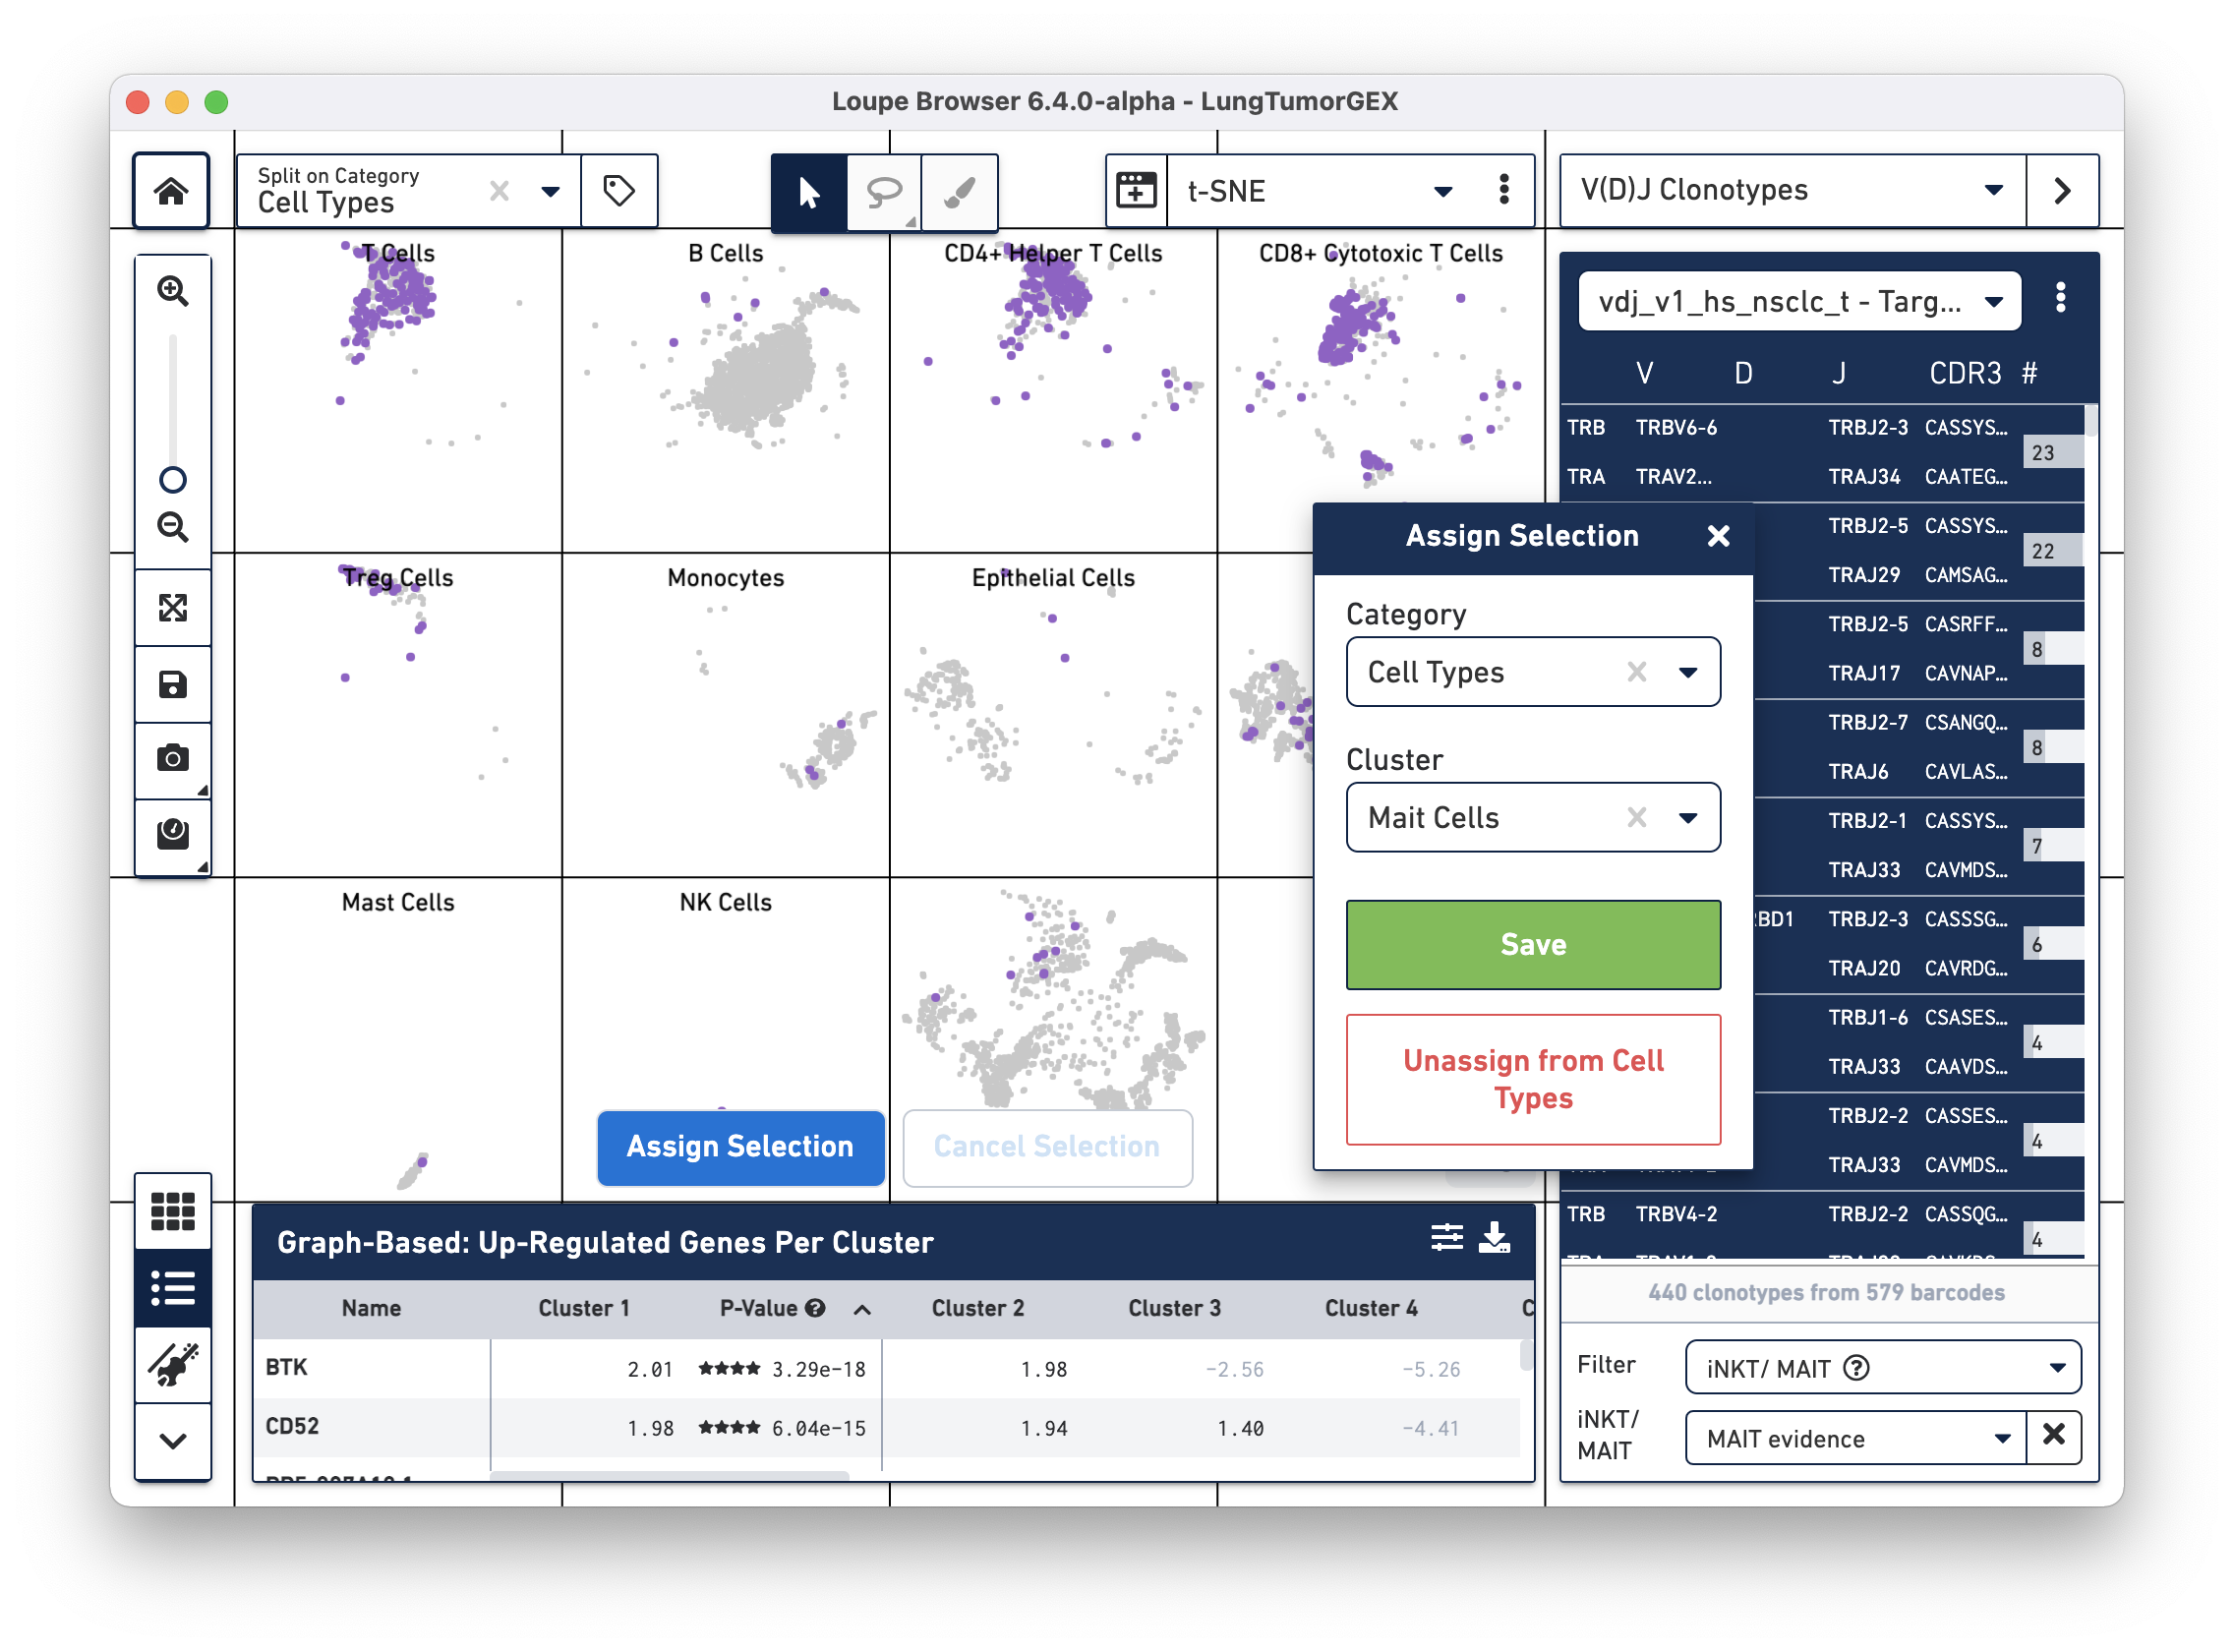
To identify MAIT cells, choose the iNKT/MAIT option for the Filter field, and select MAIT Evidence. After filtering, you can choose the Select All Clonotypes option from the action menu to highlight all clonotypes in the list. (You can also click on a single clonotype to highlight it, or use the Command key (Mac) or Control key (Windows) to highlight multiple clonotypes at once.) Right-click on the selected clonotypes to bring up the context menu, as shown below:
Click on Assign Selection to bring up the cluster assignment pop-up. Choose Cell Types as the category, and create a new MAIT Cells cluster:
You can try this process using the Gene Name filter to search for the genes mentioned above.
You can save this new annotation in the Cell Types category as a .cloupe file by selecting Save As from the FIle menu and giving the file a new name. Alternatively, you may wish to overwrite the existing .cloupe file by clicking the Save icon in the toolbar. We recommend saving different versions of the file using unique filenames in order to track your analysis journey and preserve the original .cloupe file.
In this part of the tutorial, we will use the BEAM V(D)J Tutorial dataset, where T cells reactive to CMV, Flu, and SARS-CoV-2 were spiked into the PBMCs of a donor at the following percentages, respectively: 40%, 10%, and 5%. We will import V(D)J clonotypes and BEAM (Antigen Capture) data into Loupe Browser, and identify cells that have high antigen specificity scores to two different antigens (Flu and SARS-CoV-2). We will also run differential gene expression analysis to identify genes that distinguish these two groups.
You must download these files to follow along:
Video tutorial:
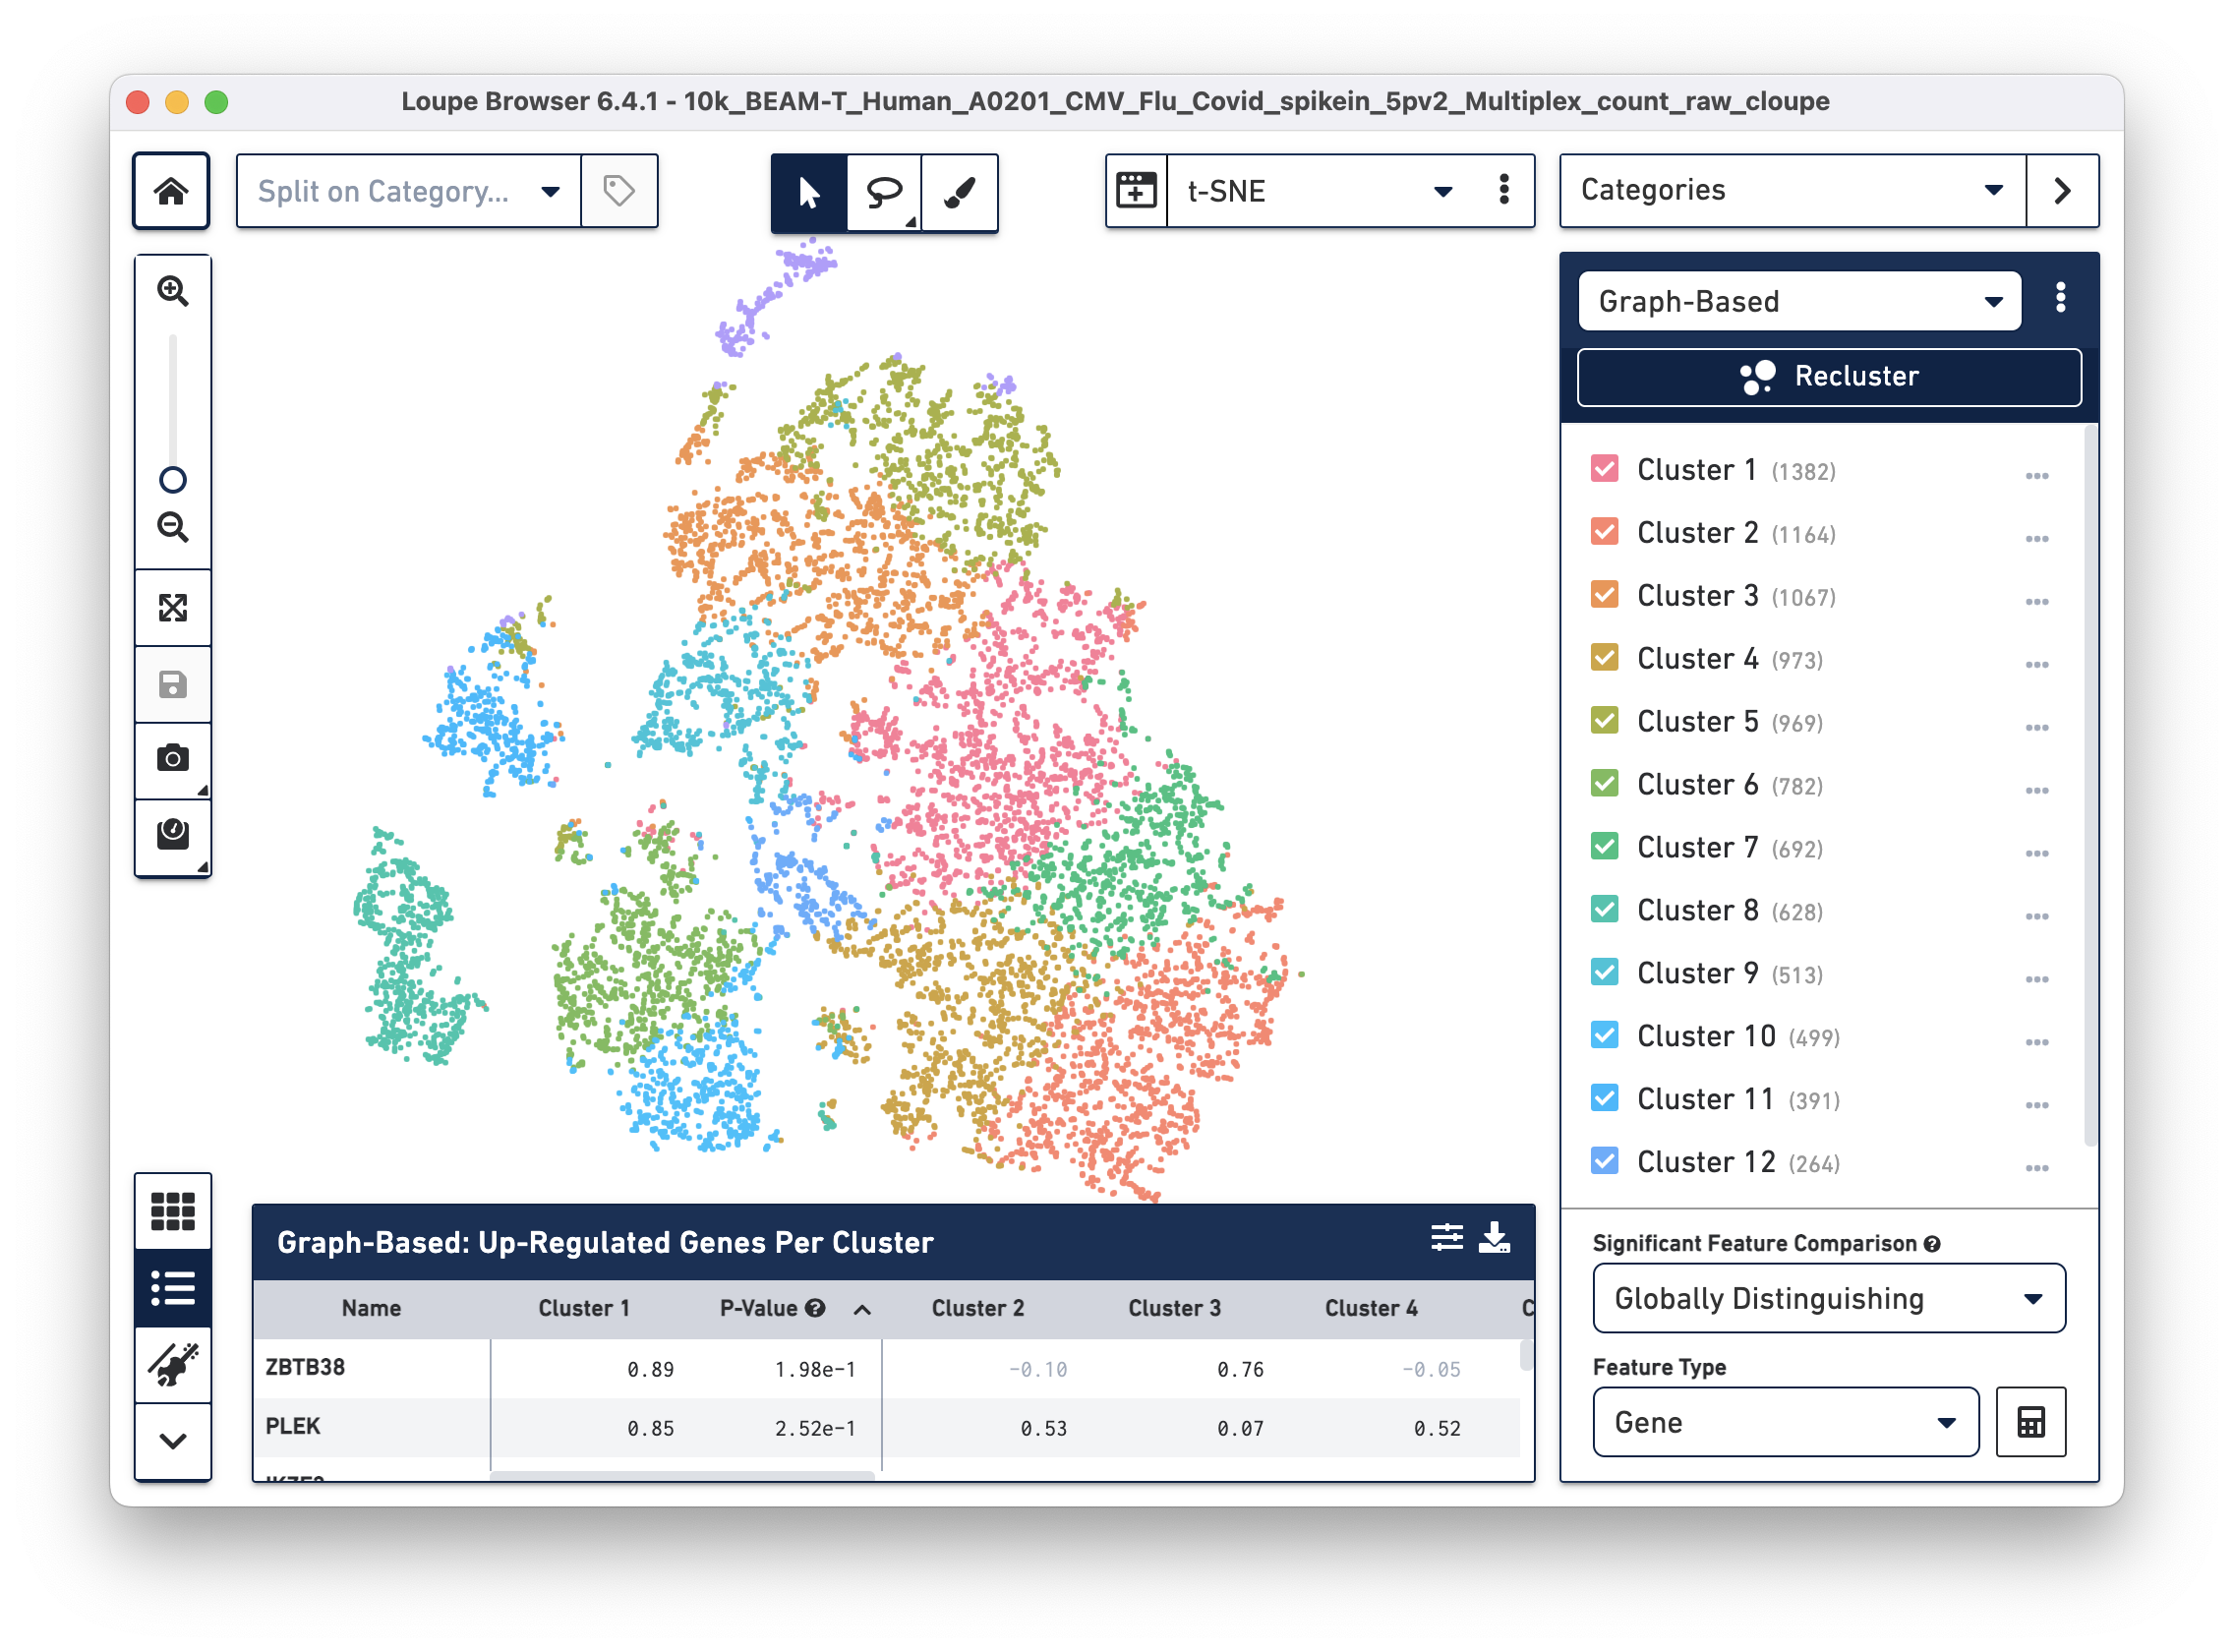
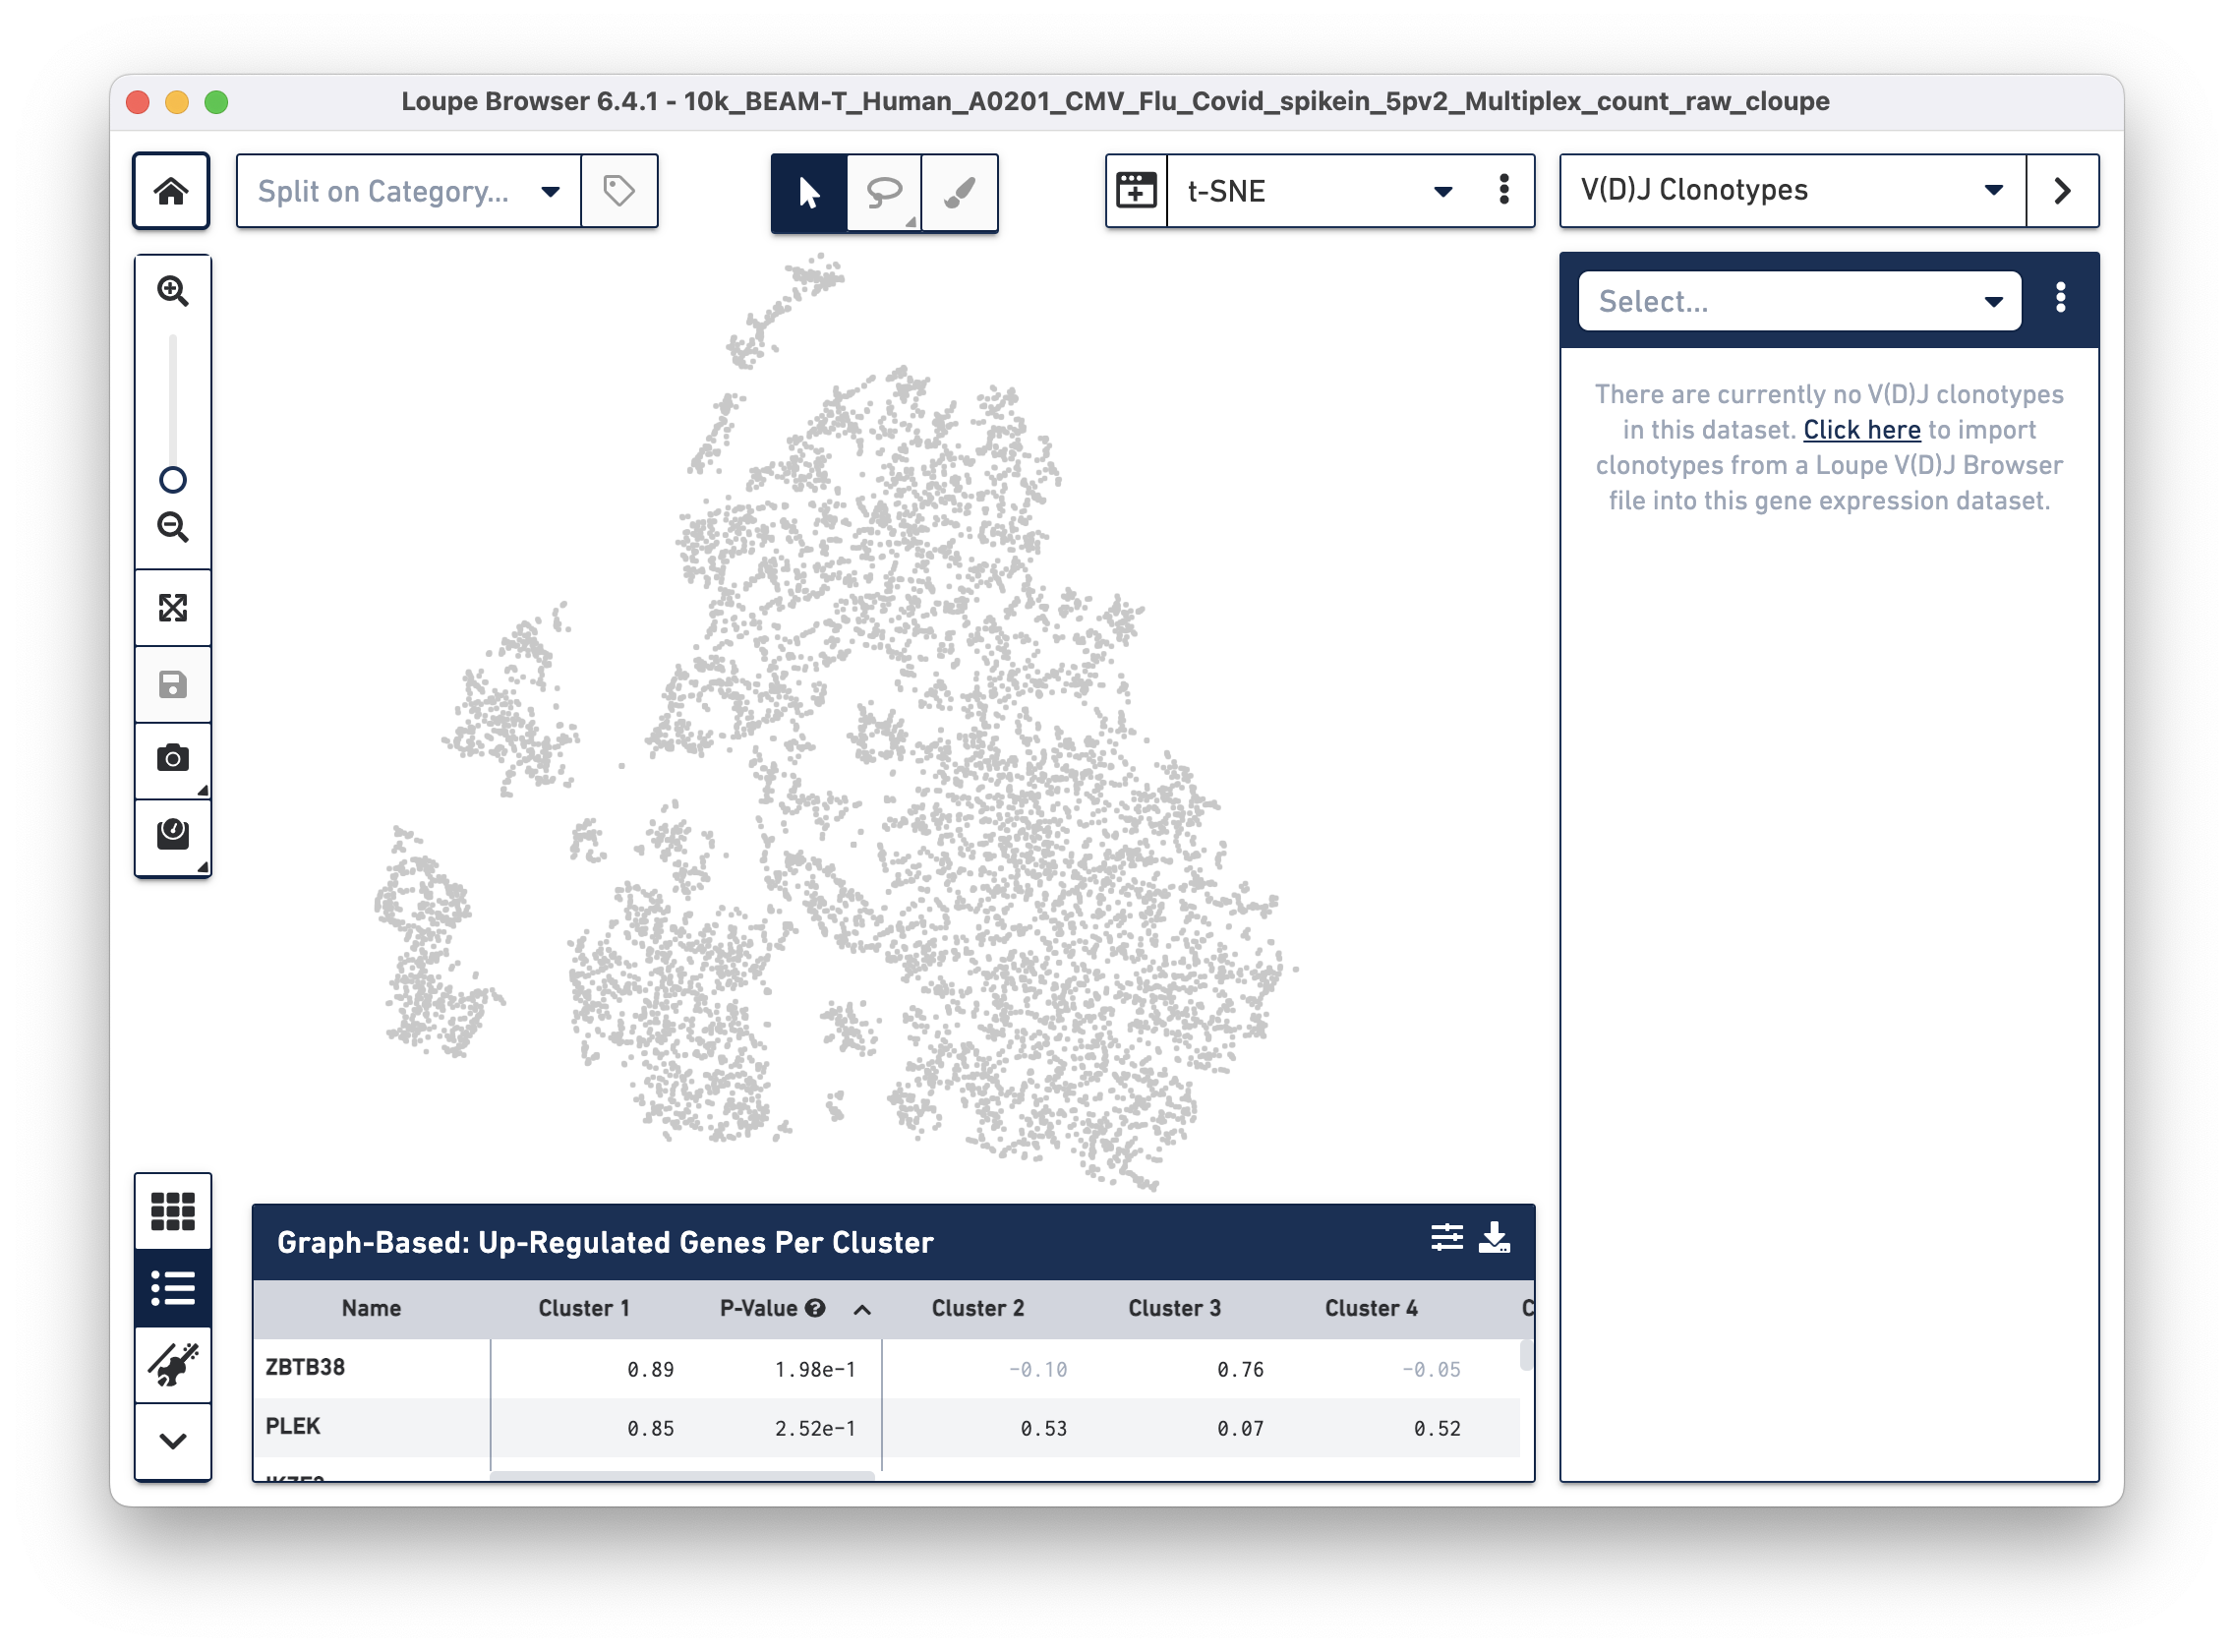
Open the 10k_BEAM-T_Human_A0201_CMV_Flu_Covid_spikein_5pv2_Multiplex_count_raw_cloupe file in Loupe Browser. You should see the t-SNE projection for cells from the BEAM-T dataset. Graph-based clustering shows thirteen clusters. To learn more about this dataset, visit the datasets page.
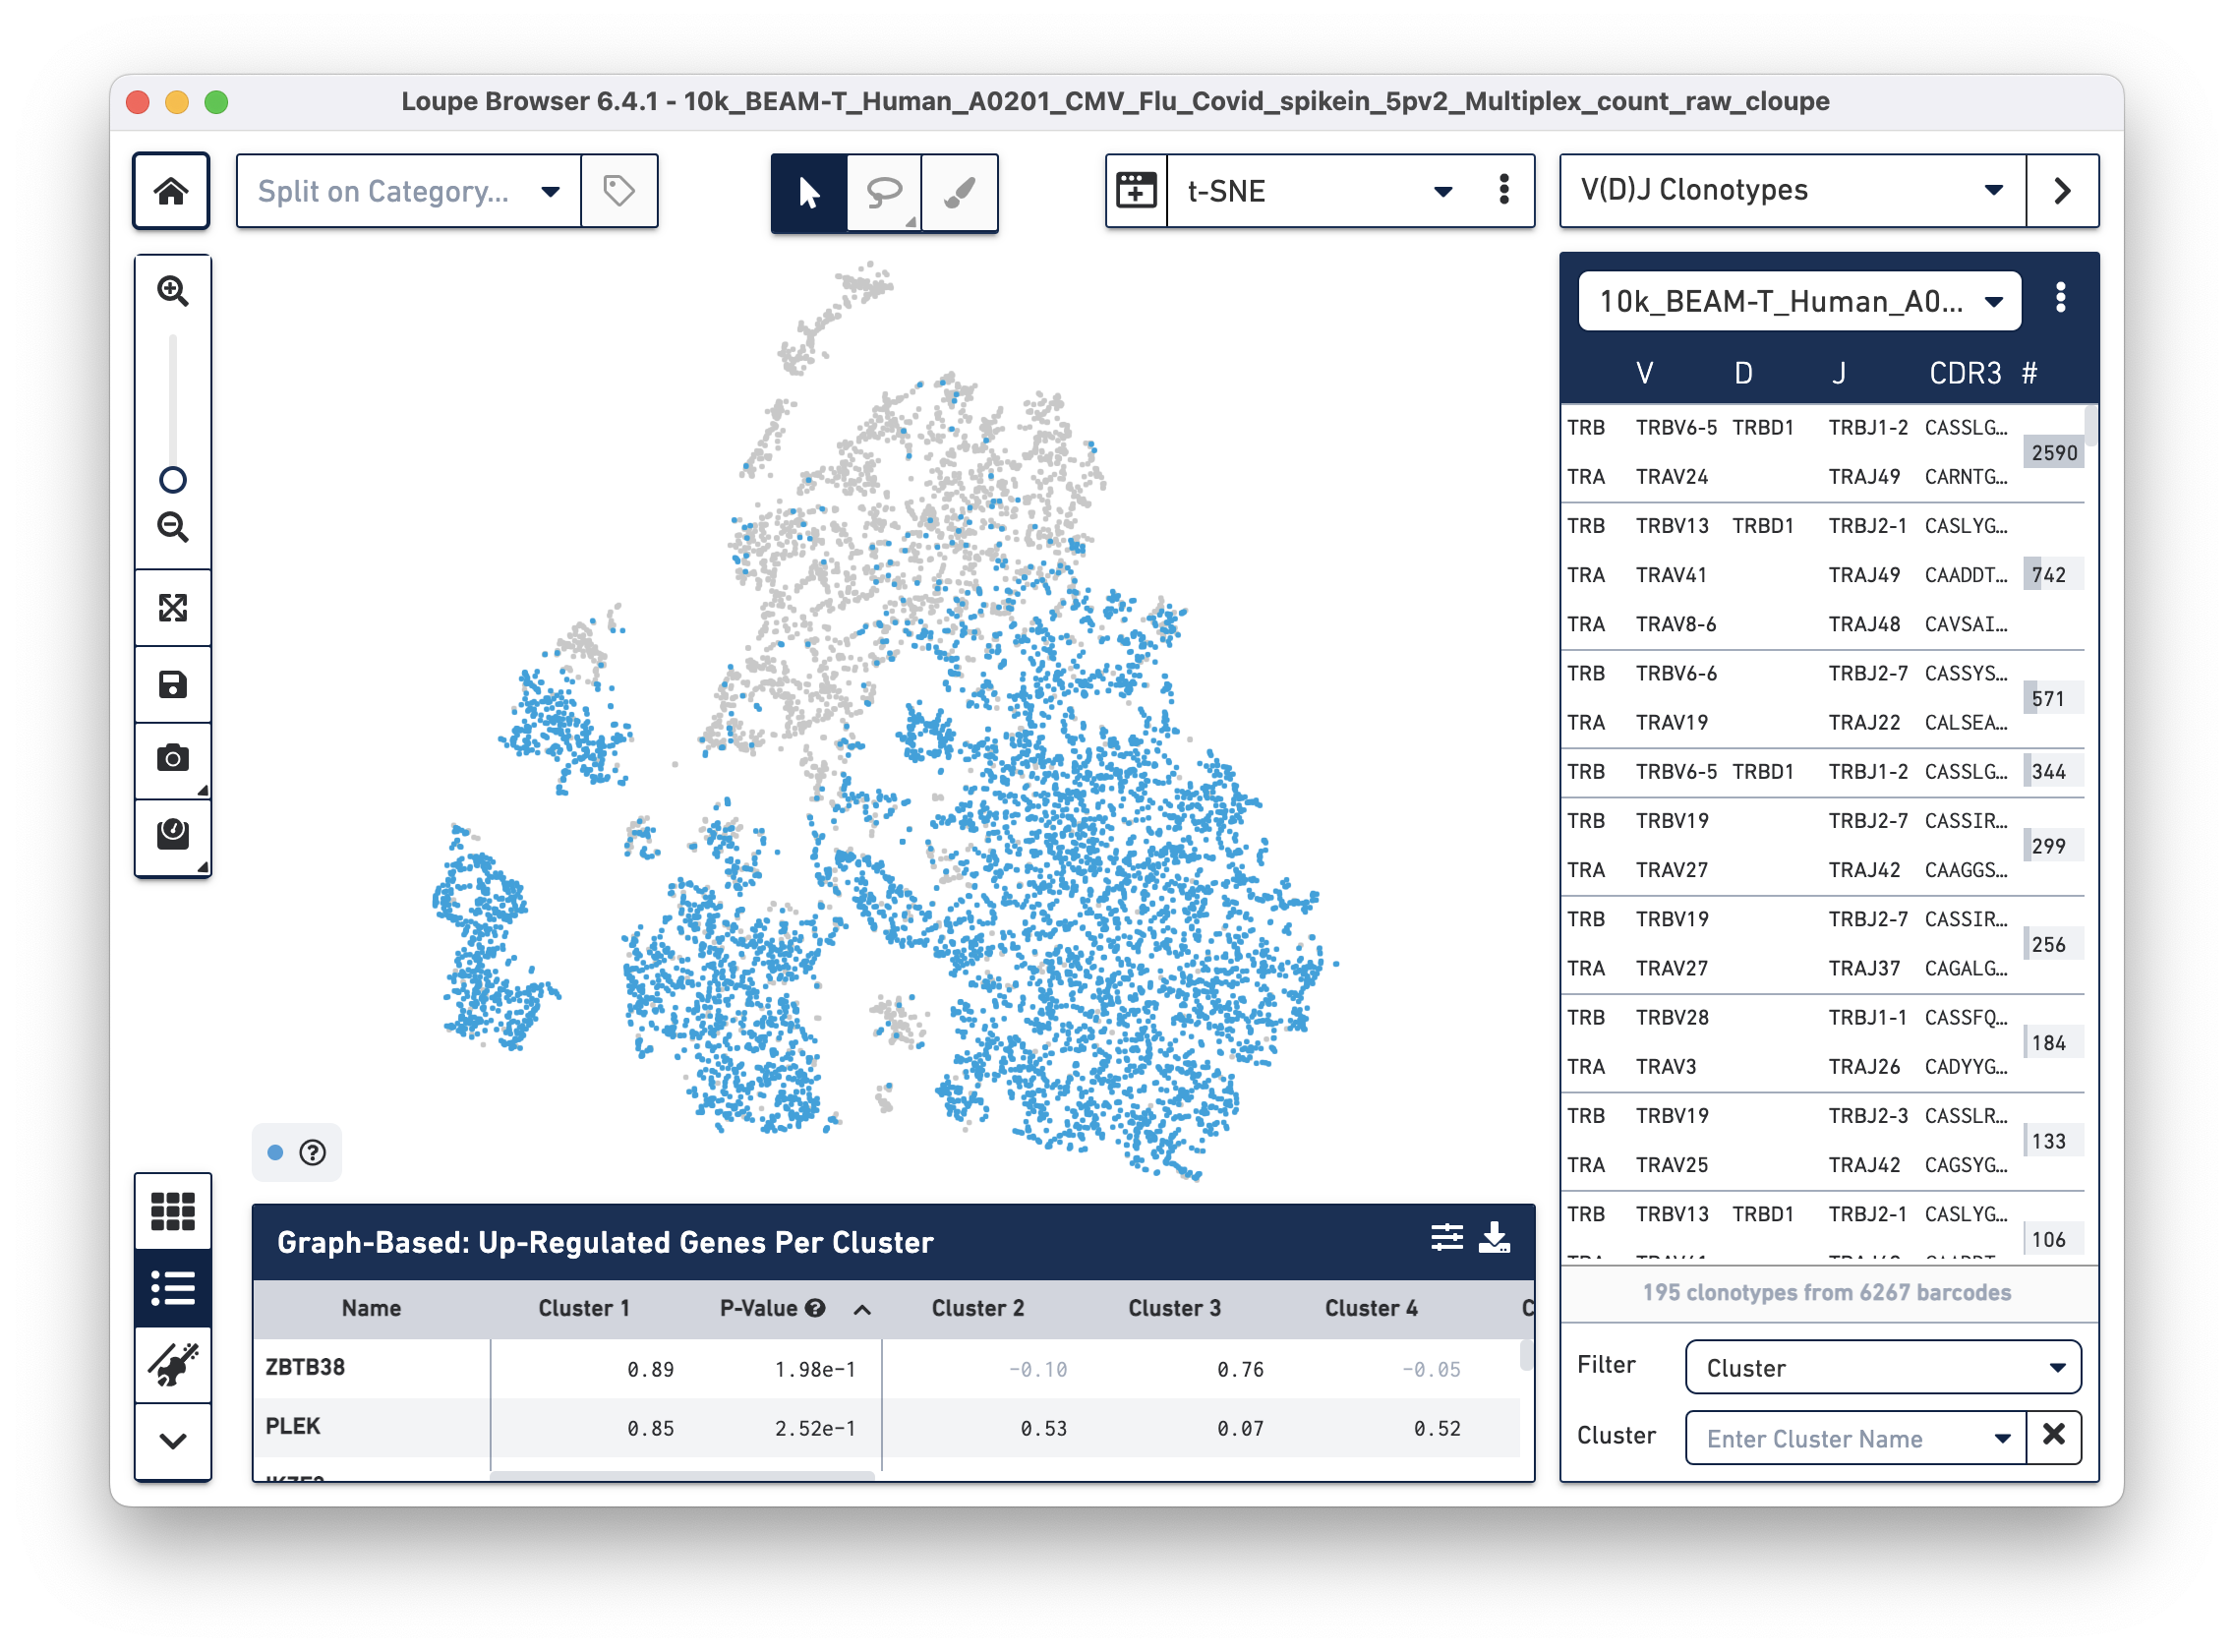
To overlay the V(D)J and BEAM (Antigen Capture) data on the gene expression data, import the corresponding .vloupe file. You can do this by clicking on the Categories dropdown menu and selecting V(D)J Clonotypes.
Then use the "Click here" button to import the 10k_BEAM-T_Human_A0201_CMV_Flu_Covid_spikein_5pv2_10k_BEAM-T_Human_A0201_CMV_Flu_Covid_spikein_5pv2_vdj_t_vloupe.vloupe file. All V(D)J clonotypes present in the .vloupe file are listed on the right panel, and T cells are colored in blue on the t-SNE plot.
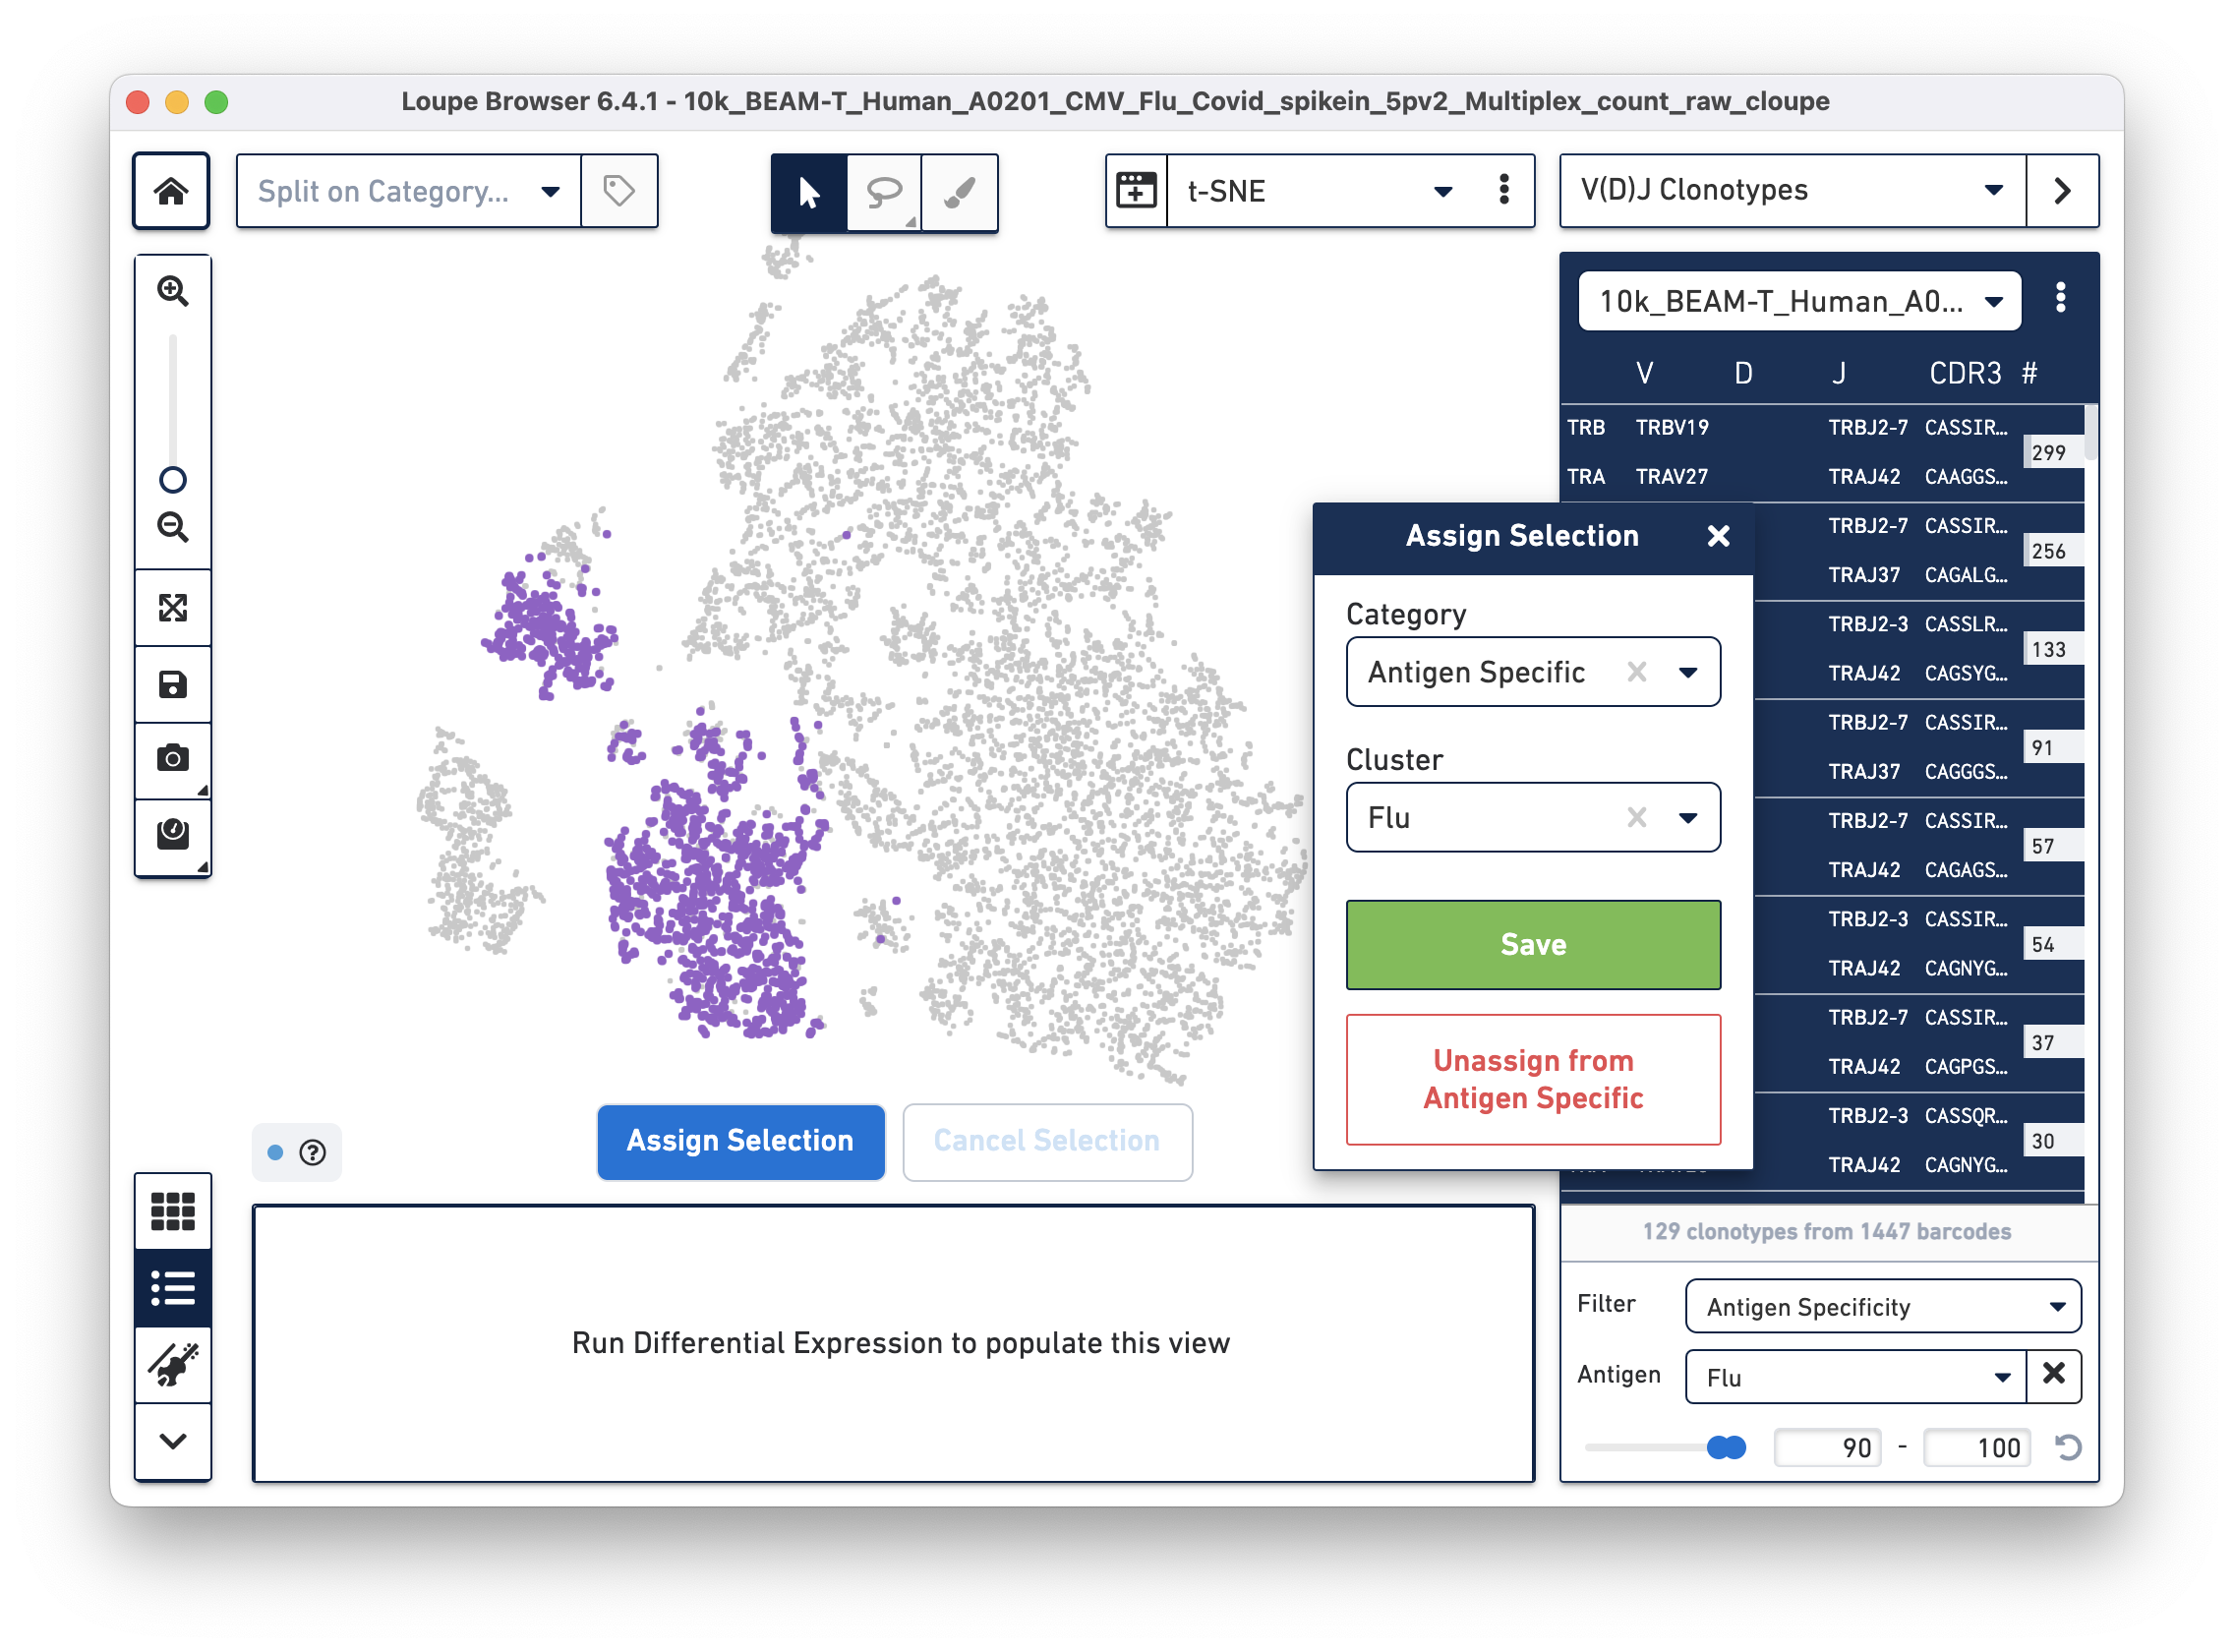
Next, we will set filters to find T cells with a high antigen specificity score to the SARS-CoV-2 antigen. Click on the Filter dropdown menu at the bottom of the clonotypes list and select Antigen Specificity. Set the Antigen tab to SARS_Cov2 and change the minimum on the range to 90, as shown below:
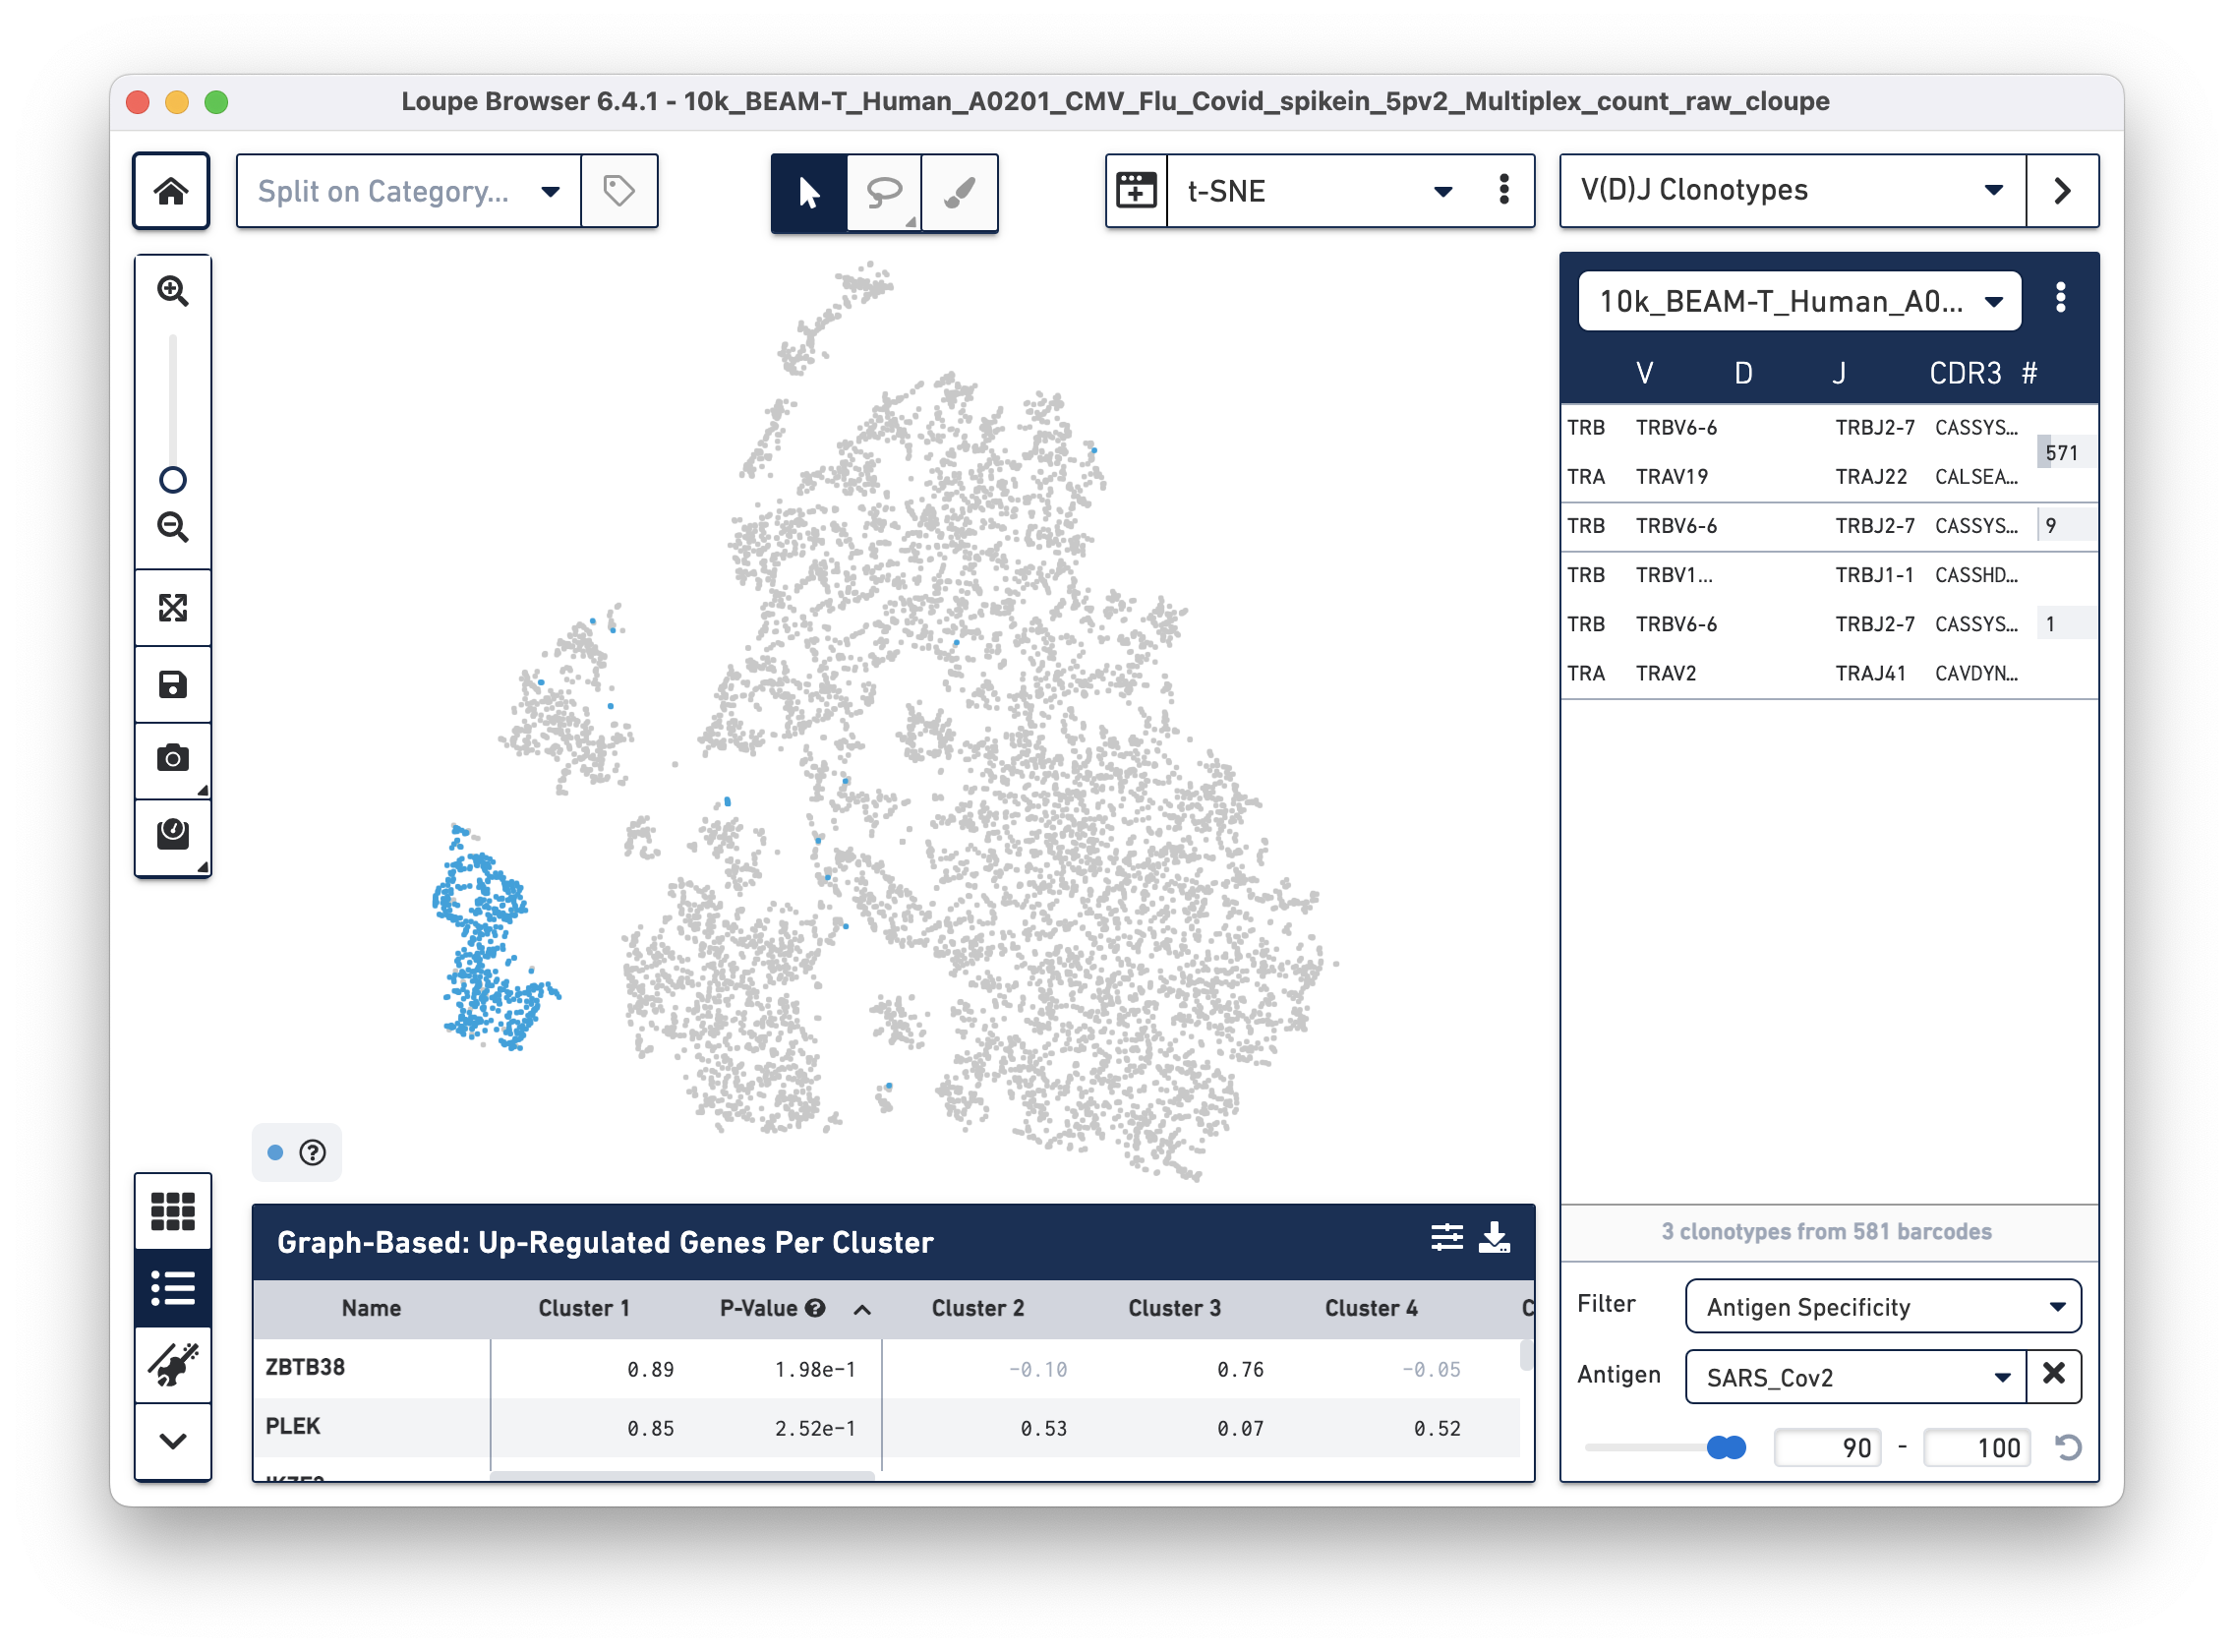
| In this tutorial, we set the minimum antigen specificity score threshold at 90 to filter and group antigen reactive cells. This threshold should not be considered a recommendation and must be adjusted based on experiment-specific factors, such as sample type, antigens used, experimental design, and the underlying scientific question. |
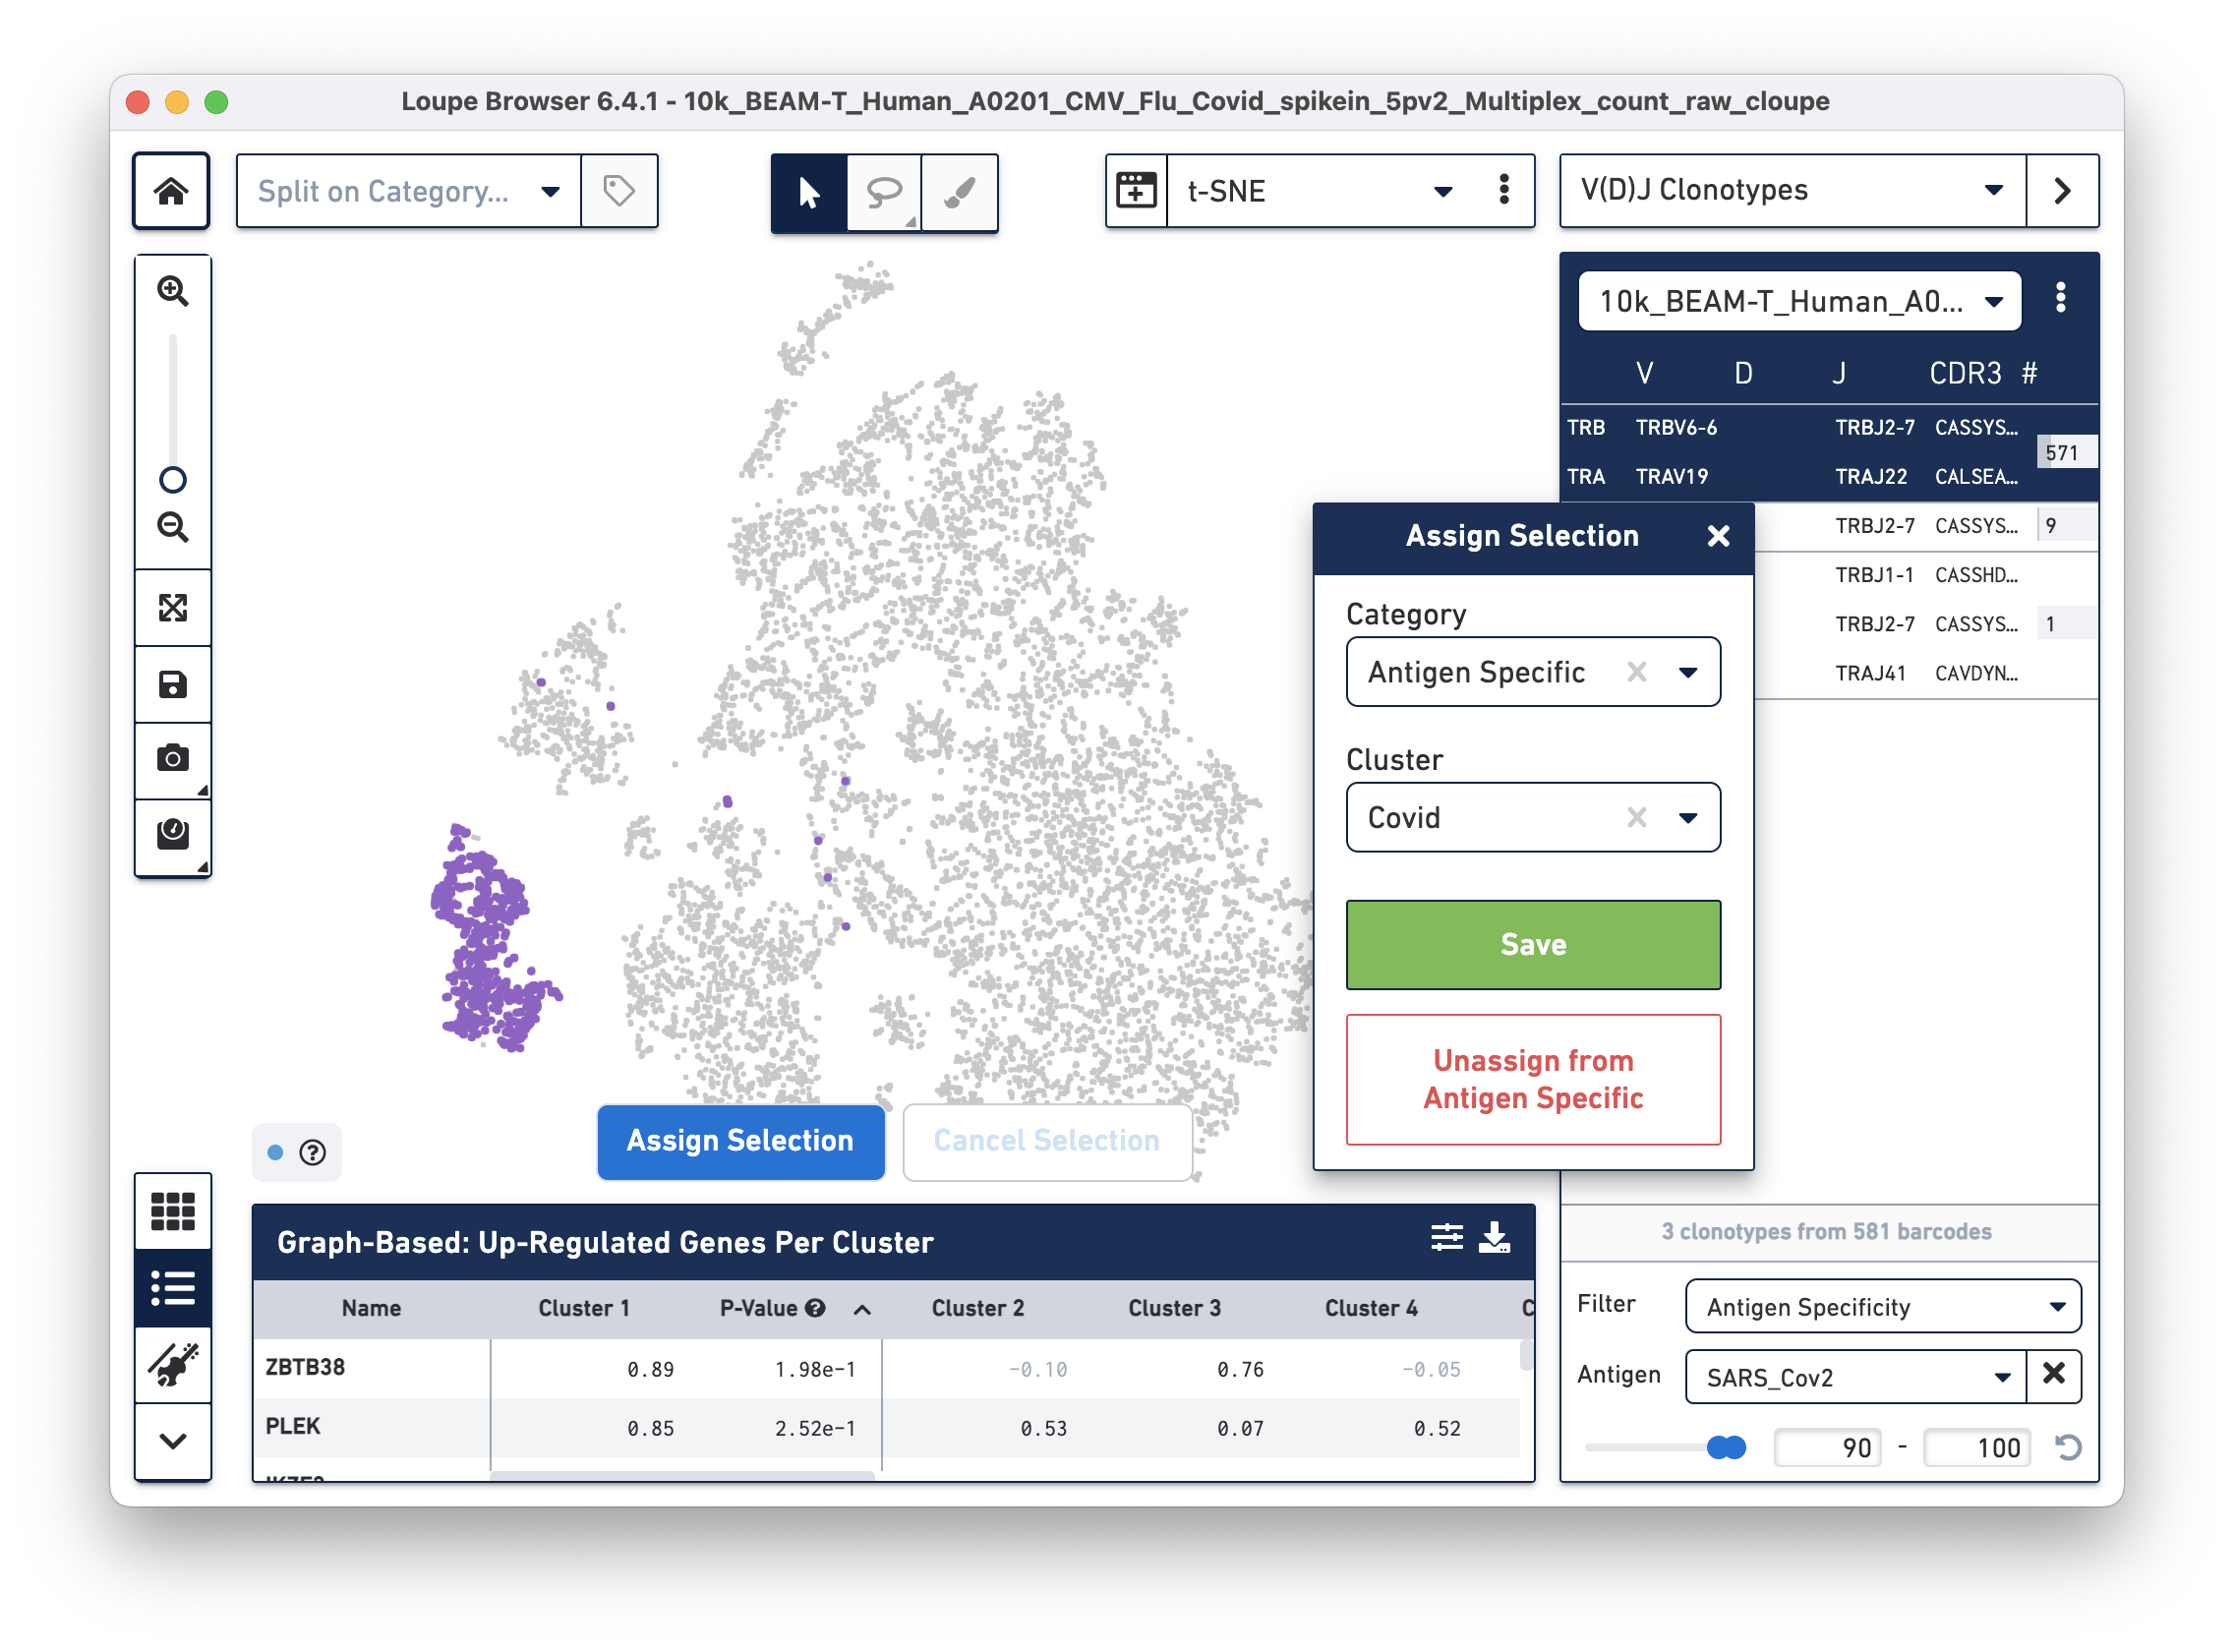
Assign these cells to their own category by clicking on the Assign Selection button. We will call the category "Antigen Specific" and the Cluster "Covid", as shown:
Repeat the process to identify and assign cells that are reactive to the Flu antigen, as shown:
After the two clusters are created, you can view them side-by-side by selecting the "Antigen Specific" category:
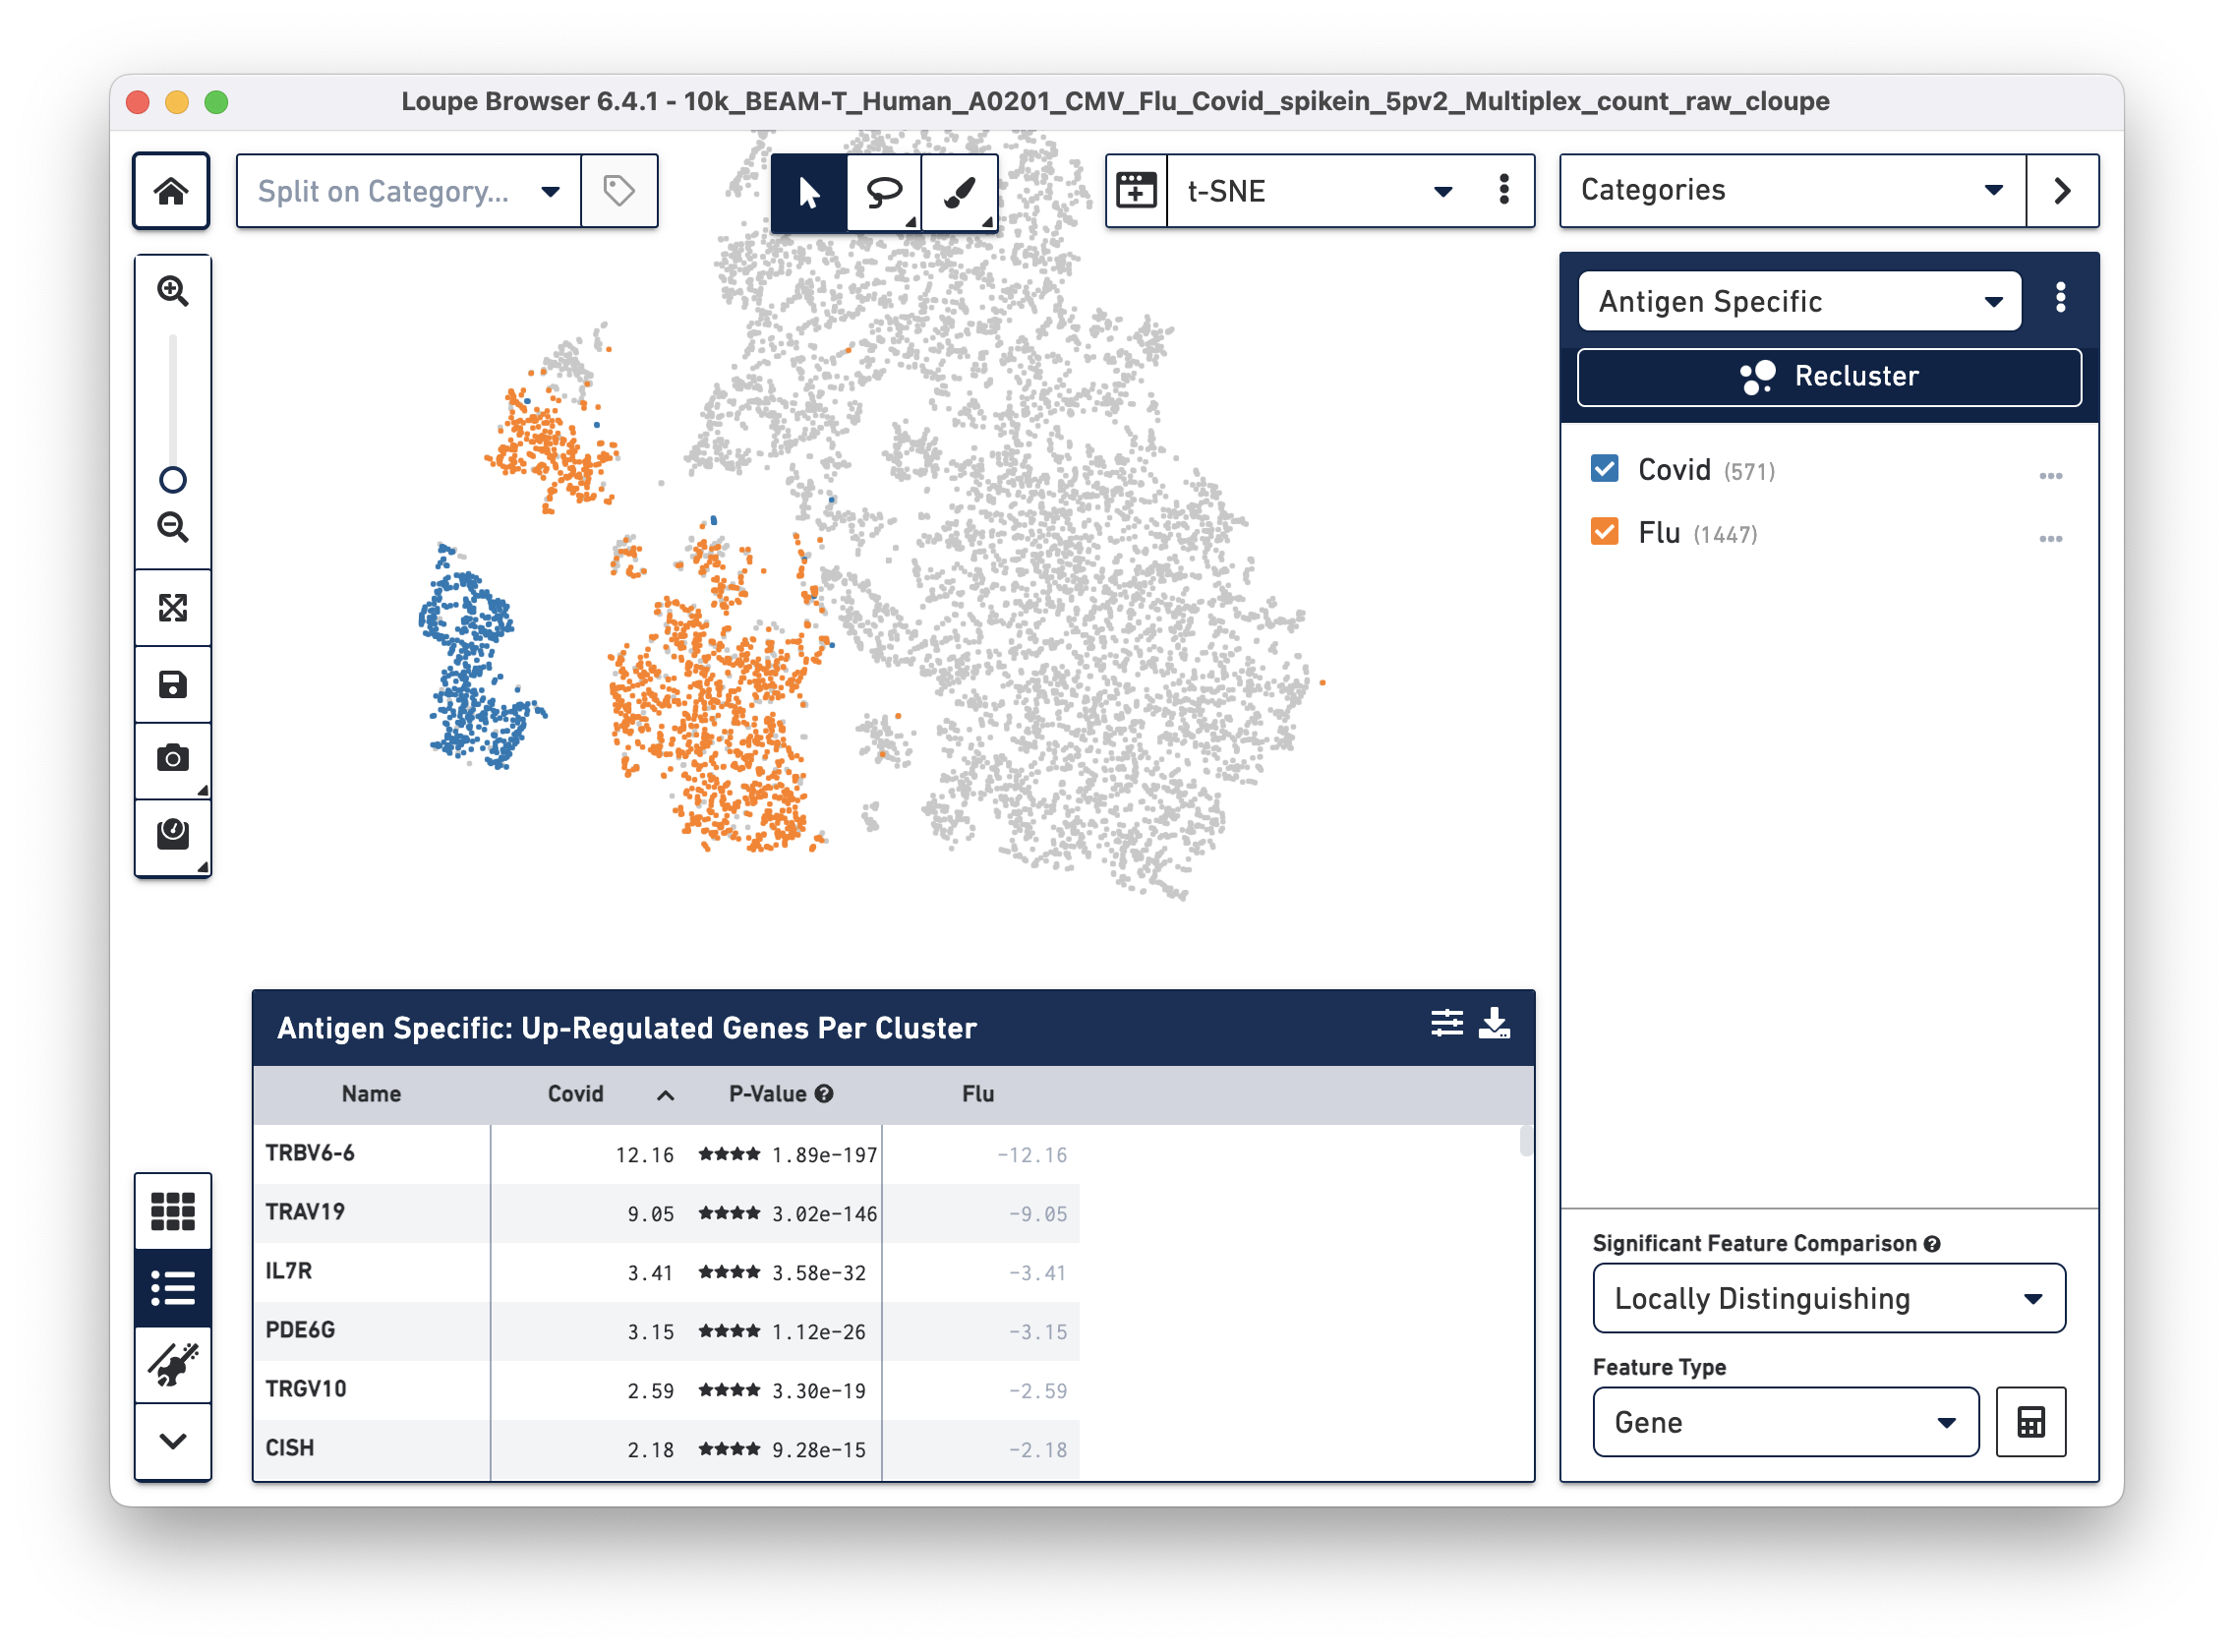
Finally, we will perform a differential gene expression analysis to identify genes that distinguish Flu reactive cells from Covid reactive cells.
Click on the Significant Feature Comparison drop-down menu and select Locally Distinguishing. This selection helps identify genes that are significantly different only between the two checked groups in the selected category, as opposed to between the rest of the cells in the dataset. Leave the Feature Type as "Gene" (default), then click the calculate button next to this dropdown menu. After a few seconds, the Feature Table is populated:
Interleukin 7 receptor (IL7R), the third most highly upregulated gene in COVID (compared to Flu) reactive T cells is of particular interest to us. Recent studies show that patients with milder COVID cases have higher levels of IL-7Ra compared to patients with severe COVID symptoms. Additionally, survivors of severe COVID illness have elevated expression of IL-7Ra compared to non-survivors (Fernandes MB & Barata JT, 2022; Bekele Y, Sui Y & Berzofsky JA, 2021). Therefore, differential gene expression analysis on antigen reactive groups can help identify genes that are both interesting and biologically relevant.
In this tutorial, we overlaid V(D)J and BEAM (Antigen Capture) data onto 5' Gene Expression data in Loupe Browser, by importing the corresponding .vloupe file. This allowed us to visualize multimodal data on a single tSNE plot, filter and group antigen reactive cells, and carry out differential gene expression analysis.
Next, we will use Loupe V(D)J Browser to further interrogate T cell clonotypes, and compare distributions of clonotypes between different gene expression clusters.
Fernandes MB & Barata JT. IL-7 and IL-7R in health and disease: An update through COVID times. Advances in Biological Regulation, 100940, 2022.
Bekele Y, Sui Y & Berzofsky JA. IL-7 in SARS-CoV-2 infection and as a potential vaccine adjuvant. Frontiers in Immunology 12: 737406, 2021