Cell Ranger7.1, printed on 03/28/2025
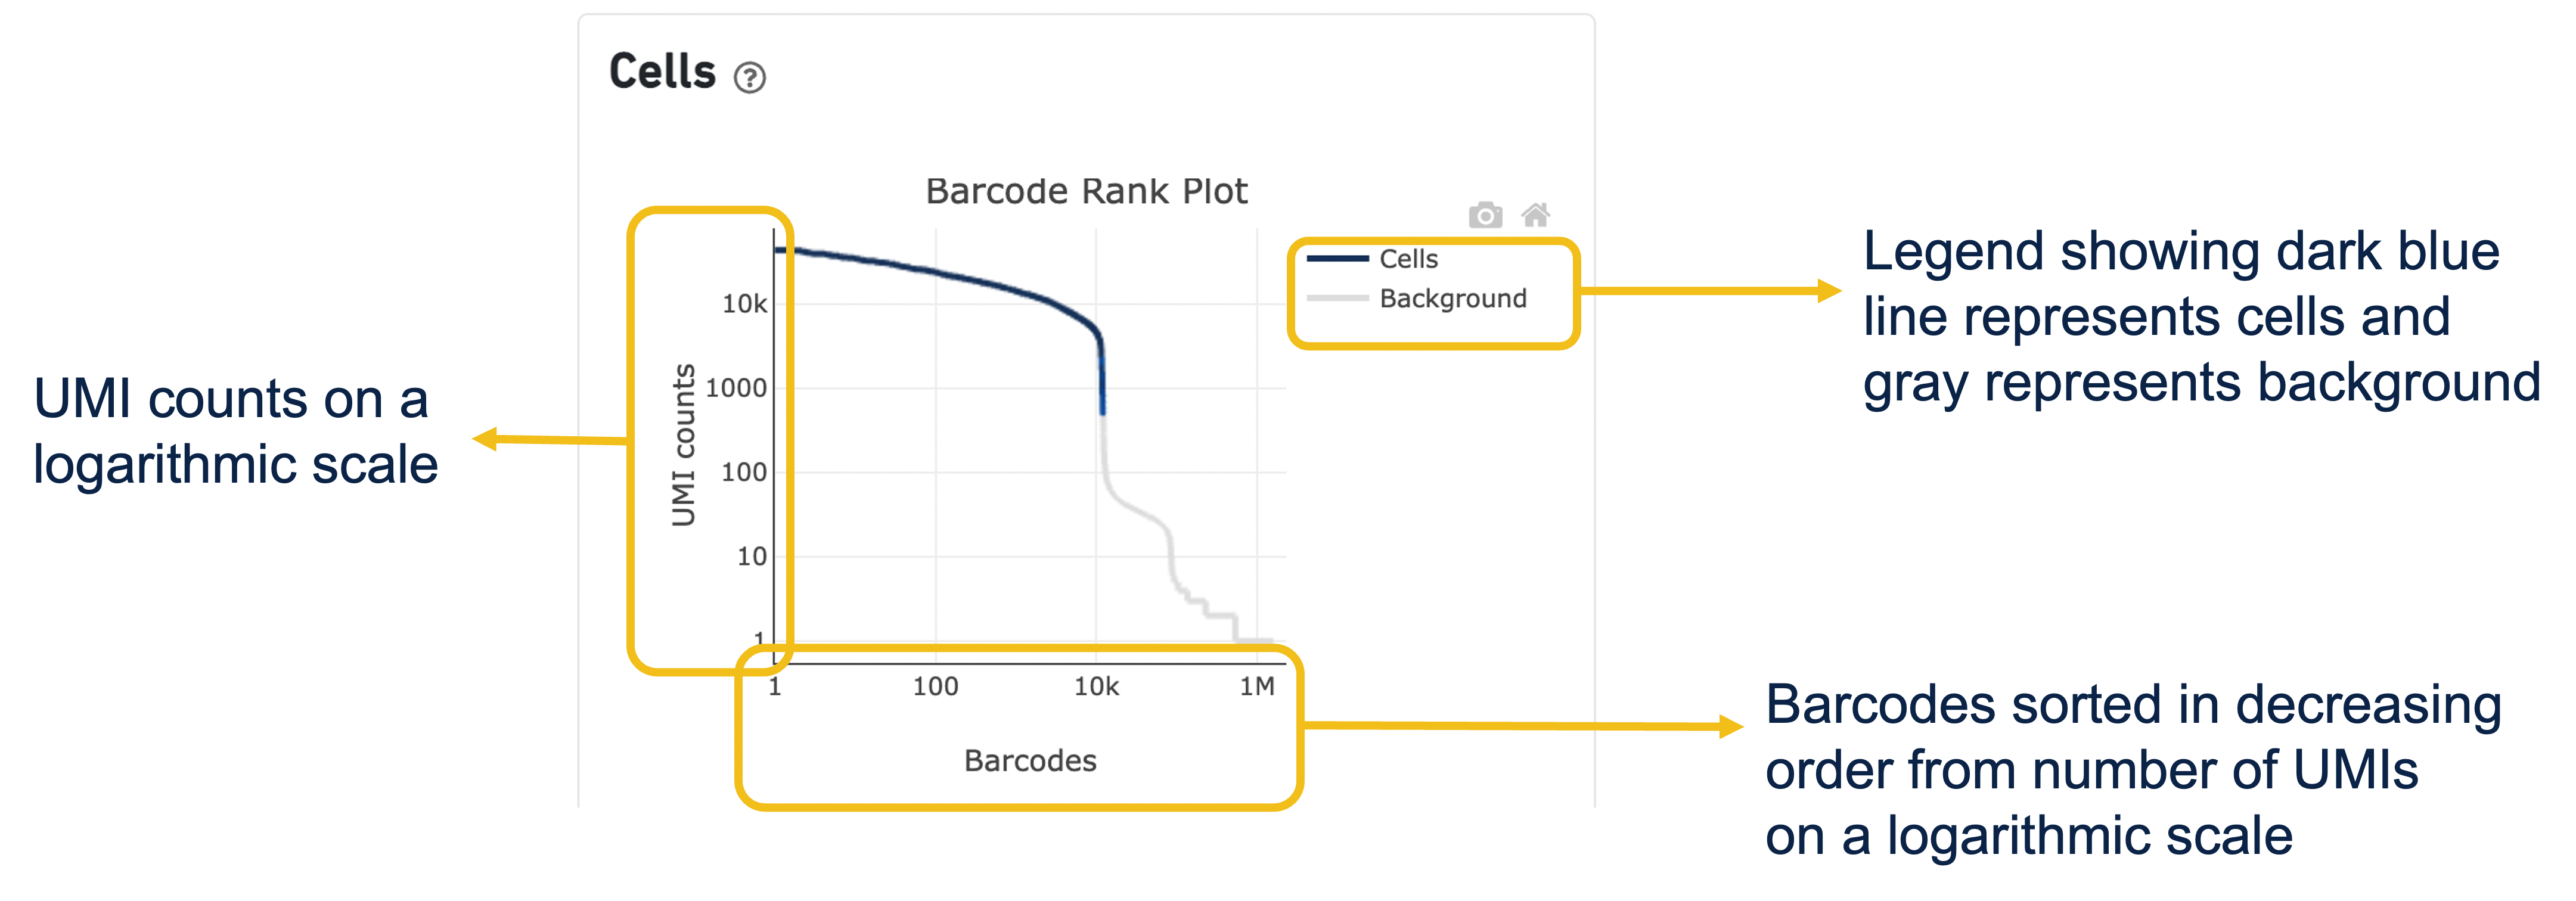
The Barcode Rank Plot is an interactive plot that shows all barcodes detected in an experiment, ranked from highest to lowest UMI count. It is useful for understanding Cell Ranger’s cell calling algorithm and its performance on your data, and for providing insights into your sample quality.
The Barcode Rank Plot can be found under the Cells dashboard of the web summary file (an output file of cellranger count and cellranger multi).
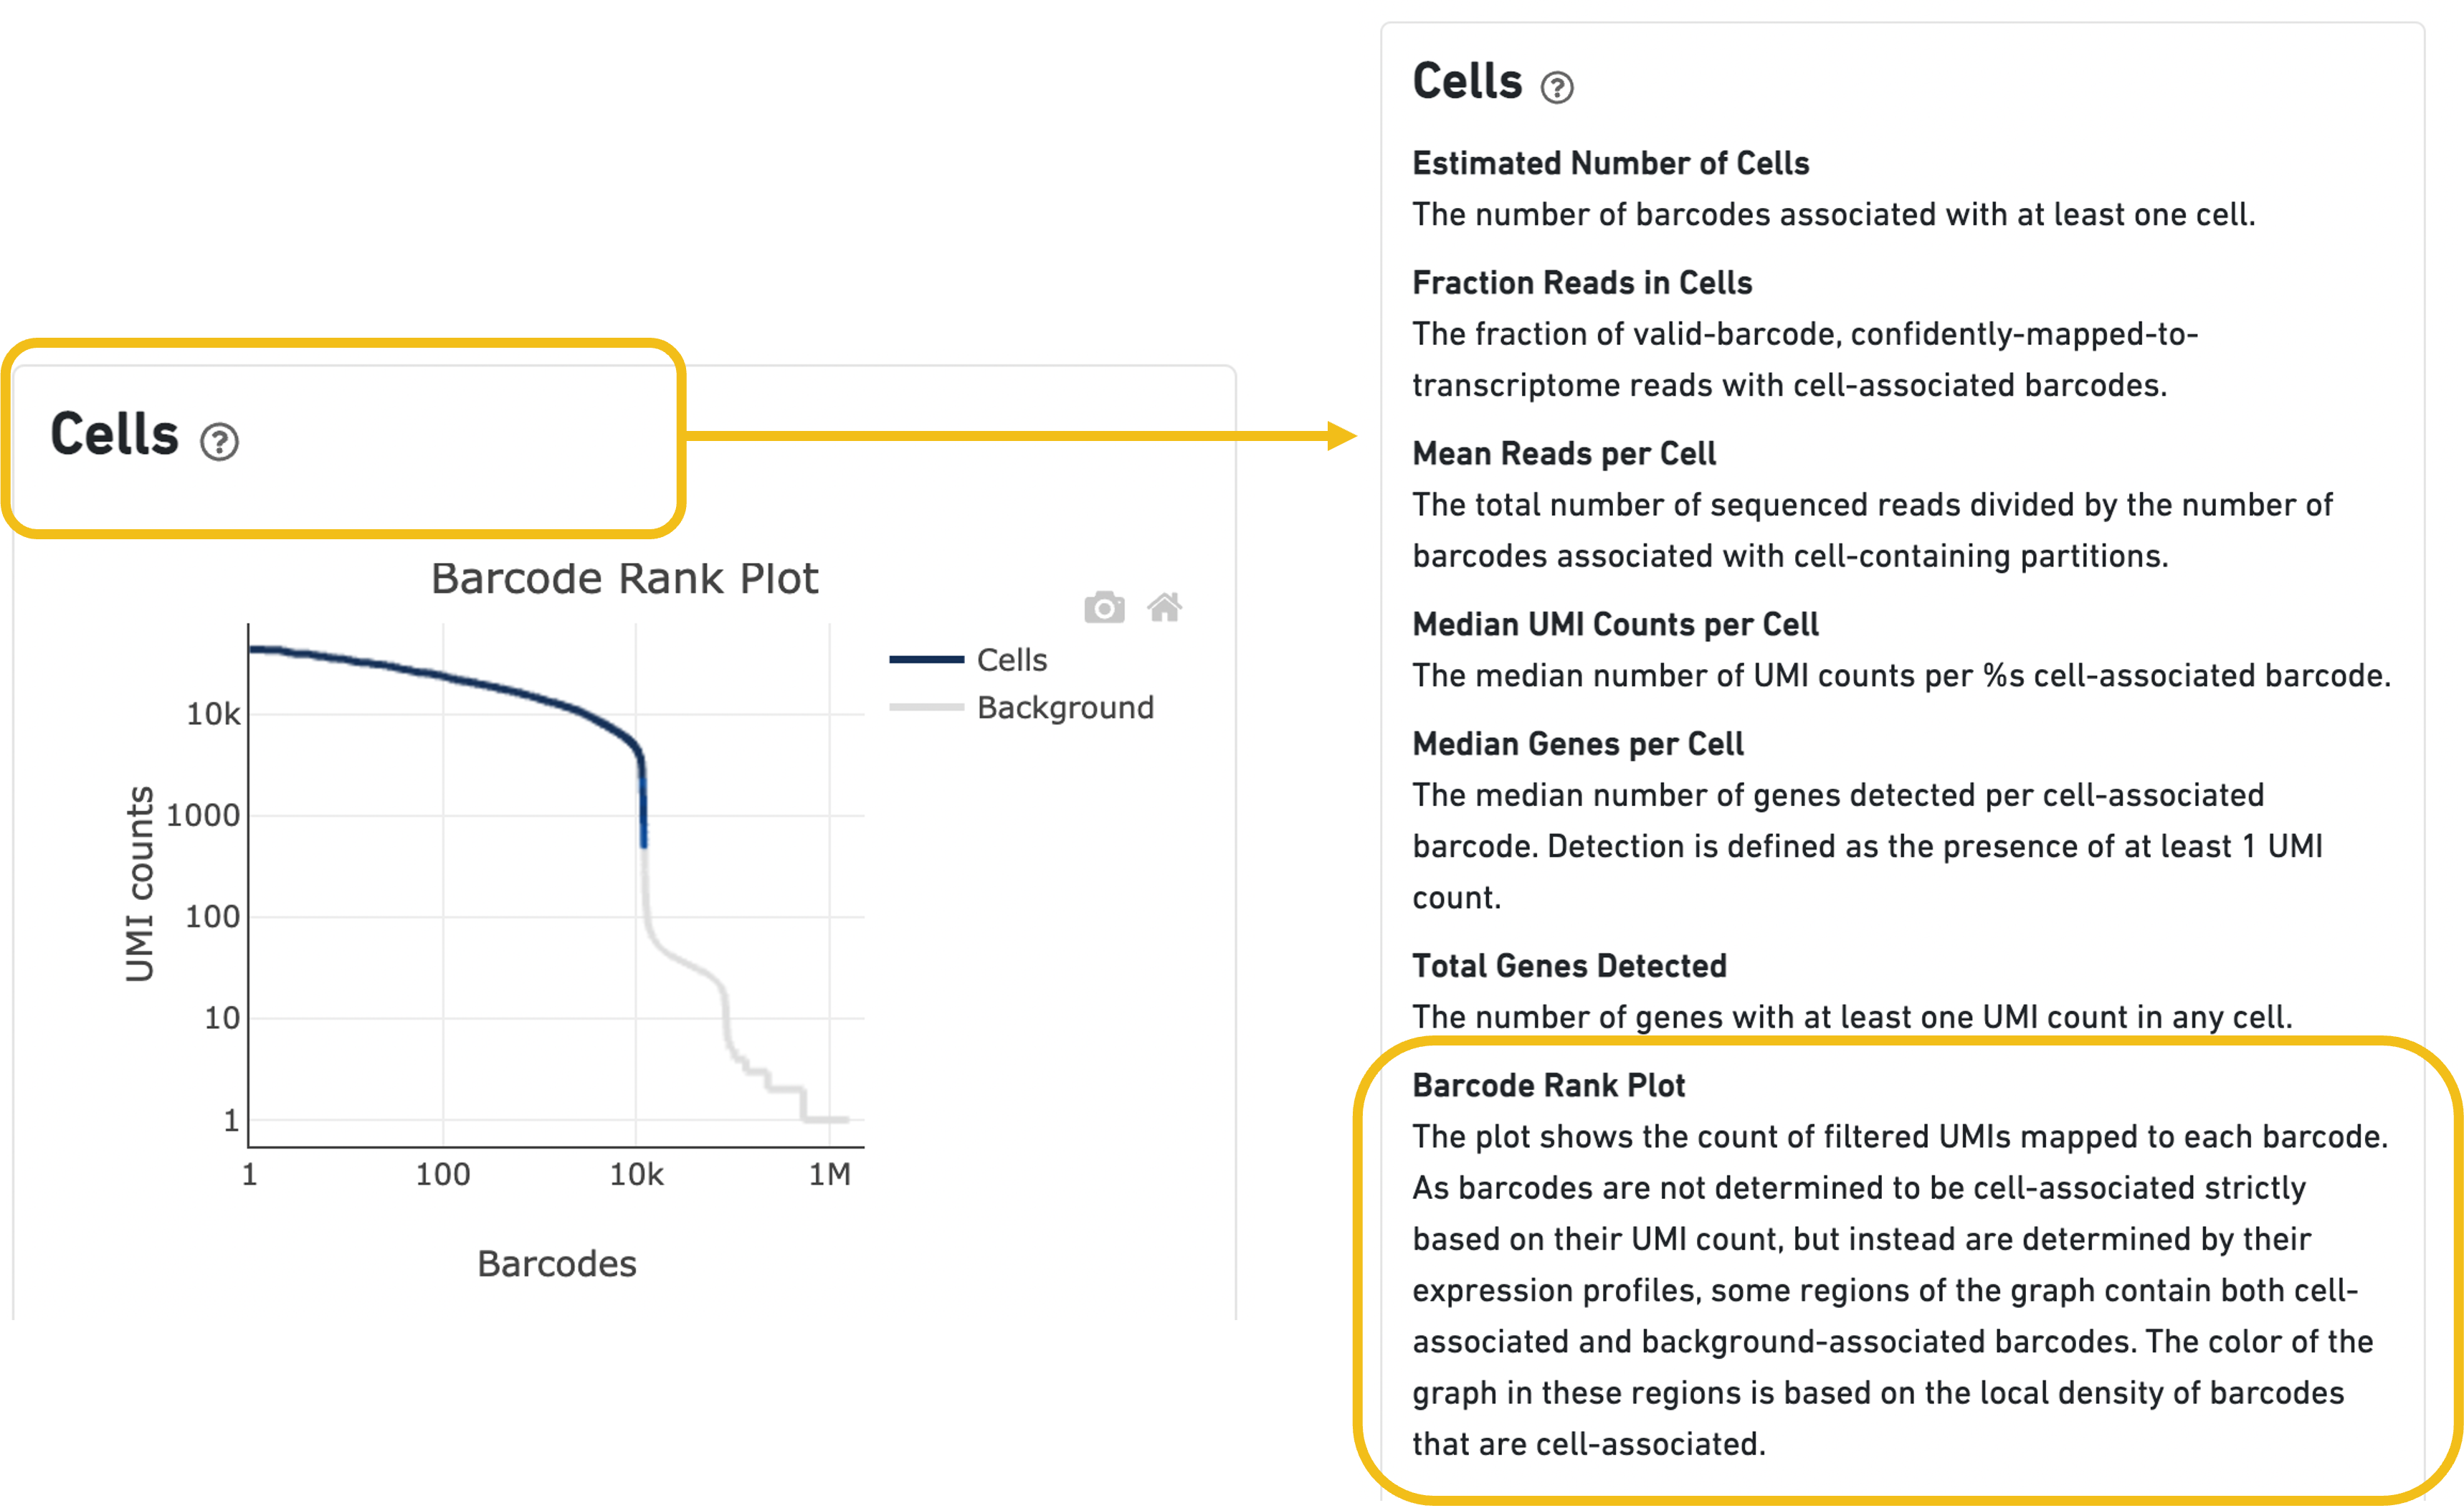
Expand the question mark tab in the Cells section for details about the different metrics within that section of the web summary, along with a high-level summary of the Barcode Rank Plot.
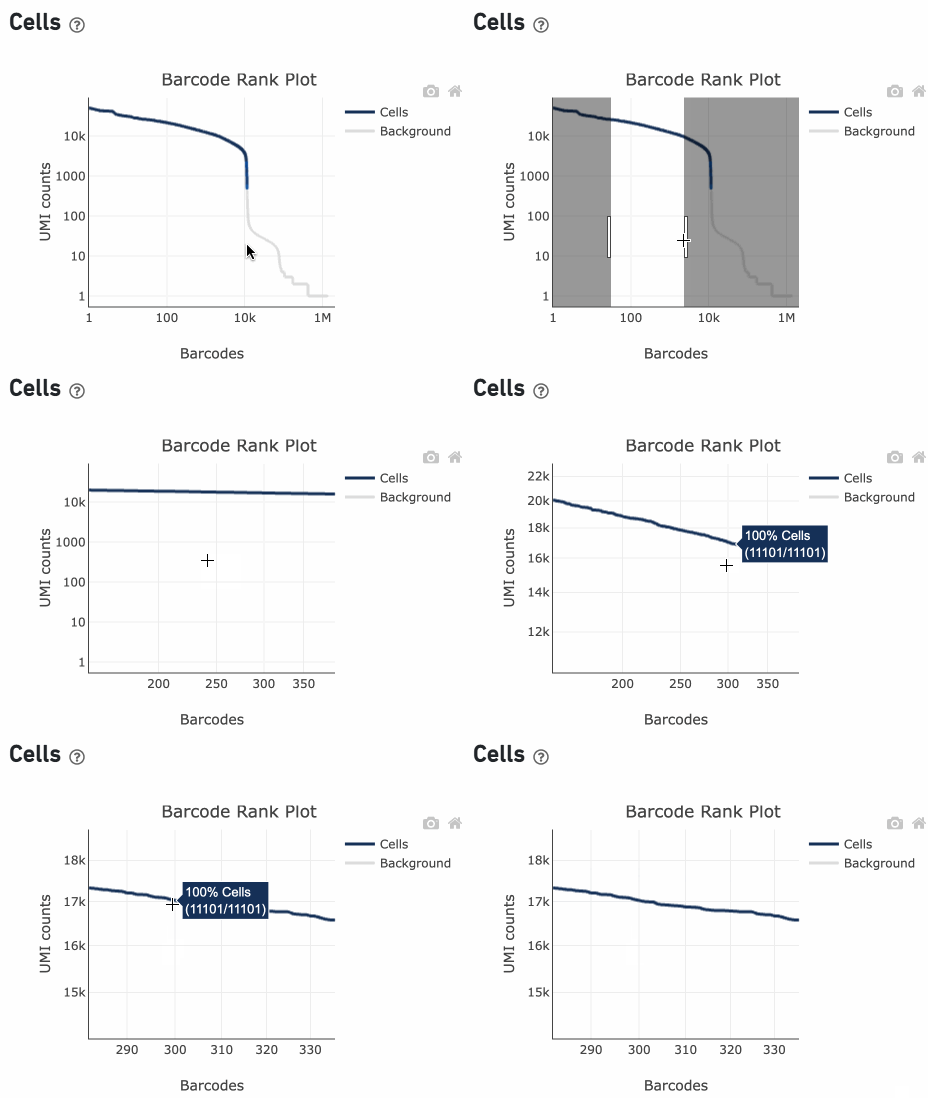
You can zoom in and out along the X and Y axes and hover your mouse over specific data points.
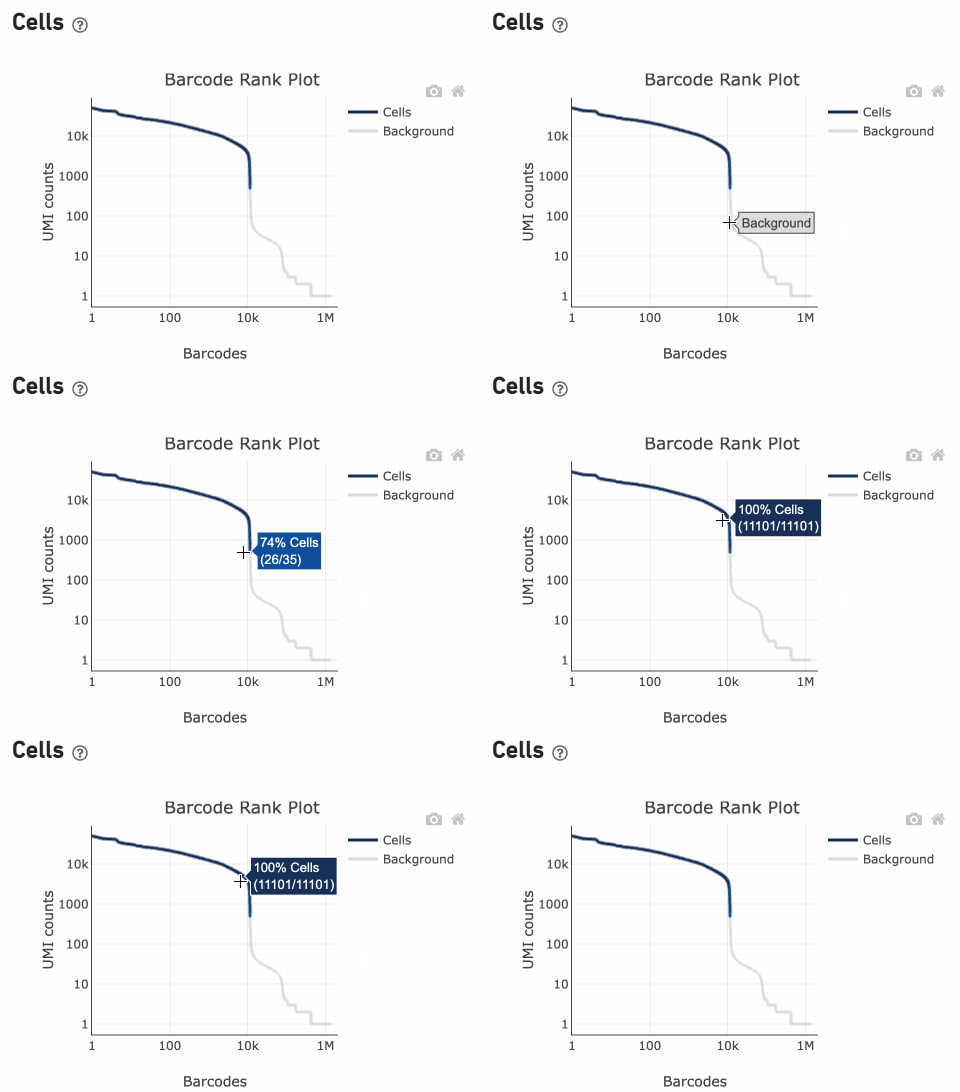
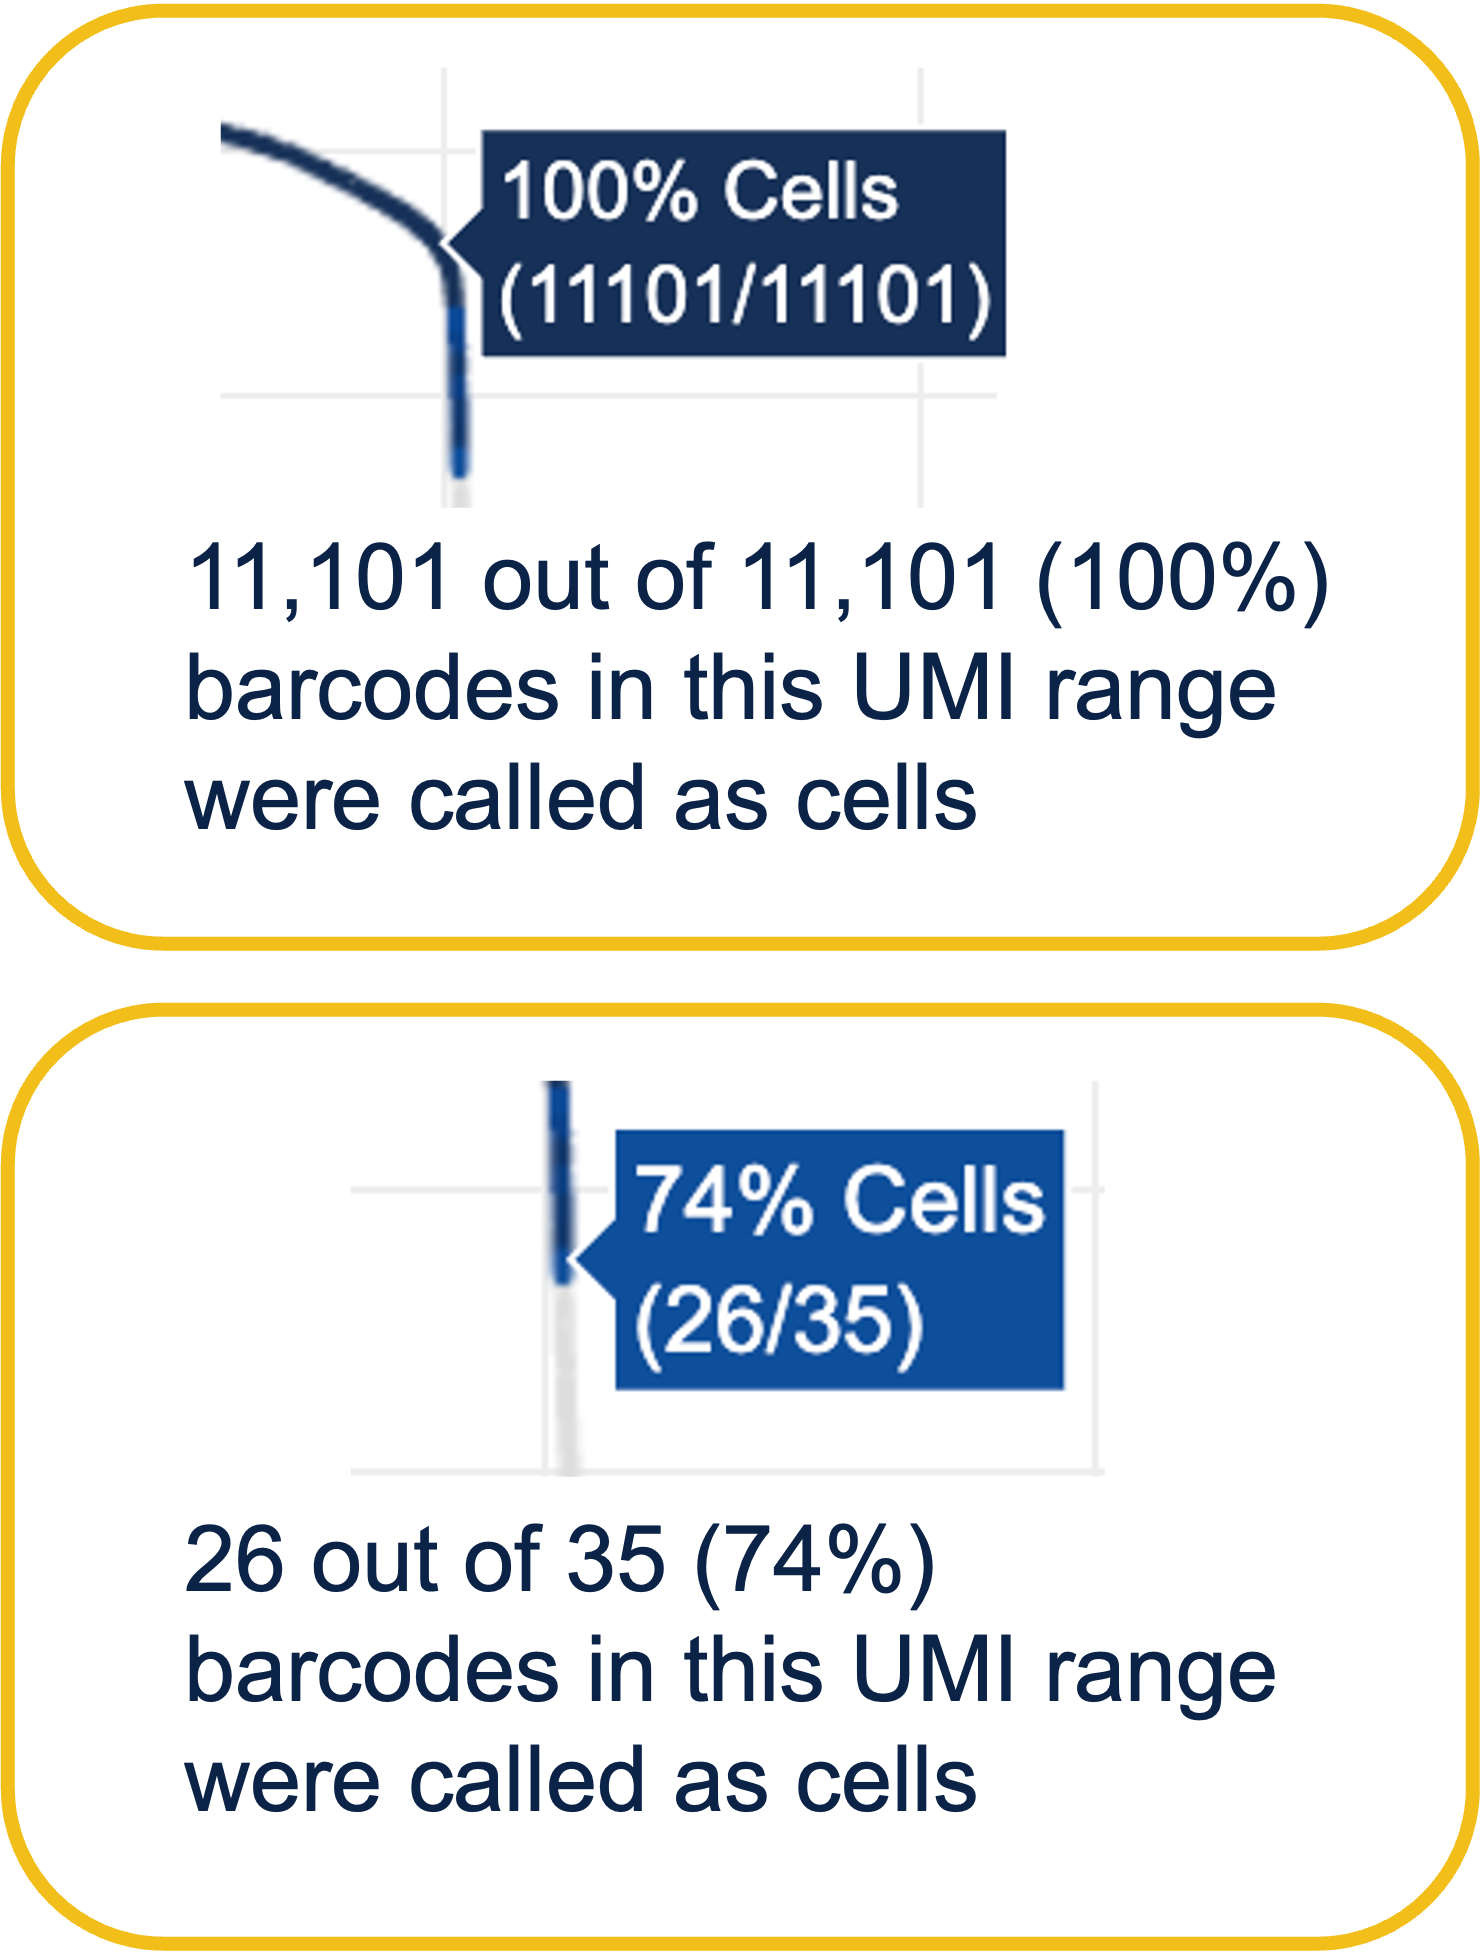
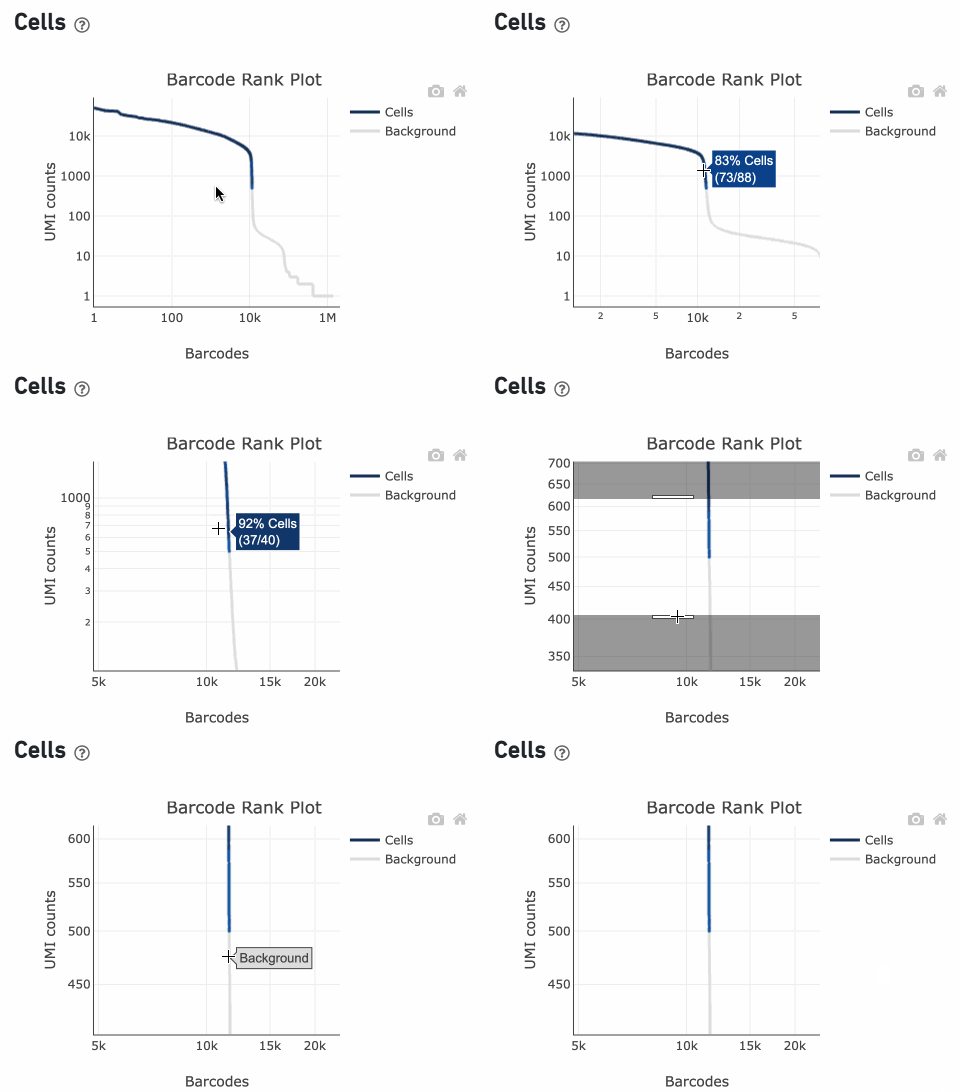
Percentage values appear as you hover over different regions of the Barcode Rank Plot. These numbers show the proportion of barcodes that were assigned as cells by the cell calling algorithm for a given UMI range. The blue color gradient is proportional to the fraction of cells in a given subset of barcodes; darker blue indicates a higher proportion of cell barcodes versus background. An example of how to interpret two different percentage values that pop-up while hovering over data points on a Barcode Rank Plot is shown below.
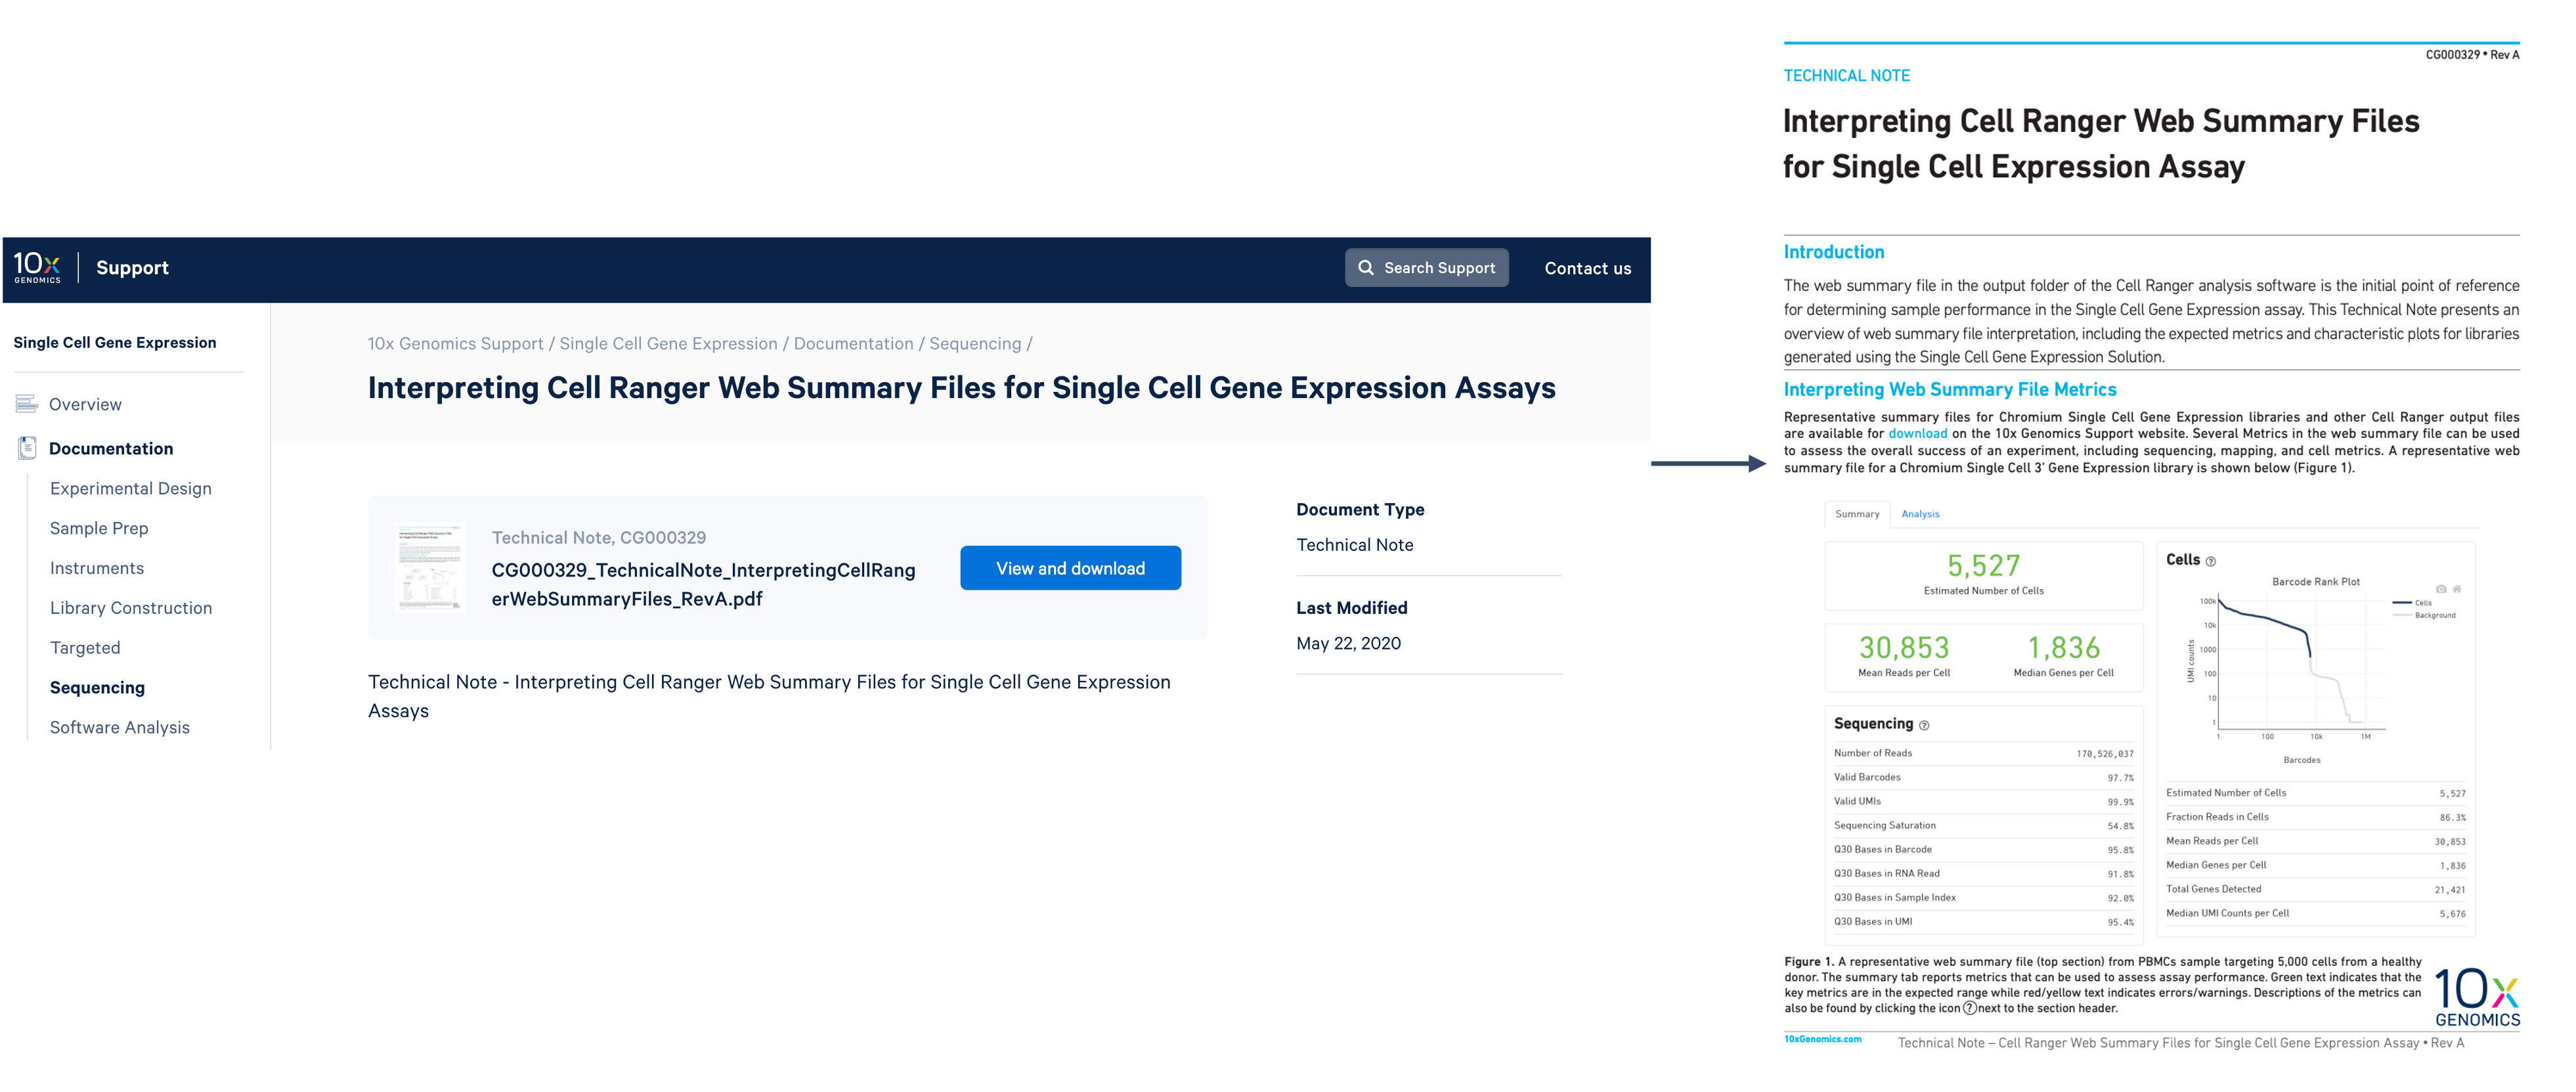
Supporting documentation for interpreting the Barcode Rank Plot and web summary metrics can be found on the 10x support site and our technical note: Interpreting Cell Range Web Summary Files for Single Cell Gene Expression Assays.
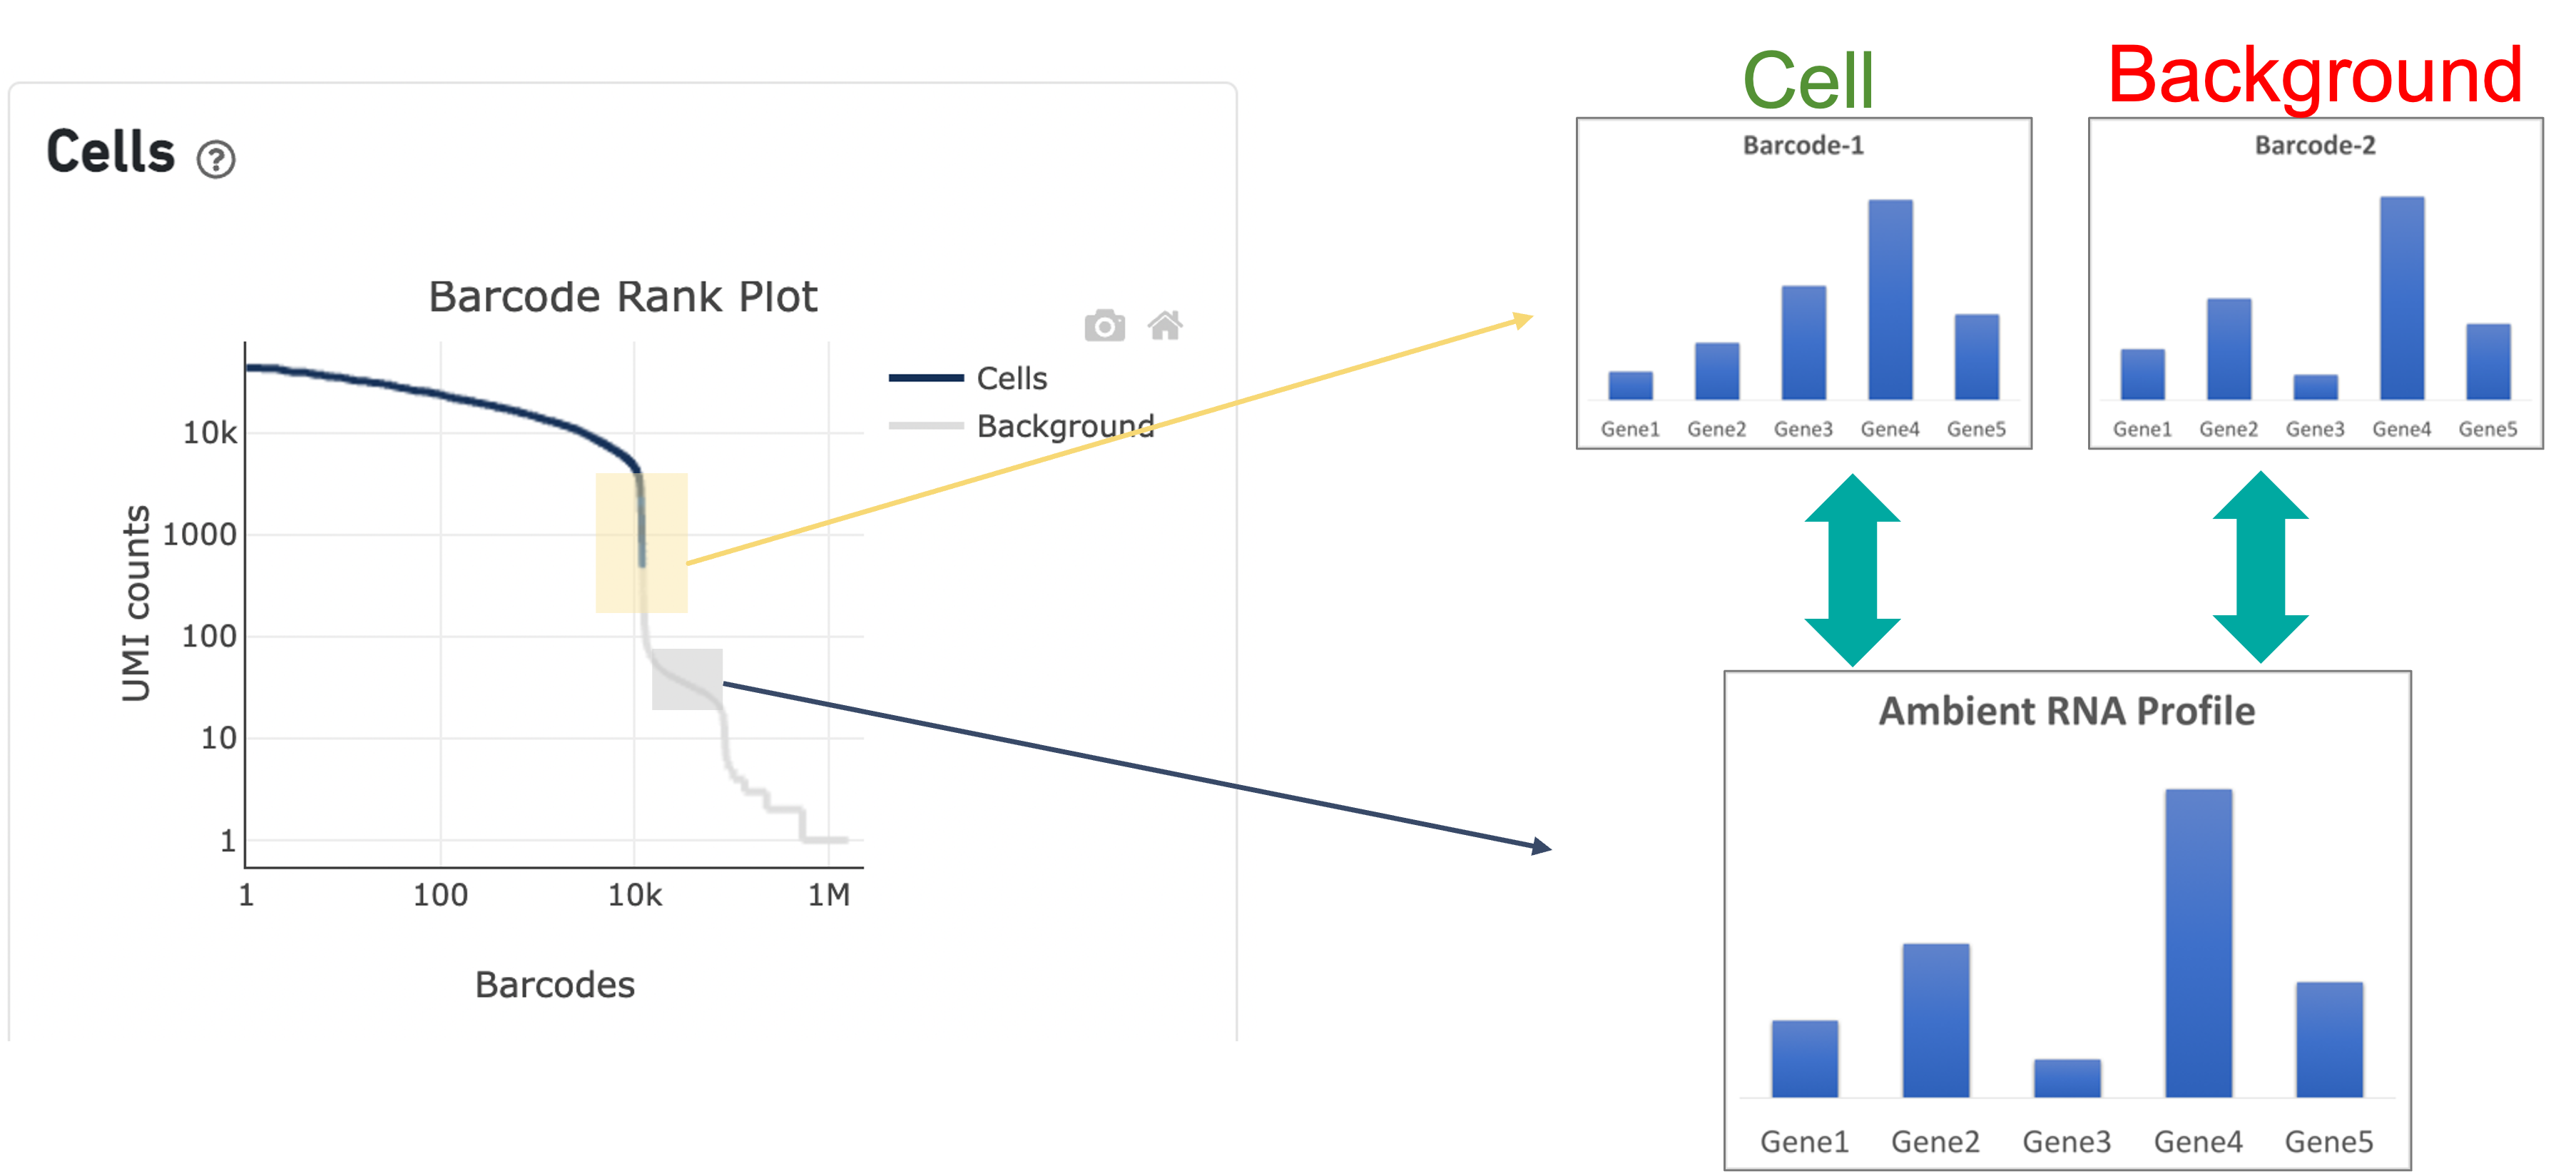
The cell calling algorithm is a multi-step process that determines which barcodes/GEMs are likely to contain an intact cell and uses those for downstream analysis. The cell calling algorithm can be broadly divided into two major steps:
In this step, barcodes are called cells if the total UMI counts for a barcode exceed m/10, where m is the 99th percentile of Nexpect cell barcodes based on total UMI counts. An example is provided below to illustrate.
Cell Ranger uses an algorithm to calculate the metric --expect-cells. More information about how this metric is calculated in the latest versions of cell ranger can be found on our algorithms page. Starting from Cell Ranger 7.0, --expect-cells can either be auto-estimated using the algorithm or provided by the user with a reasonable estimate of recovered cells.

In this example, if –-expect-cells = 30,000, the 99th percentile barcode is barcode 30. The number of UMIs at barcode 30 is ~26,050. Any barcode with greater than 26,050/10 = 2,605 UMIs is called a cell. These are the 11,101 out of 11,101 (100%) barcodes that are initially called as cells in the Barcode Rank Plot and can be seen as the segment of dark blue (with 100% cells) on the Barcode Rank Plot. Starting from Cell Ranger v7.1.0, the range of barcodes that can be considered for expect-cells auto-estimation is 2-45k.
In the second step of the cell calling algorithm, Cell Ranger selects a set of low UMI barcodes (for the standard 3’ Single Cell Gene Expression* assay, barcodes within rank 45k-90k) to represent background GEMs and uses these as a reference to identify all of the remaining barcodes as either background barcodes or cell barcodes. First, Cell Ranger generates a background gene expression model. The RNA profile of each barcode that was not called a cell in the first step is then compared to the background model. Barcodes whose RNA profile significantly differs from the background model are added to the set of positive cell calls. This second step identifies cells that are distinguishable from the profile of empty GEMs, despite having much lower RNA content than the largest cells in the experiment.
Since barcodes can be determined to be cell-associated based on their UMI count or by their RNA profiles, some regions of the graph can contain both cell and background barcodes. The color of the graph represents the local density of barcodes that are cell-associated where darker blue indicates a higher proportion of cell barcodes and lighter shades indicate a lower proportion of cell barcodes
Lastly, Cell Ranger removes barcodes with a total UMI count <500 or
TotalUMICount<median(InitialCellUmis)∗0.01
InitialCellUmis is the distribution of UMI counts for the barcodes initially called as cells in Step 1 of the algorithm. As you can see from the Barcode Rank Plot, barcodes with UMI count <500 were called background, and therefore removed from downstream analysis.
Note: Cell Ranger processes Chromium Next GEM Single Cell 3’ and 5' HT kits (referred to as high throughput or HT) similarly to standard libraries except for minor adjustments to certain parameters in the cell calling algorithm. These kits can process 2,000-20,000 cells per channel (3' and 5') or 2,000-60,000 cells per channel with CellPlex (3' only)
The overall shape of the Barcode Rank Plot is a useful indicator of sample quality. A “cliff-and-knee” shape in the Barcode Rank Plot is indicative of a good quality sample.
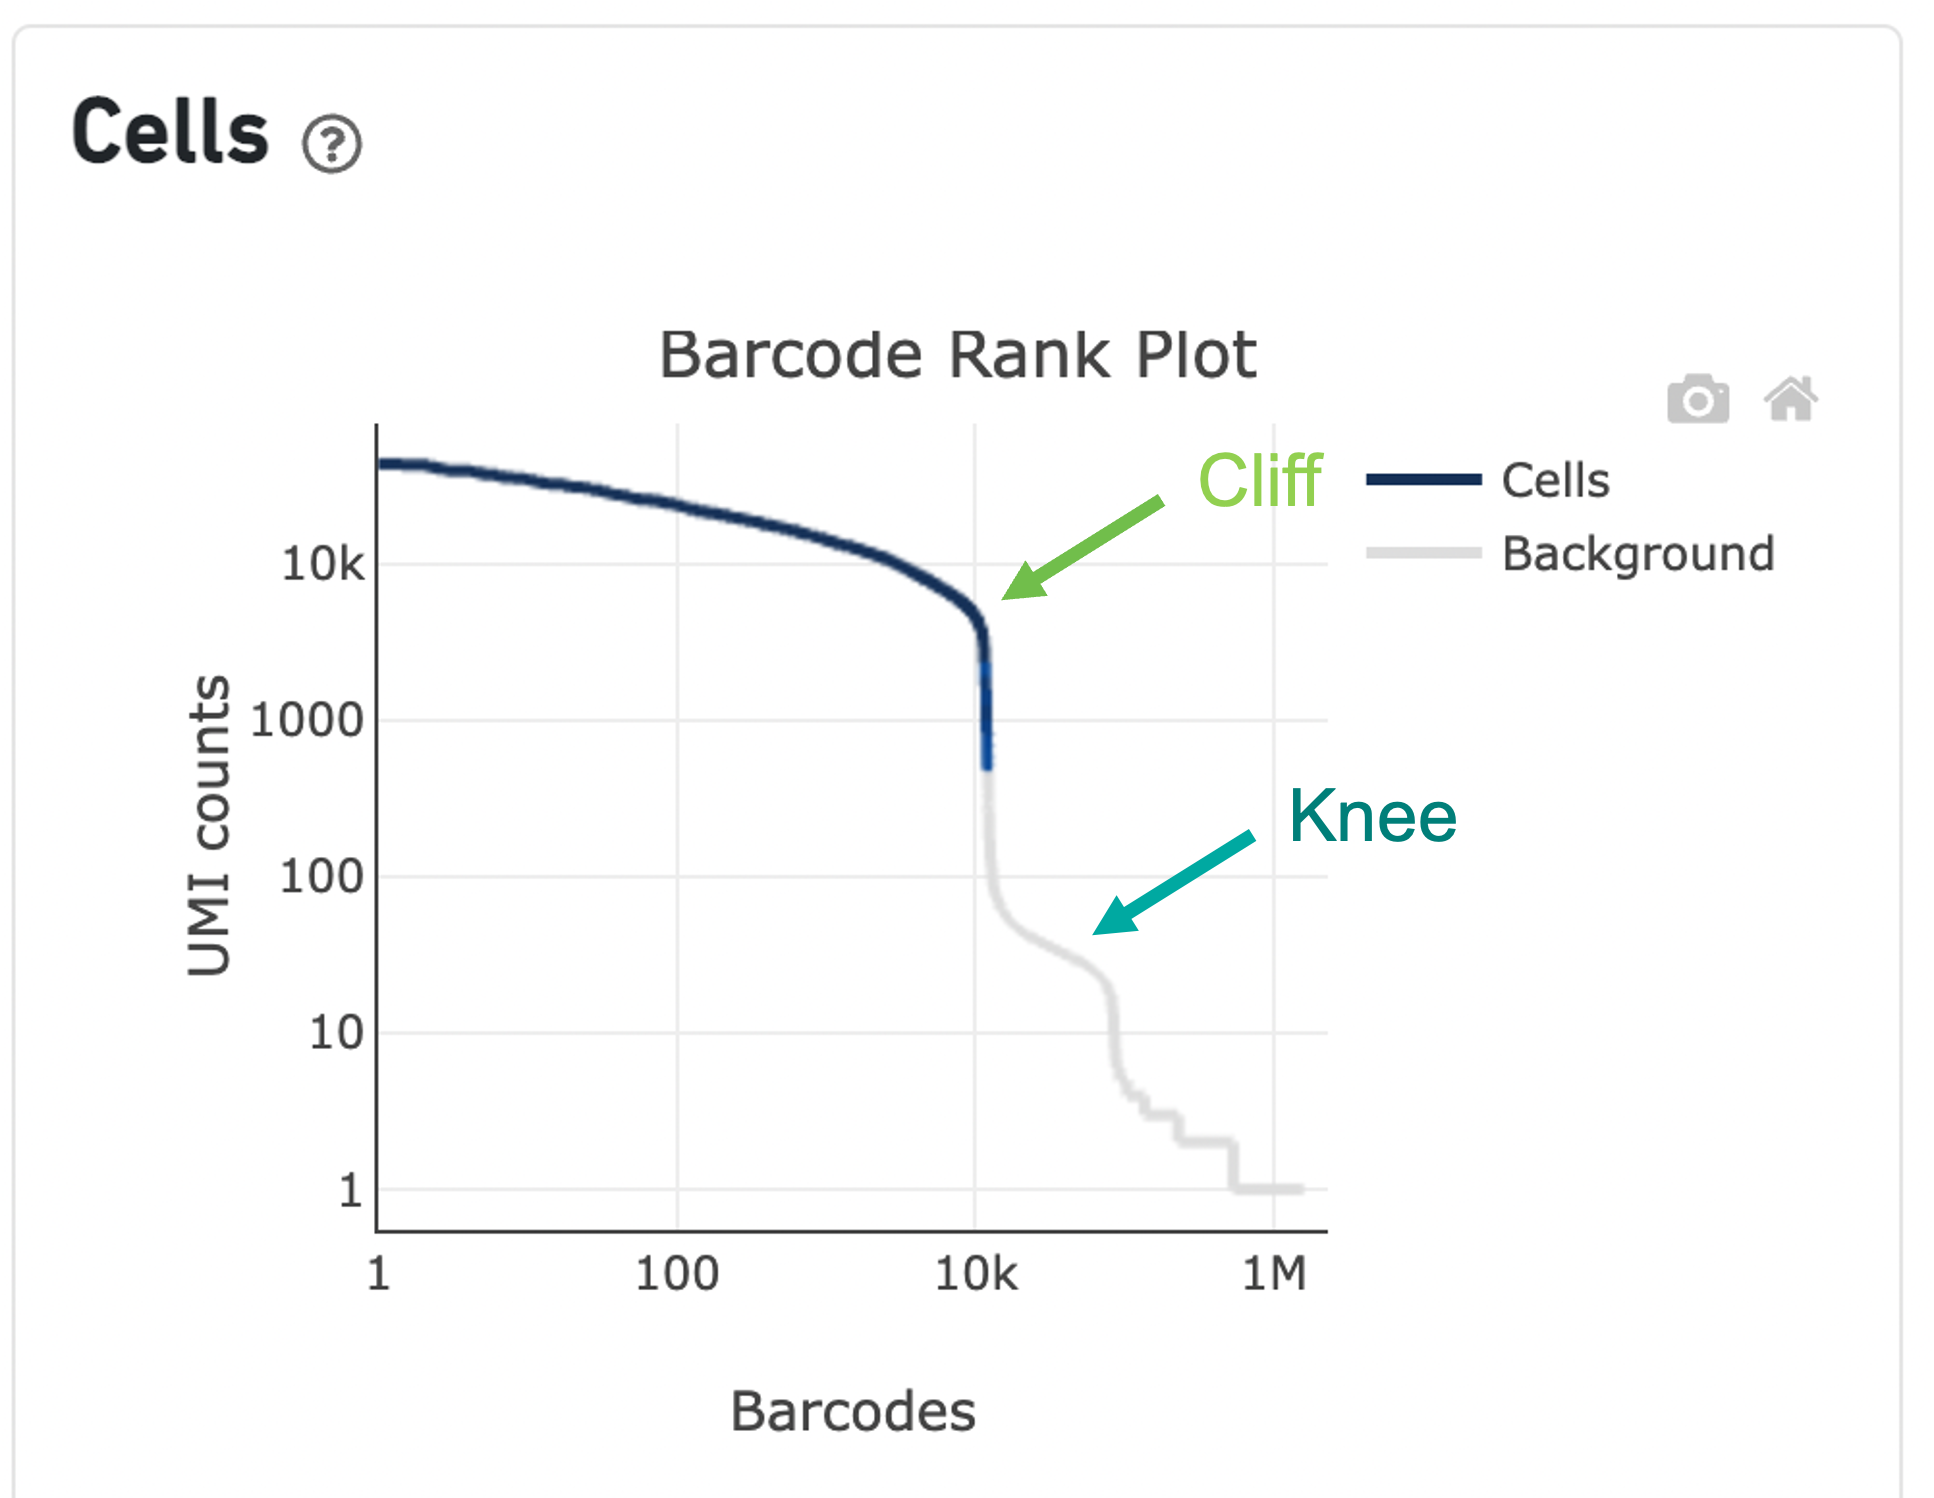
In this case, the steep cliff, followed by the plateaued knee, demonstrates that the cell calling algorithm was able to distinguish between intact cells and background barcodes.
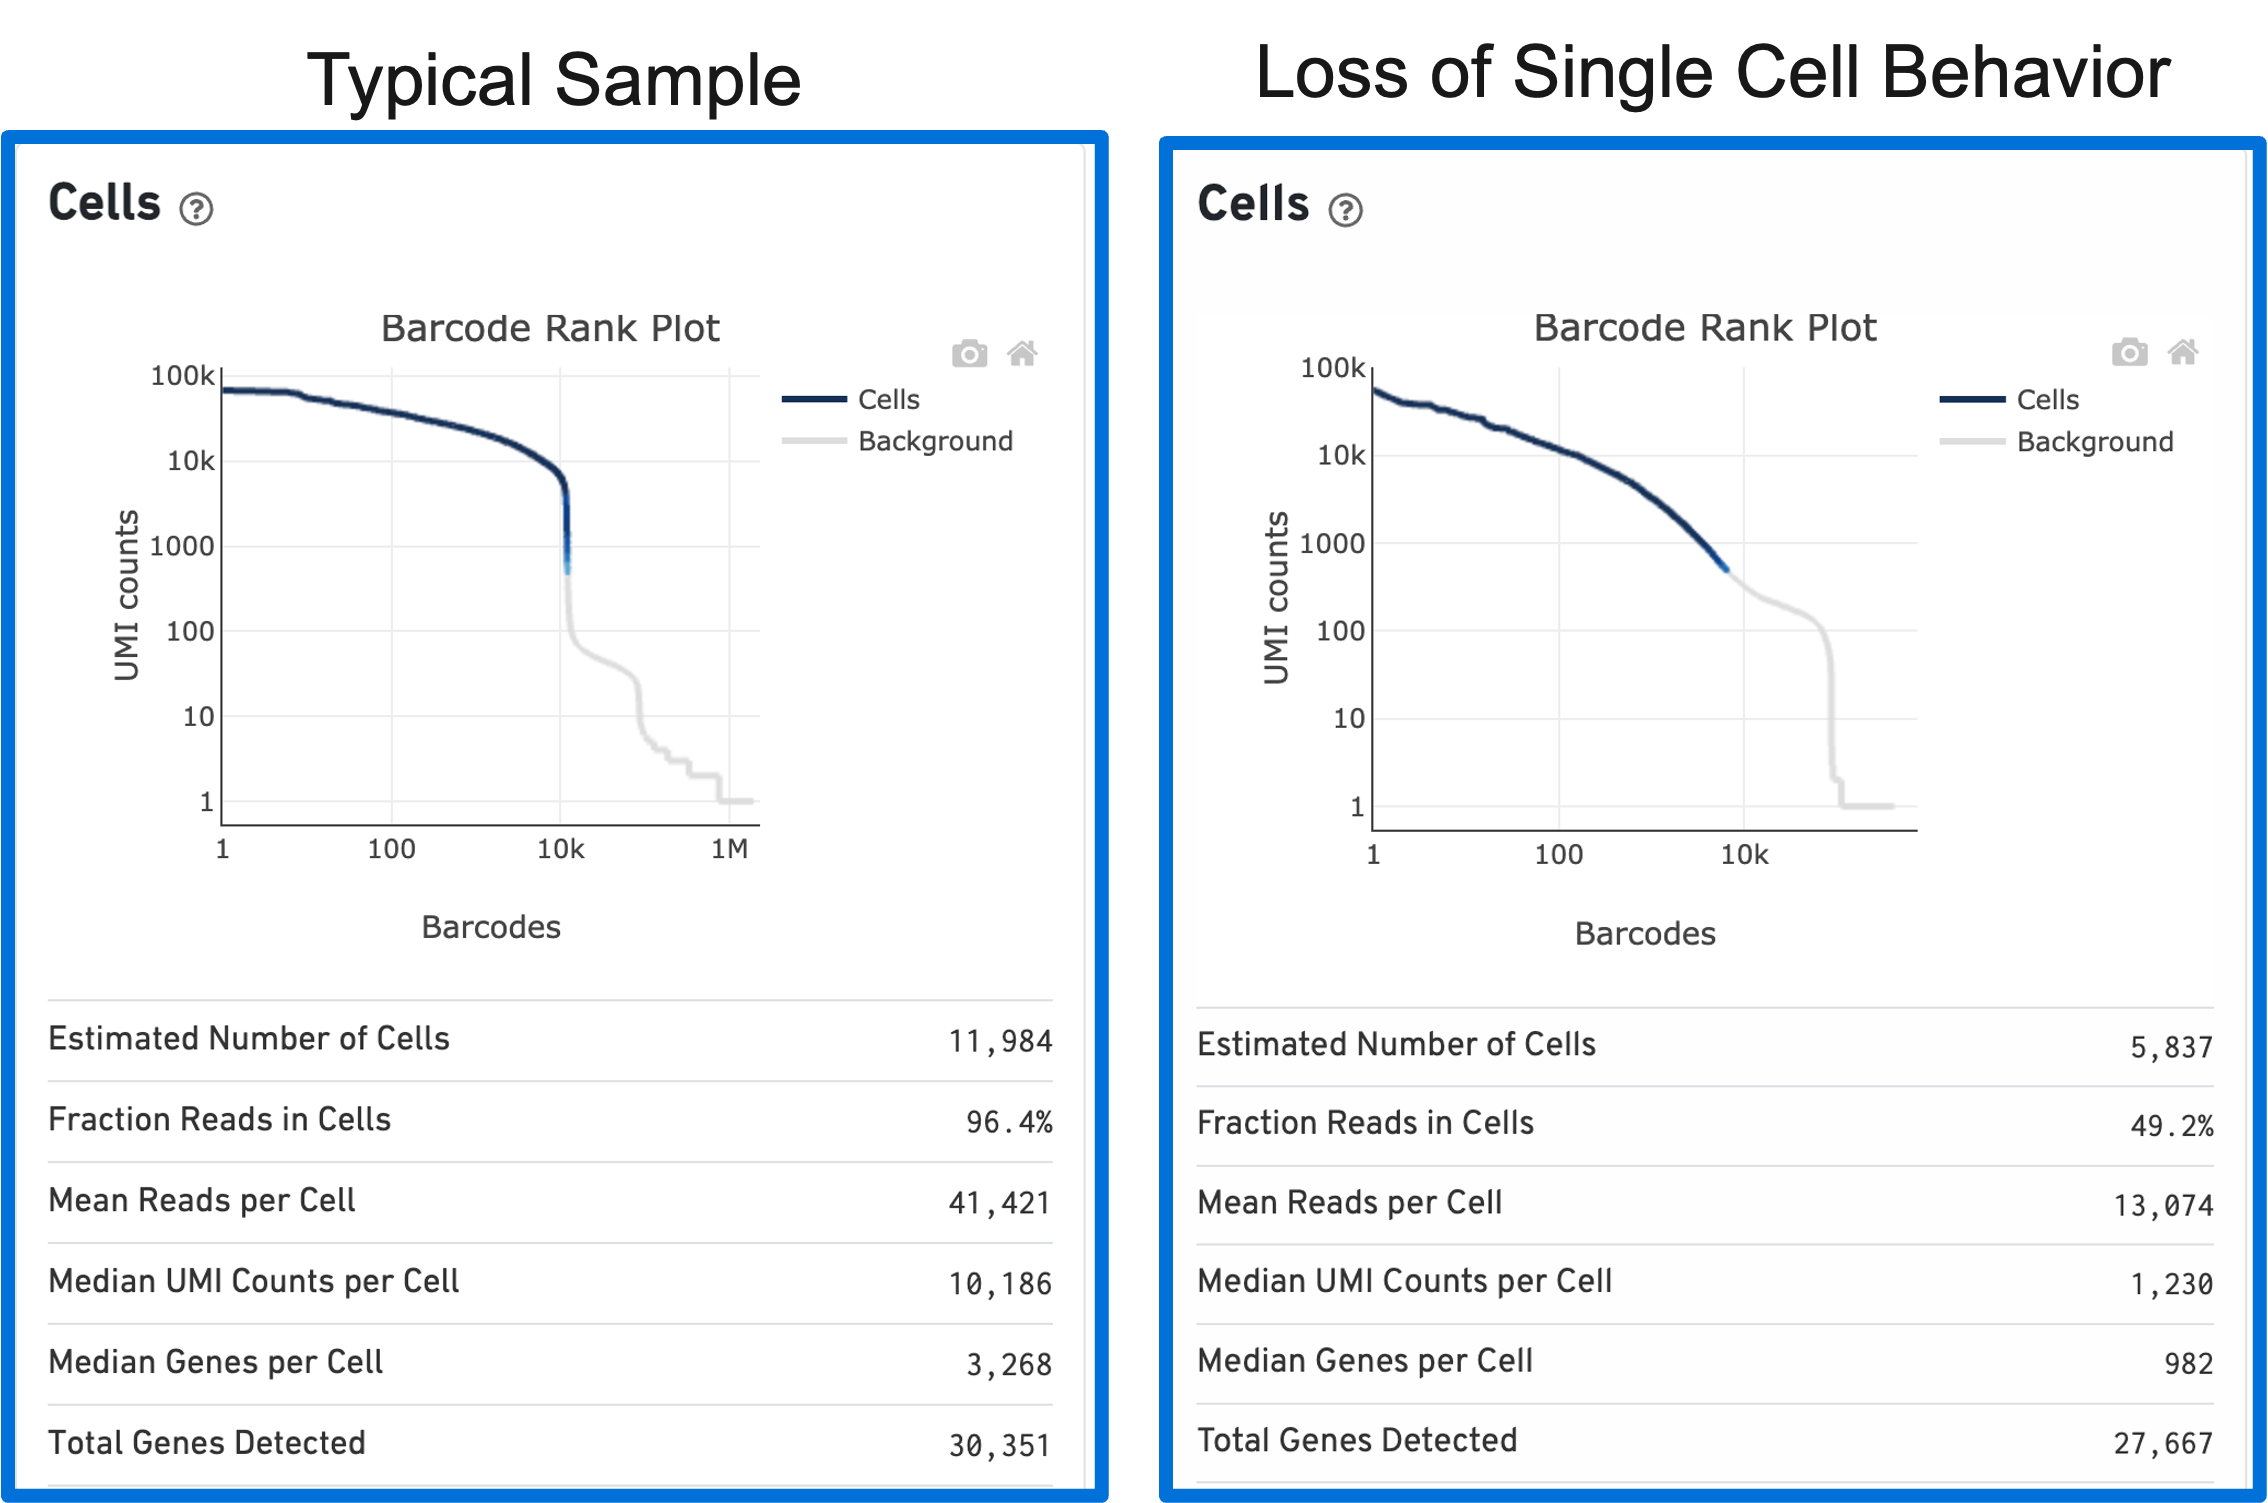
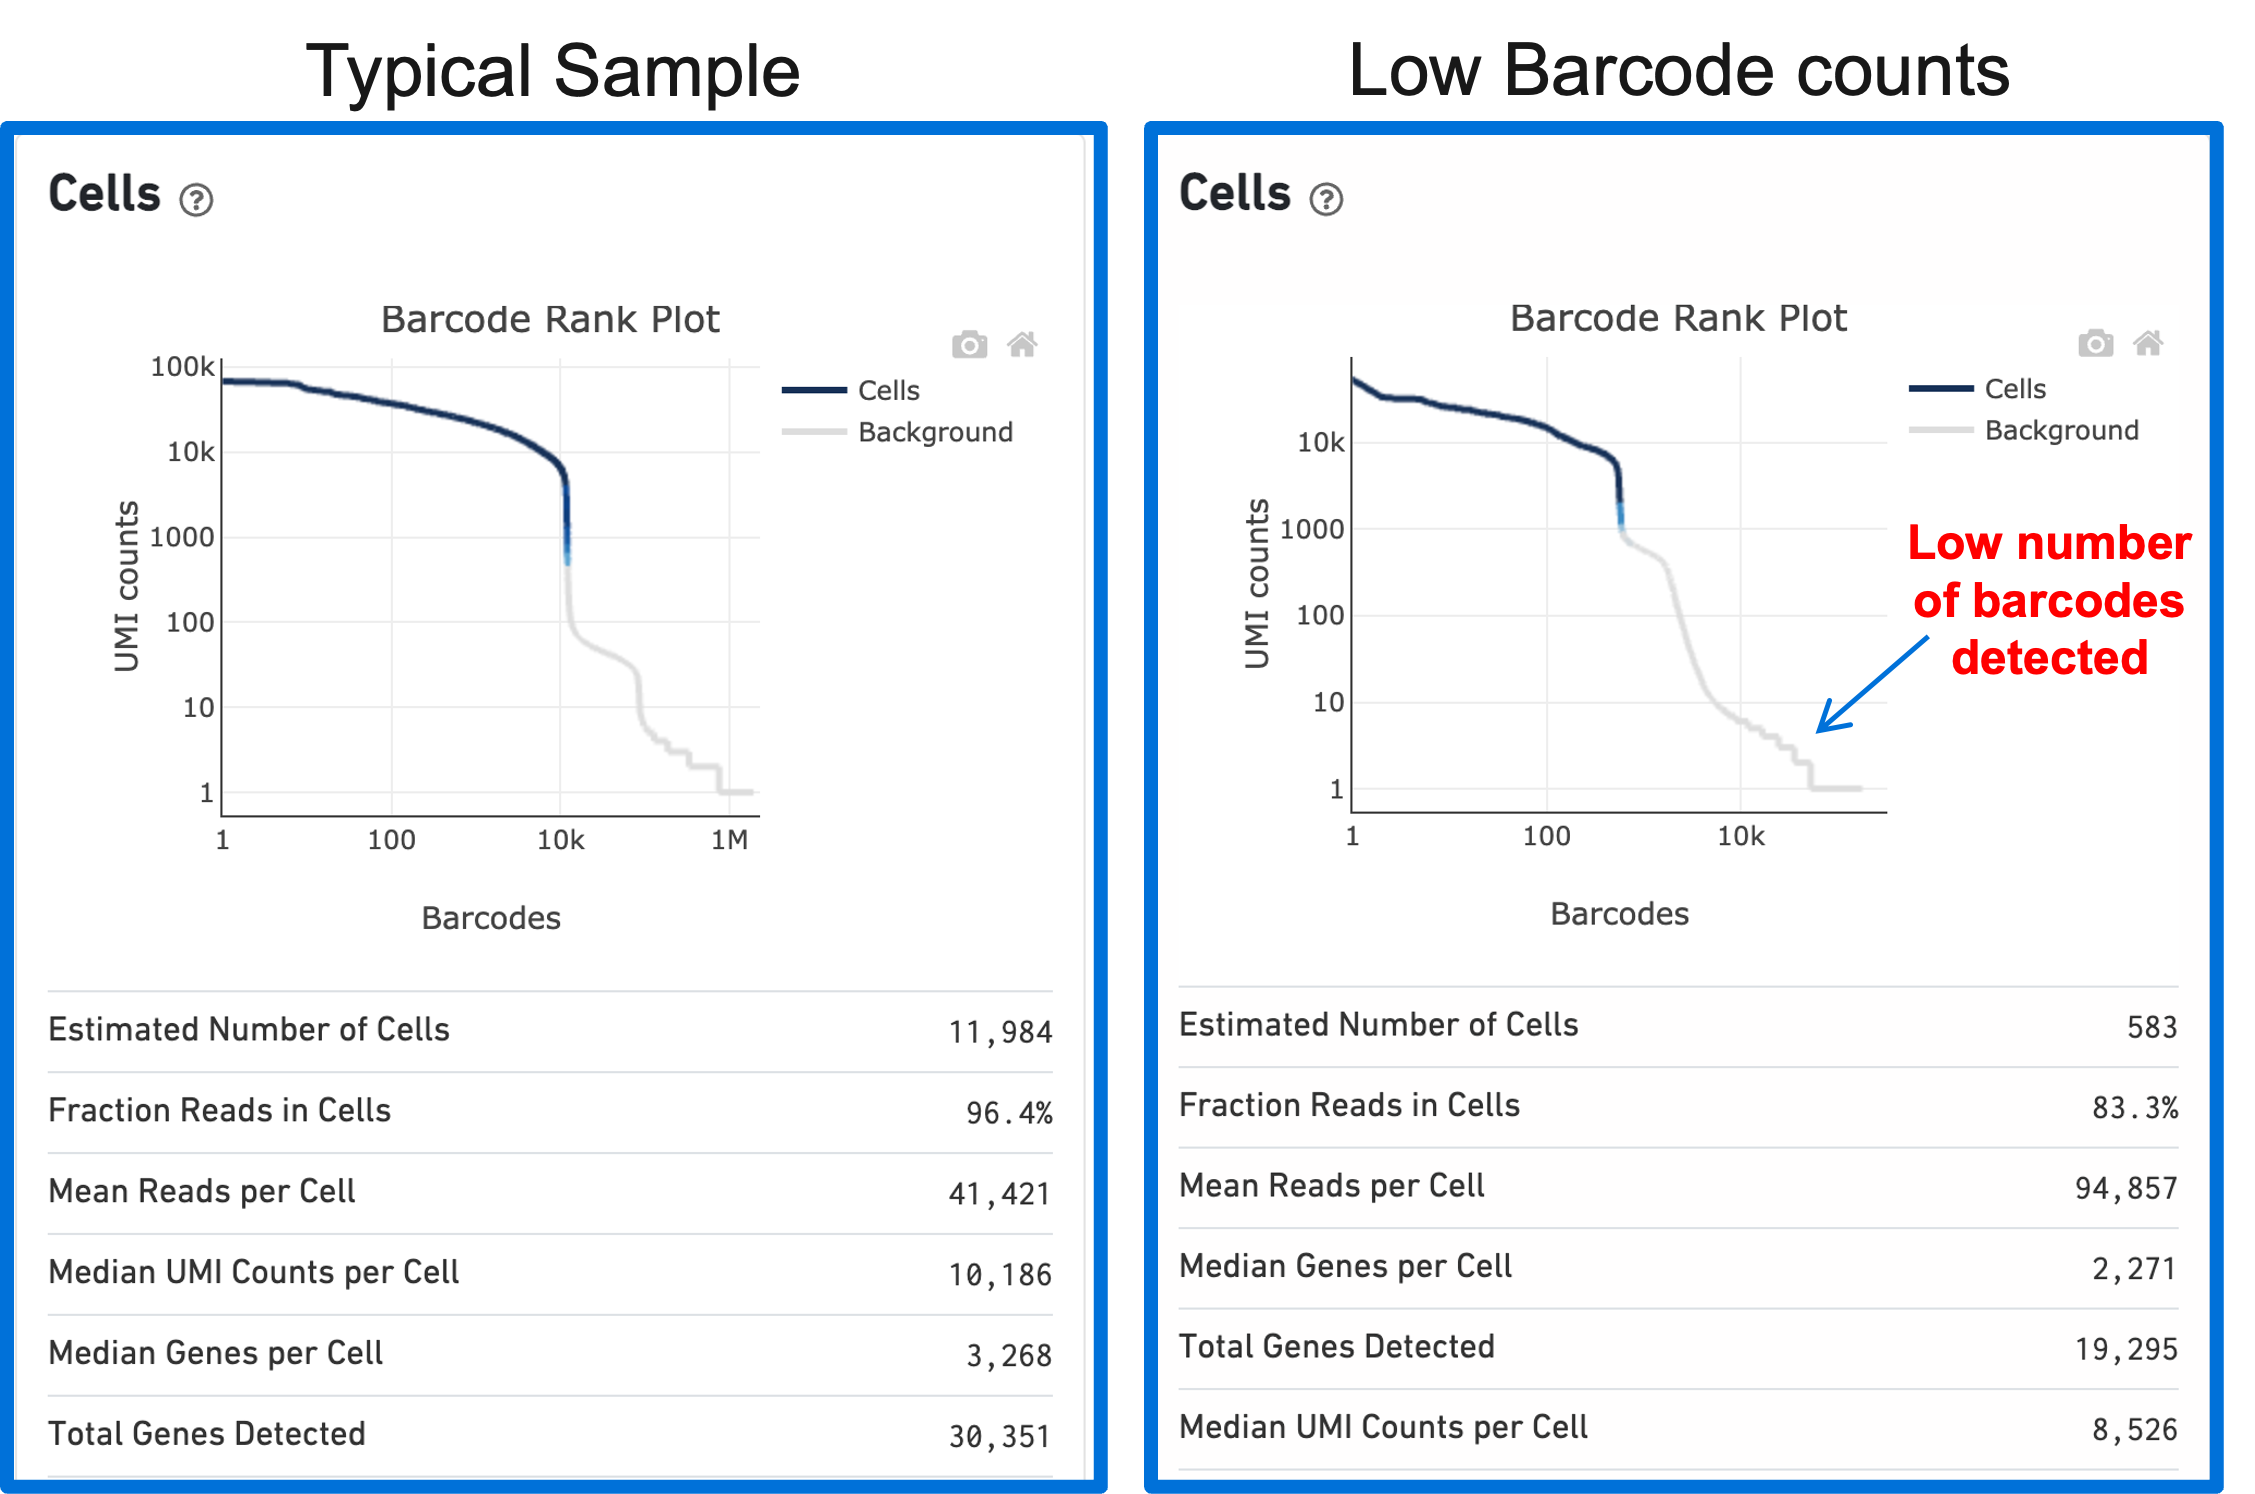
The shape of the Barcode Rank Plot can reveal compromises in sample quality or workflow. Two such compromises are: loss of single cell behavior and low barcode counts.
Loss of single cell behavior can occur due to workflow problems, like high levels of debris that prevent the creation of GEMs (also called a wetting failure). When there is a wetting failure, the estimated number of cells is unreliable because the algorithm has trouble discerning cells from background. An example of a wetting failure Barcode Rank Plot is shown below:
A clog in the chip (due to clumping in the single cell suspension and/or high debris) can result in low barcode counts. This, in turn, leads to lower-than-expected cell recovery based on the targeted cell number and can be seen in the Barcode Rank Plot (example below).
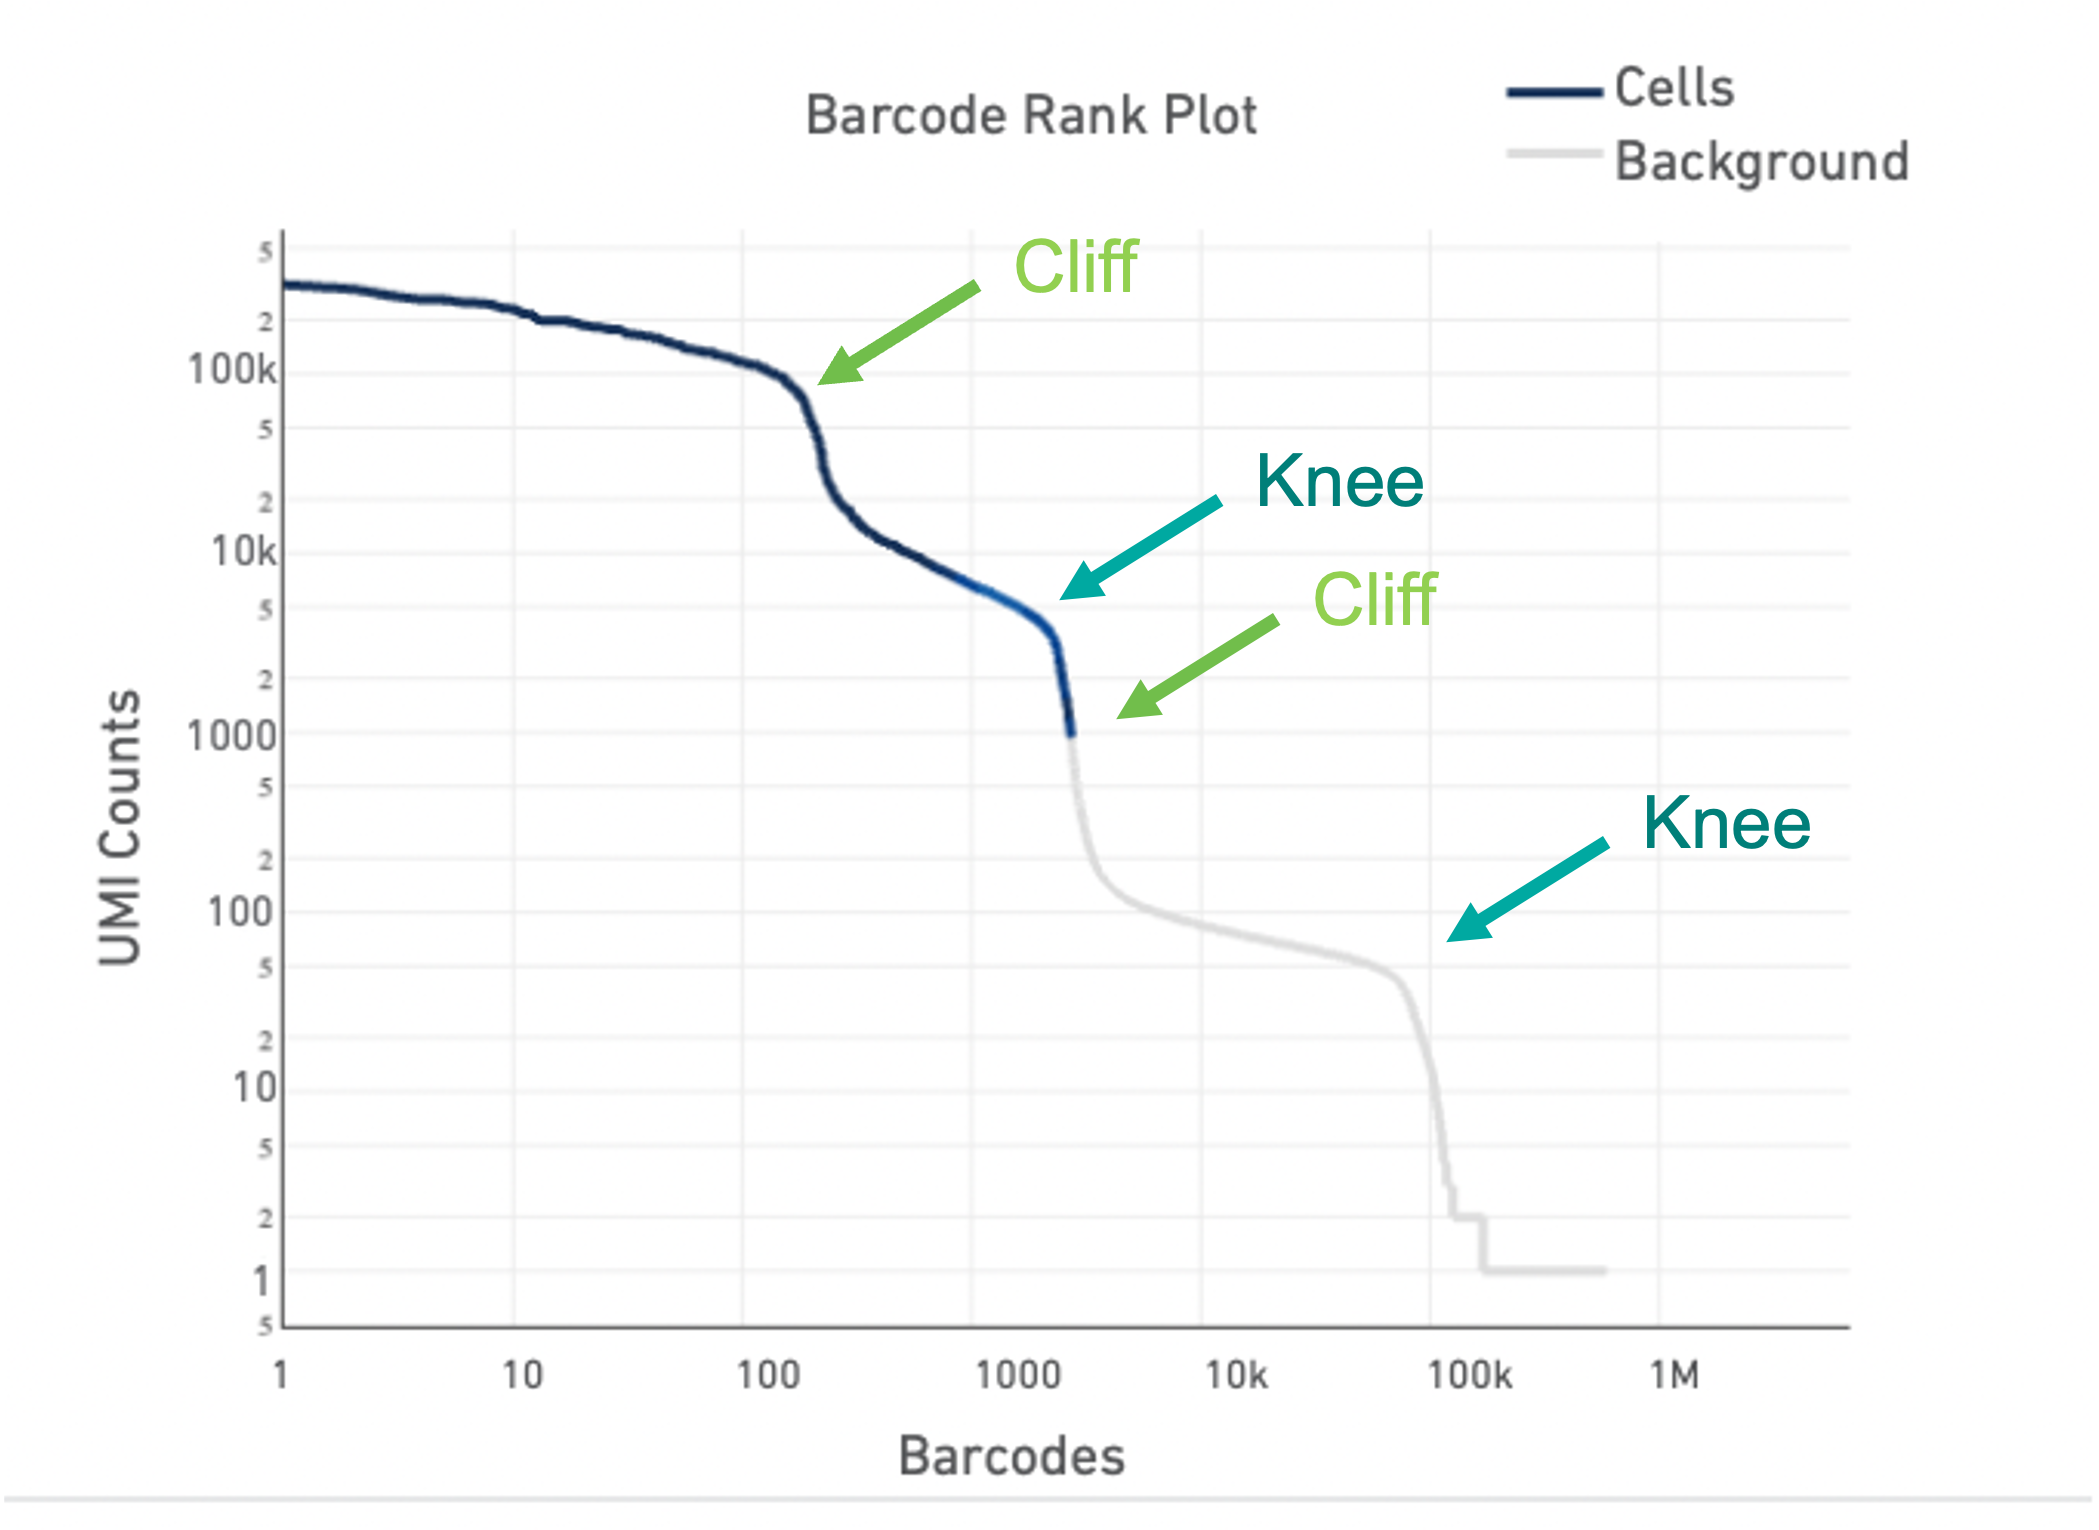
Lastly, the Barcode Rank Plot can help identify heterogeneous samples. Heterogeneous samples appear as two cliffs and knees in the plot (see example below). In general, the cell calling algorithm can identify true cells in heterogeneous samples. However, in rare cases, heterogeneity may only be observable by eye. The --force-cells option incellranger count can be used to identify the true cells in the heterogeneous sample.
For an in-depth look at how to identify a heterogeneous sample using the Barcode Rank Plot and use the --force-cells option, see our Capturing Neutrophils tutorial.