Cell Ranger5.1, printed on 04/26/2025
The first two pages of this tutorial provide a quick tour of the Loupe V(D)J Browser user interface with the tutorial dataset (T cell spike-in) loaded. There are two tabs to explore:
This page is is a walk-through of the Clonotype Distribution and Sequence tab.

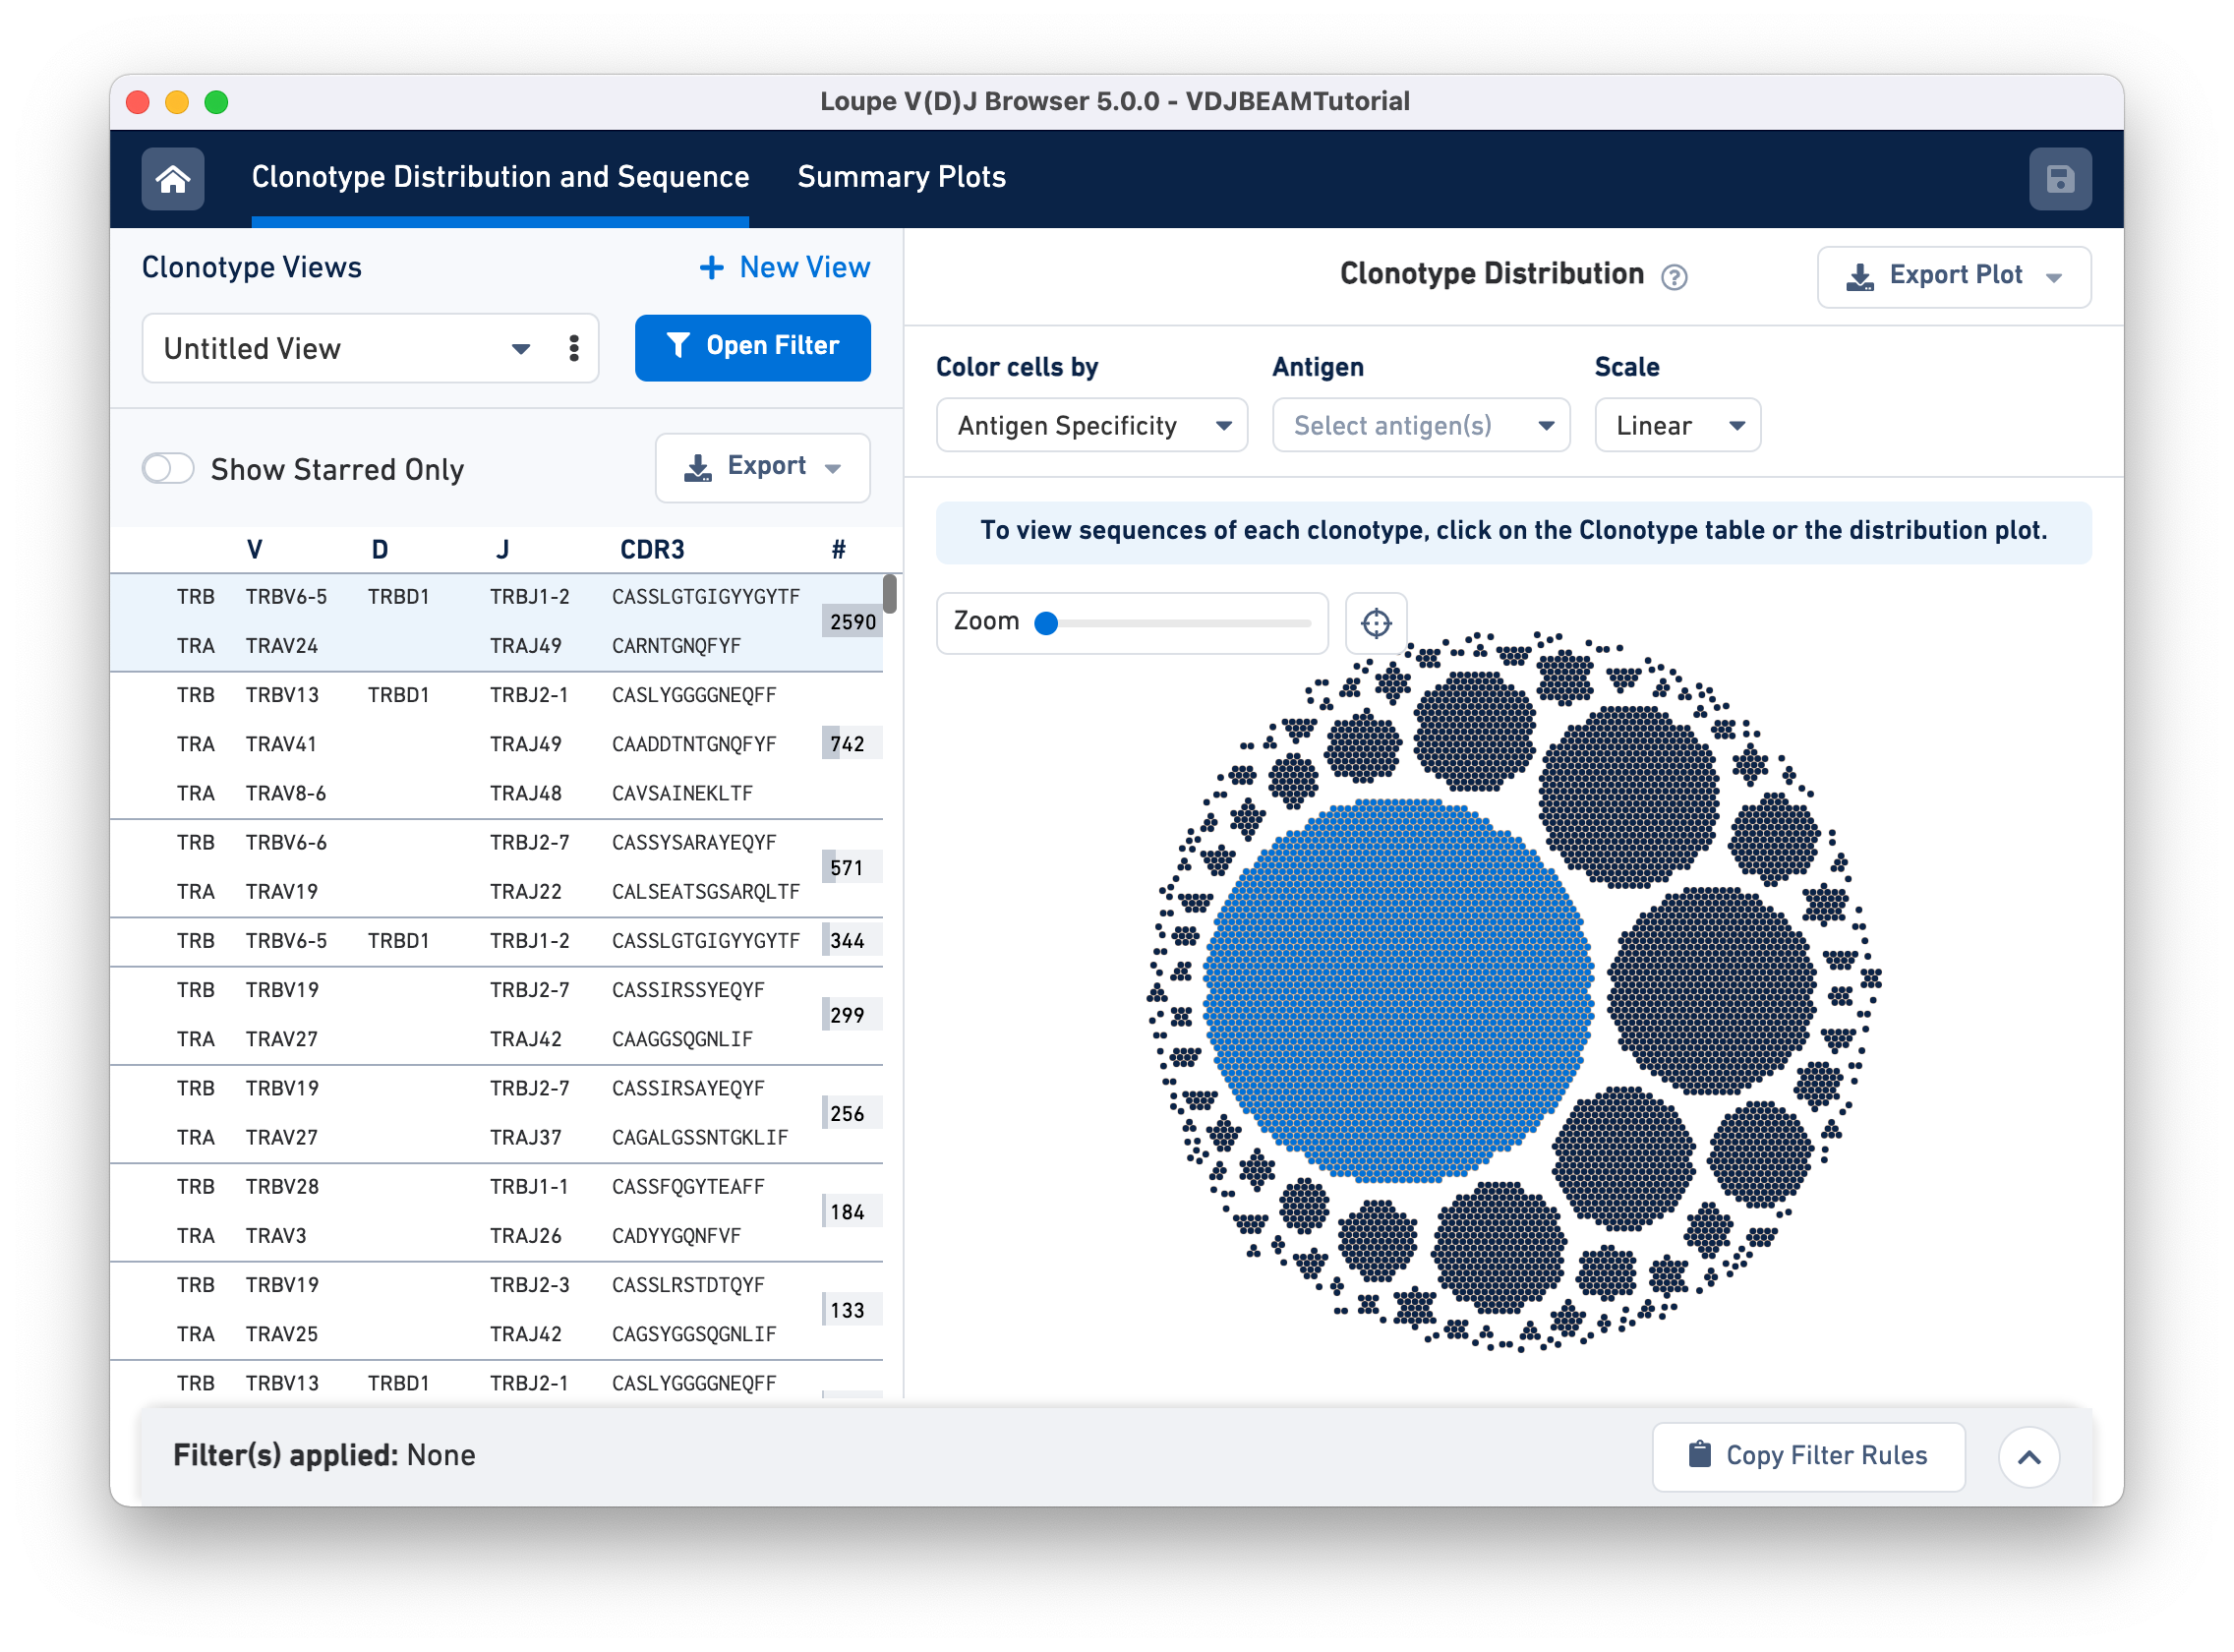
The Clonotype Distribution and Sequence tab has two main panels. The Clonotype Views (left) panel lists all the clonotypes in the dataset, sorted by abundance. For each clonotype, chains associated with that clonotype (TRA and TRB in this case) are listed as rows, along with their corresponding V, D, and J gene segments, CDR3 sequences, and the number of 10x Barcodes comprising that clonotype.
The right panel is the Clonotype Distribution plot, showing all cells grouped by clonotypes. Each dot represents a single cell (cell-associated 10x Barcode). Barcodes are grouped by clonotype ID and white spaces separate the different clonotypes. Larger clonotypes are in the center and smaller clonotypes are towards the periphery. Hovering over the graph highlights all the cells belonging to that clonotype as well the corresponding row for that clonotype in the Clonotype Views panel.
For example, hovering over the largest clonotype in the T cell spike-in dataset (blue dots) highlights the first row on the Clonotype Views panel.
Click, hold, and move your cursor around to explore the edges of the Clonotype Distribution plot. A zoom panel is provided on the top left to allow close examination of smaller clonotypes.
If an Antigen Capture library was included in the analysis, the cells in the Clonotype Distribution plot can be colored by antigen specificity score or antigen UMI counts (on a linear or log scale). Use the drop-down menu to select your antigen of interest:
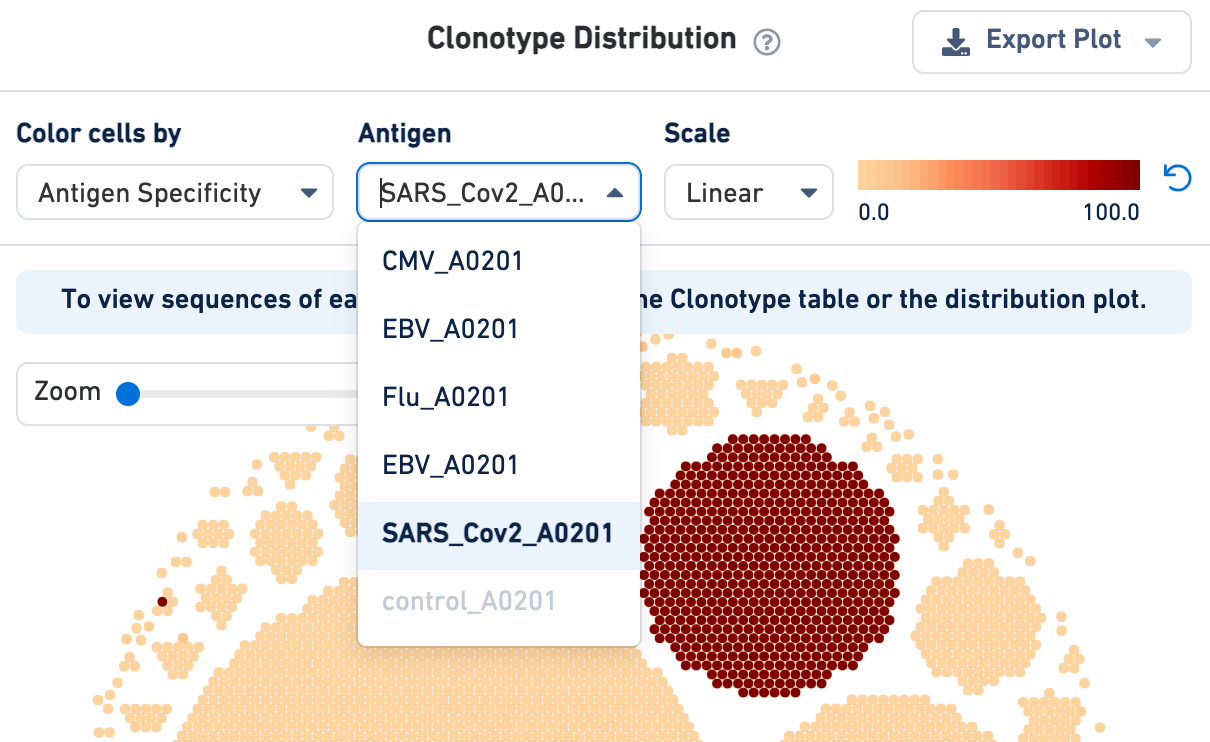
Note that Loupe V(D)J Browser v5.0 extracts antigen names from the Feature Reference CSV provided to the Cell Ranger multi pipeline. These names cannot be changed via the Loupe V(D)J browser interface. To rename antigens, you must re-run the Cell Ranger multi pipeline with the correct antigen names in your Feature Reference CSV.
To export the customized Clonotype Distribution plot in PNG or SVG format, click on the Export Plot drop-down button on the top right.
You may click on the clonotype of interest in either the Clonotype Distribution plot (right) or the Clonotype Views list to enter the Sequences view. The default is a zoomed-out view that shows the alignment of the various exact subclonotypes in this clonotype to the universal reference, the donor reference, and the consensus sequence. Each exact subclonotype is a row in the alignment.
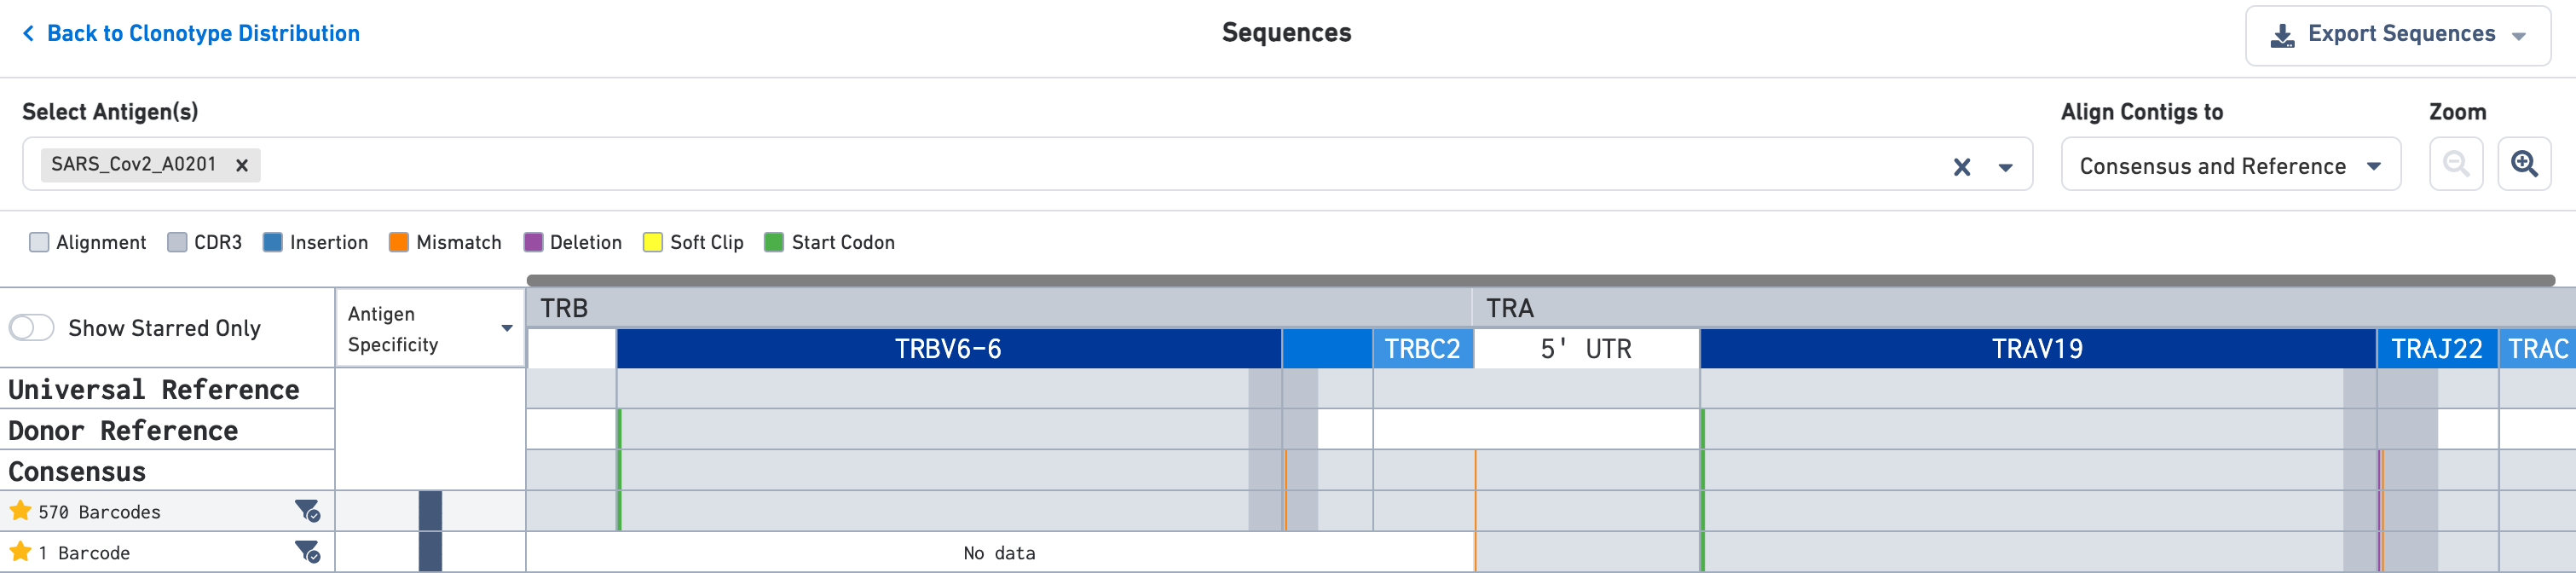
Use the Select Antigen(s) section on the top of this view to get antigen specificity scores or UMI counts for each exact subclonotype listed here. In this example, the clonotype includes two exact subclonotypes each with an antigen specificity score of 100 for the SARS-CoV-2 (COVID) antigen; one exact subclonotype has 570 barcodes and the other has a single barcode.
Hover over the exact subclonotype of interest for more information. The pop-up window also has the option to download a list of all barcodes in that exact subclonotype as a CSV file.
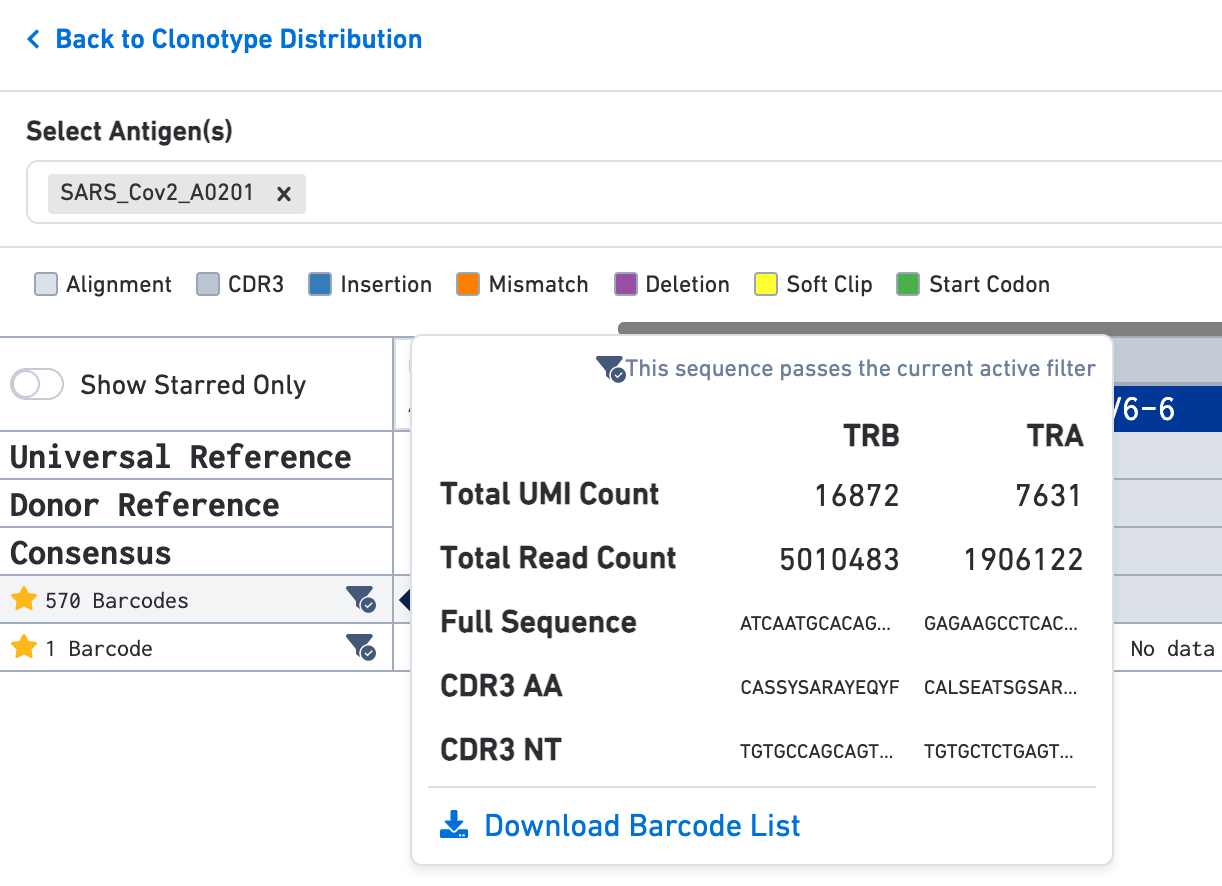
You can also star exact subclonotypes of interest by clicking on the star sign displayed in the Sequences view. Starred barcodes can be filtered from the clonotype list on the Clonotype Views panel by toggling to Show Starred Only.
Click on the Zoom + button on the top right of the Sequences view or simply click on the grey part of the sequence alignment to obtain nucleotide sequences for full-length V, D, and J gene segments present in these exact subclonotypes. Start codon, insertions, deletions, mismatches, soft clips, and CDR3 regions are highlighted (see legend).
To export sequences in CSV format, click on the Export Sequences button located at the top right of the Sequences view.
Video tutorial:
The new Loupe V(D)J browser has an improved user interface with options to filter data based on UMI counts per antigen or antigen specificity scores for antigens of interest. Click on the blue Open Filter button at the top of the Clonotype Views panel to open up the filtering window. Alternatively, clicking on the up arrow at the bottom right of the browser also expands the filtering window, as shown in this image:
In the filter window, there are two tabs:
Hover over the ? next to each tab to learn more about the metric. The ranges can be customized by dragging the sliding scale bar for each antigen of interest, or by manually entering the desired min and max values in the text boxes provided next to the adjustable scale.
Buttons are provided to quickly Reset all to 0 and Reset all to full range.
The middle section of the filter window has additional filtering options:
.cloupe file: import a .cloupe file and filter clonotypes belonging to specific graph-based or K-means gene expression clusters. Visit the Integrated Analysis section to learn more.SAR.V search sequence will find chains with SARAV, SARIV, and SARPV residues, among others.? next to metric to learn more.In this example, we are filtering for cells that have an antigen specificity score >90 for SARS-CoV-2 (COVID) antigen, and for clonotypes that have the TRBJ2-7 gene with at least 450 barcodes. As you can see, filtering the data dynamically changes the Total Results panel displayed on the bottom right. The current filtration criteria include one clonotype (out of 195) and 571 barcodes.
You can save filtration criteria for future use by clicking on the three dots in the text box by Clonotype Views. Click the Edit View Name to customize the name of the filter.
Loupe V(D)J Browser v5.0 and later also has a Copy Filter Rules button on the top right of the Filter window that copies the filtration criteria to the clipboard. This feature makes it easy for users to copy and paste filtration rules to a text file or digital lab notebook for future use.
Clicking on + New View allows you to visualize the unfiltered data and create new filter settings. The default name of a new filter is 'Untitled_View_#'. You can create multiple filtration views and use the drop-down arrow to toggle between views.
Loupe V(D)J Browser allows you to save your .vloupe file with all the filtration criteria. Click the save button on the top right to overwrite the existing vloupe file. Alternatively, select File --> Save As.. to write to a new .vloupe file.