Cell Ranger5.1, printed on 03/30/2025
Chain View allows you to explore clonotype chain sequences at a contig-by-contig, base-by-base level. To enable Chain View, click on any chain in the clonotype list. Let's start by looking at the beta chain of the first clonotype in the clonotype list (TRB:TRBV20-1:TRBJ2-1:TRBC2; CDR3 CSARAVLAGDAGEQFF):
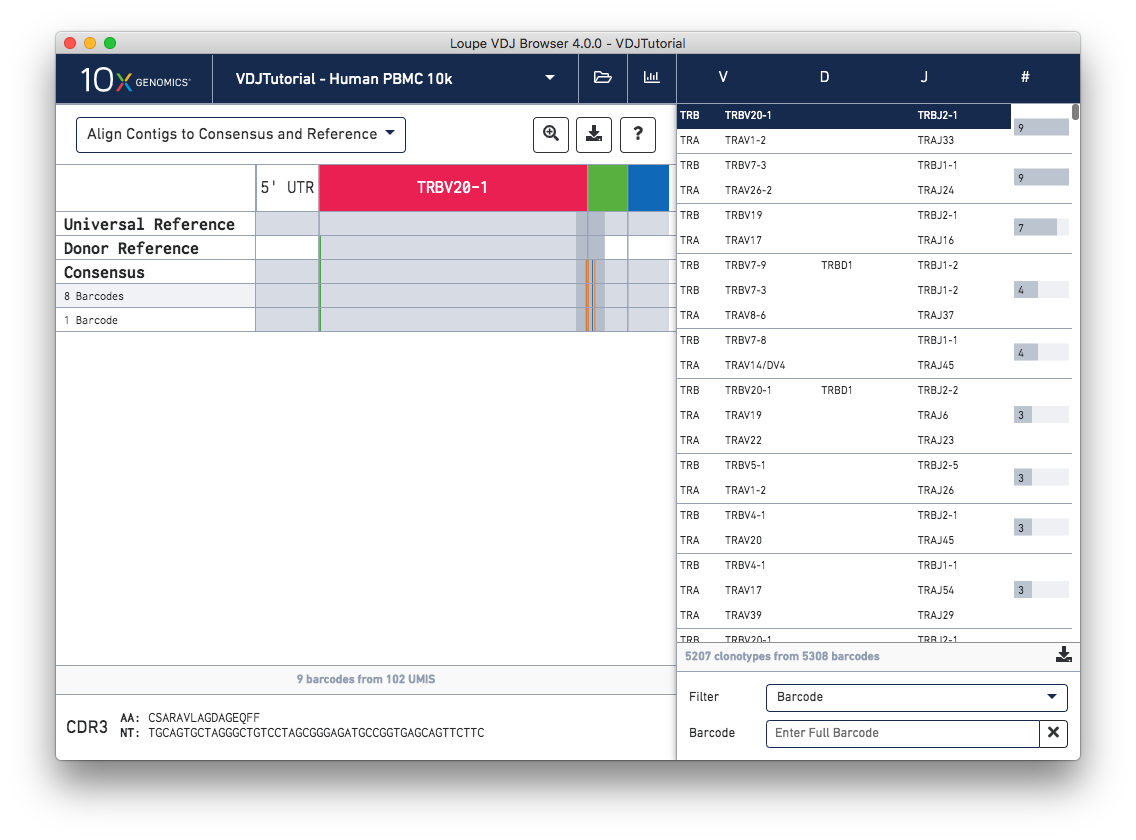
When you first click on a clonotype chain, you'll see a series of rows – grey bars of various widths preceded by a barcode count (8 Barcodes). In this view each row represents an exact subclonotype, or a subset of cells in a clonotype with identical immune receptor nucleotide sequences.
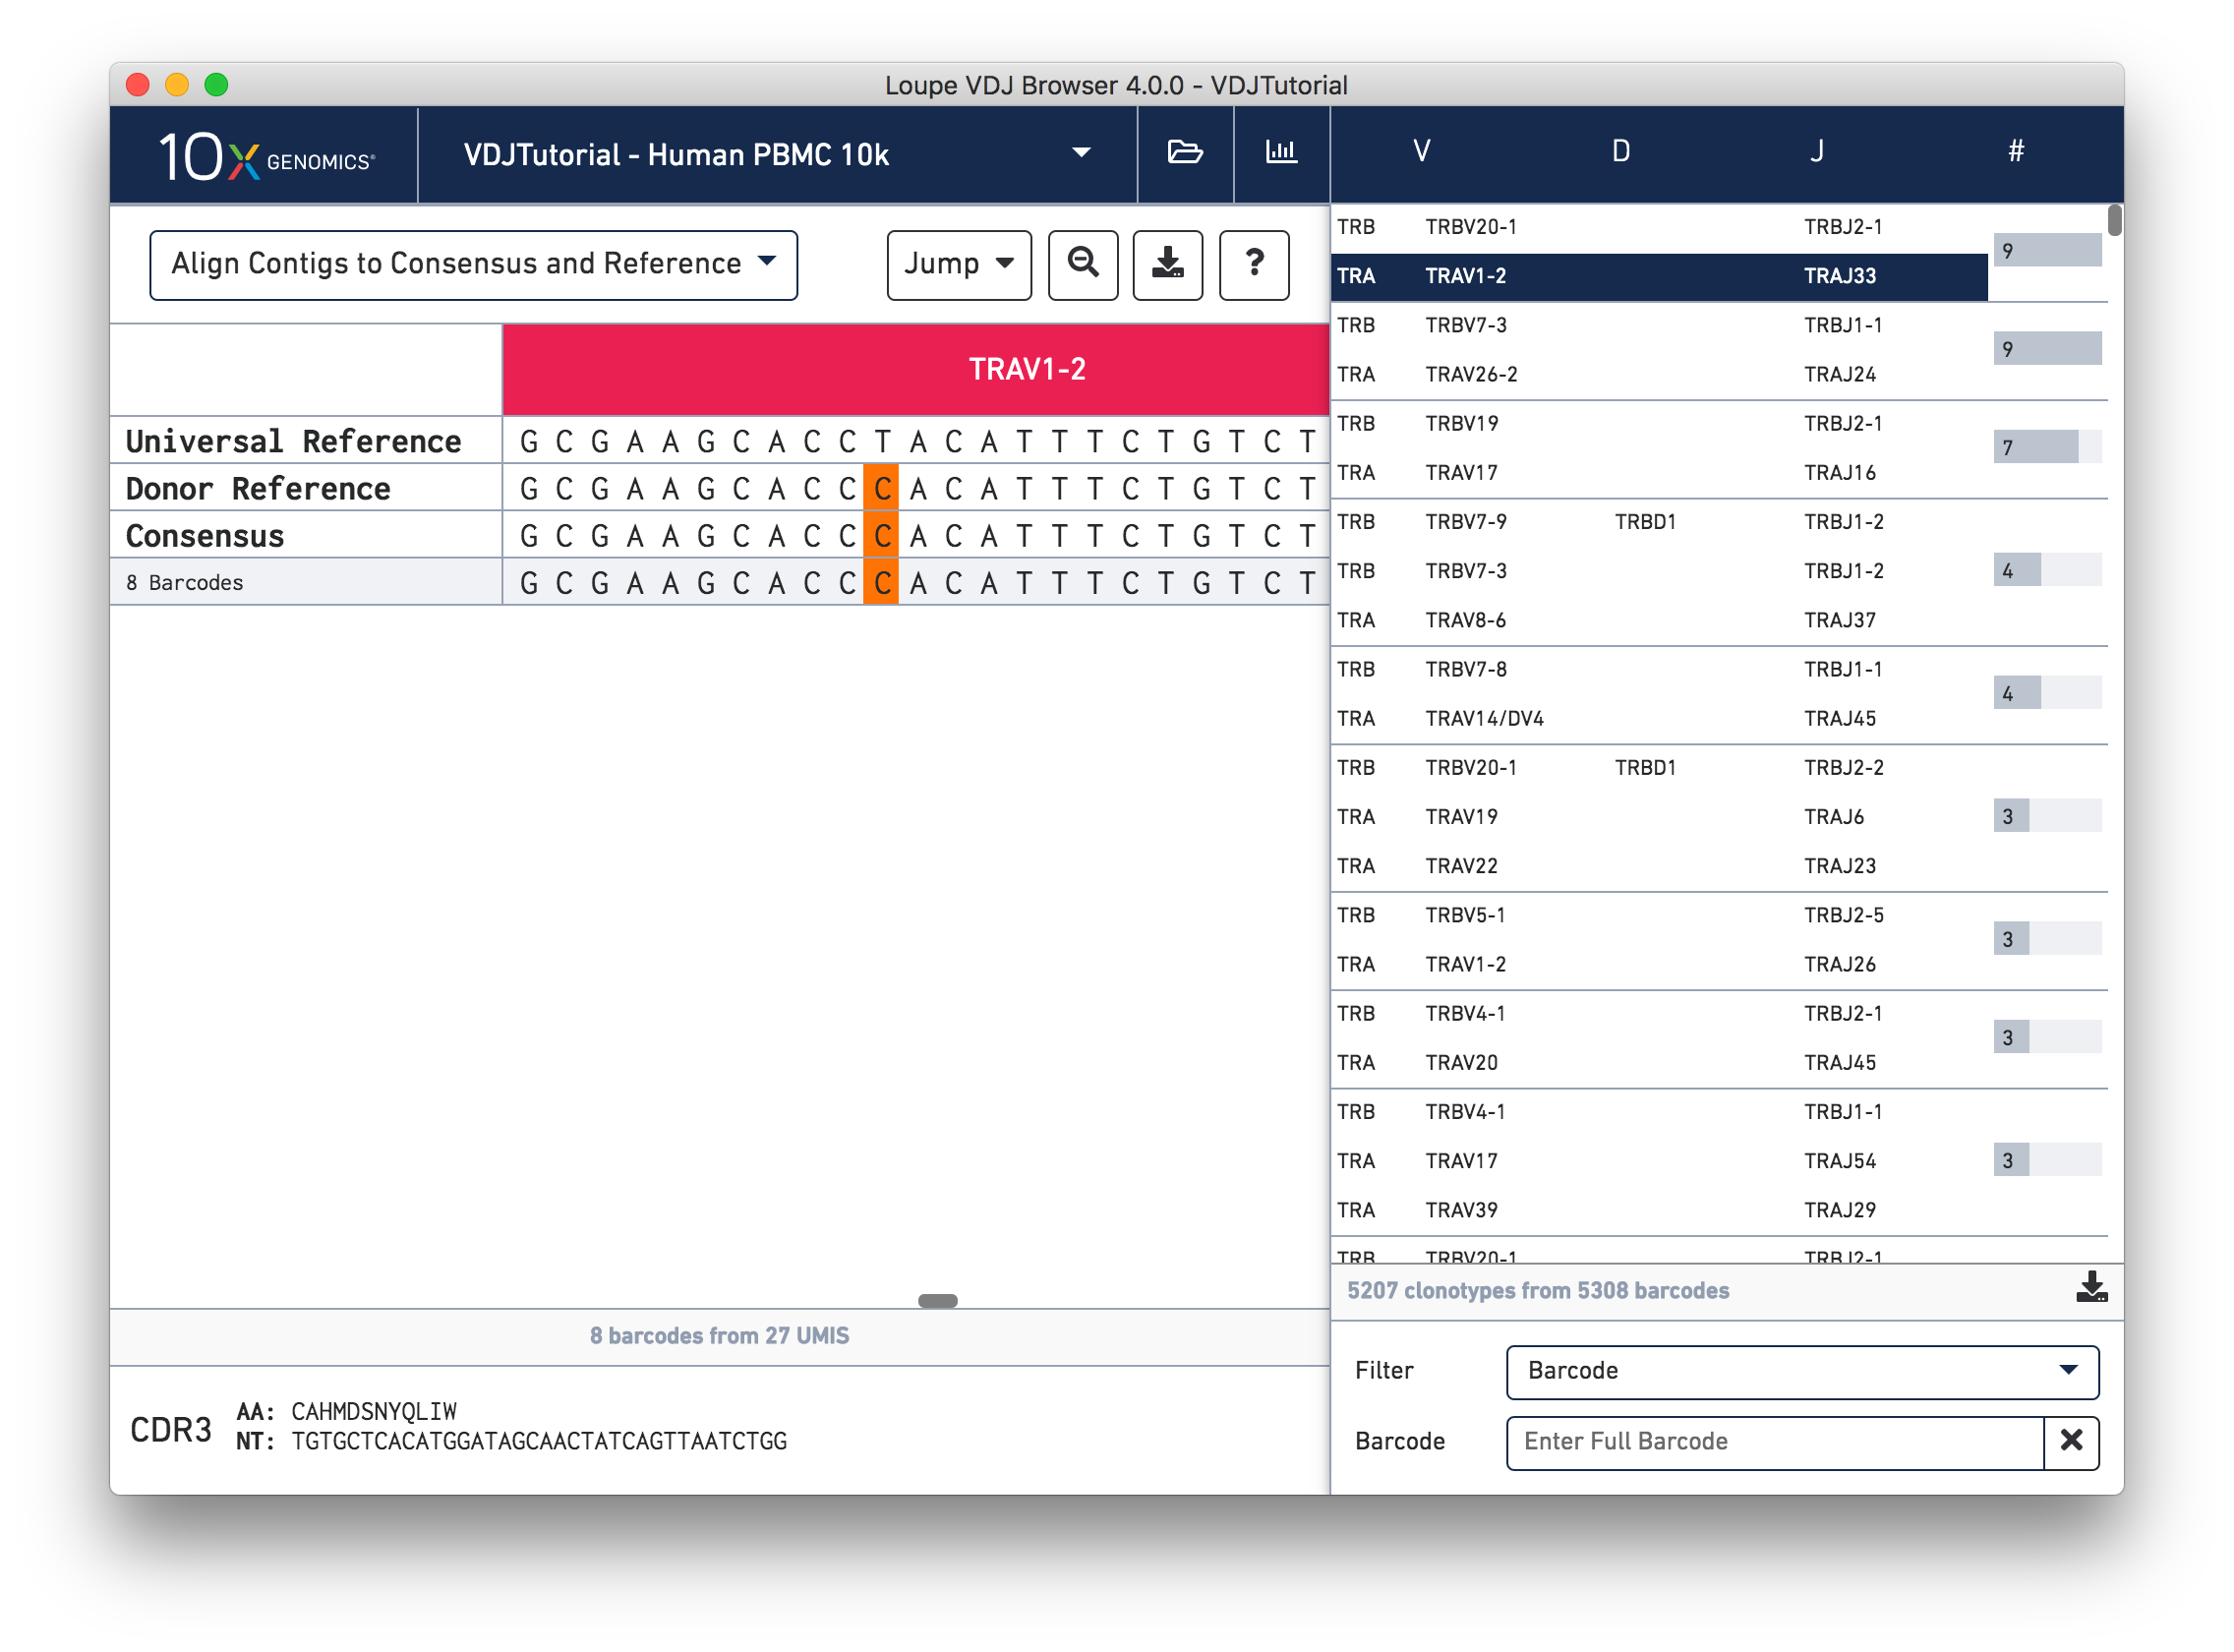
The row marked Consensus above the exact subclonotype rows is the chain consensus sequence, a sequence that represents the sequence of the first exact subclonotype for a receptor chain within the clonotype. Above the consensus is the Donor Reference sequence, or the inferred germline sequence for the V gene based on common mutations shared between single T or B cells from a single donor. The next row up is the Universal Reference sequence, which is a concatenation of the reference sequences of each gene detected in the chain.
Finally, atop the reference and consensus sequences are the gene annotations themselves, which indicate where the detected gene segments start and end. You can move your cursor over these annotations to see the gene name, or refer to the highlighted chain in the clonotype list.
As mentioned above, each row in this list represents an exact subclonotype sequence. The gray backgrounds indicate where the sequences align to the reference. As you can see, the 5′ and 3′ ends of the donor reference sequence are white, indicating that the donor reference sequence covers only the V gene and not the 5′ UTR, or J gene. When the end of an exact subclonotype row is white it indicates that the assembled contigs in that exact subclonotype did not span the entire sequence of the reference.
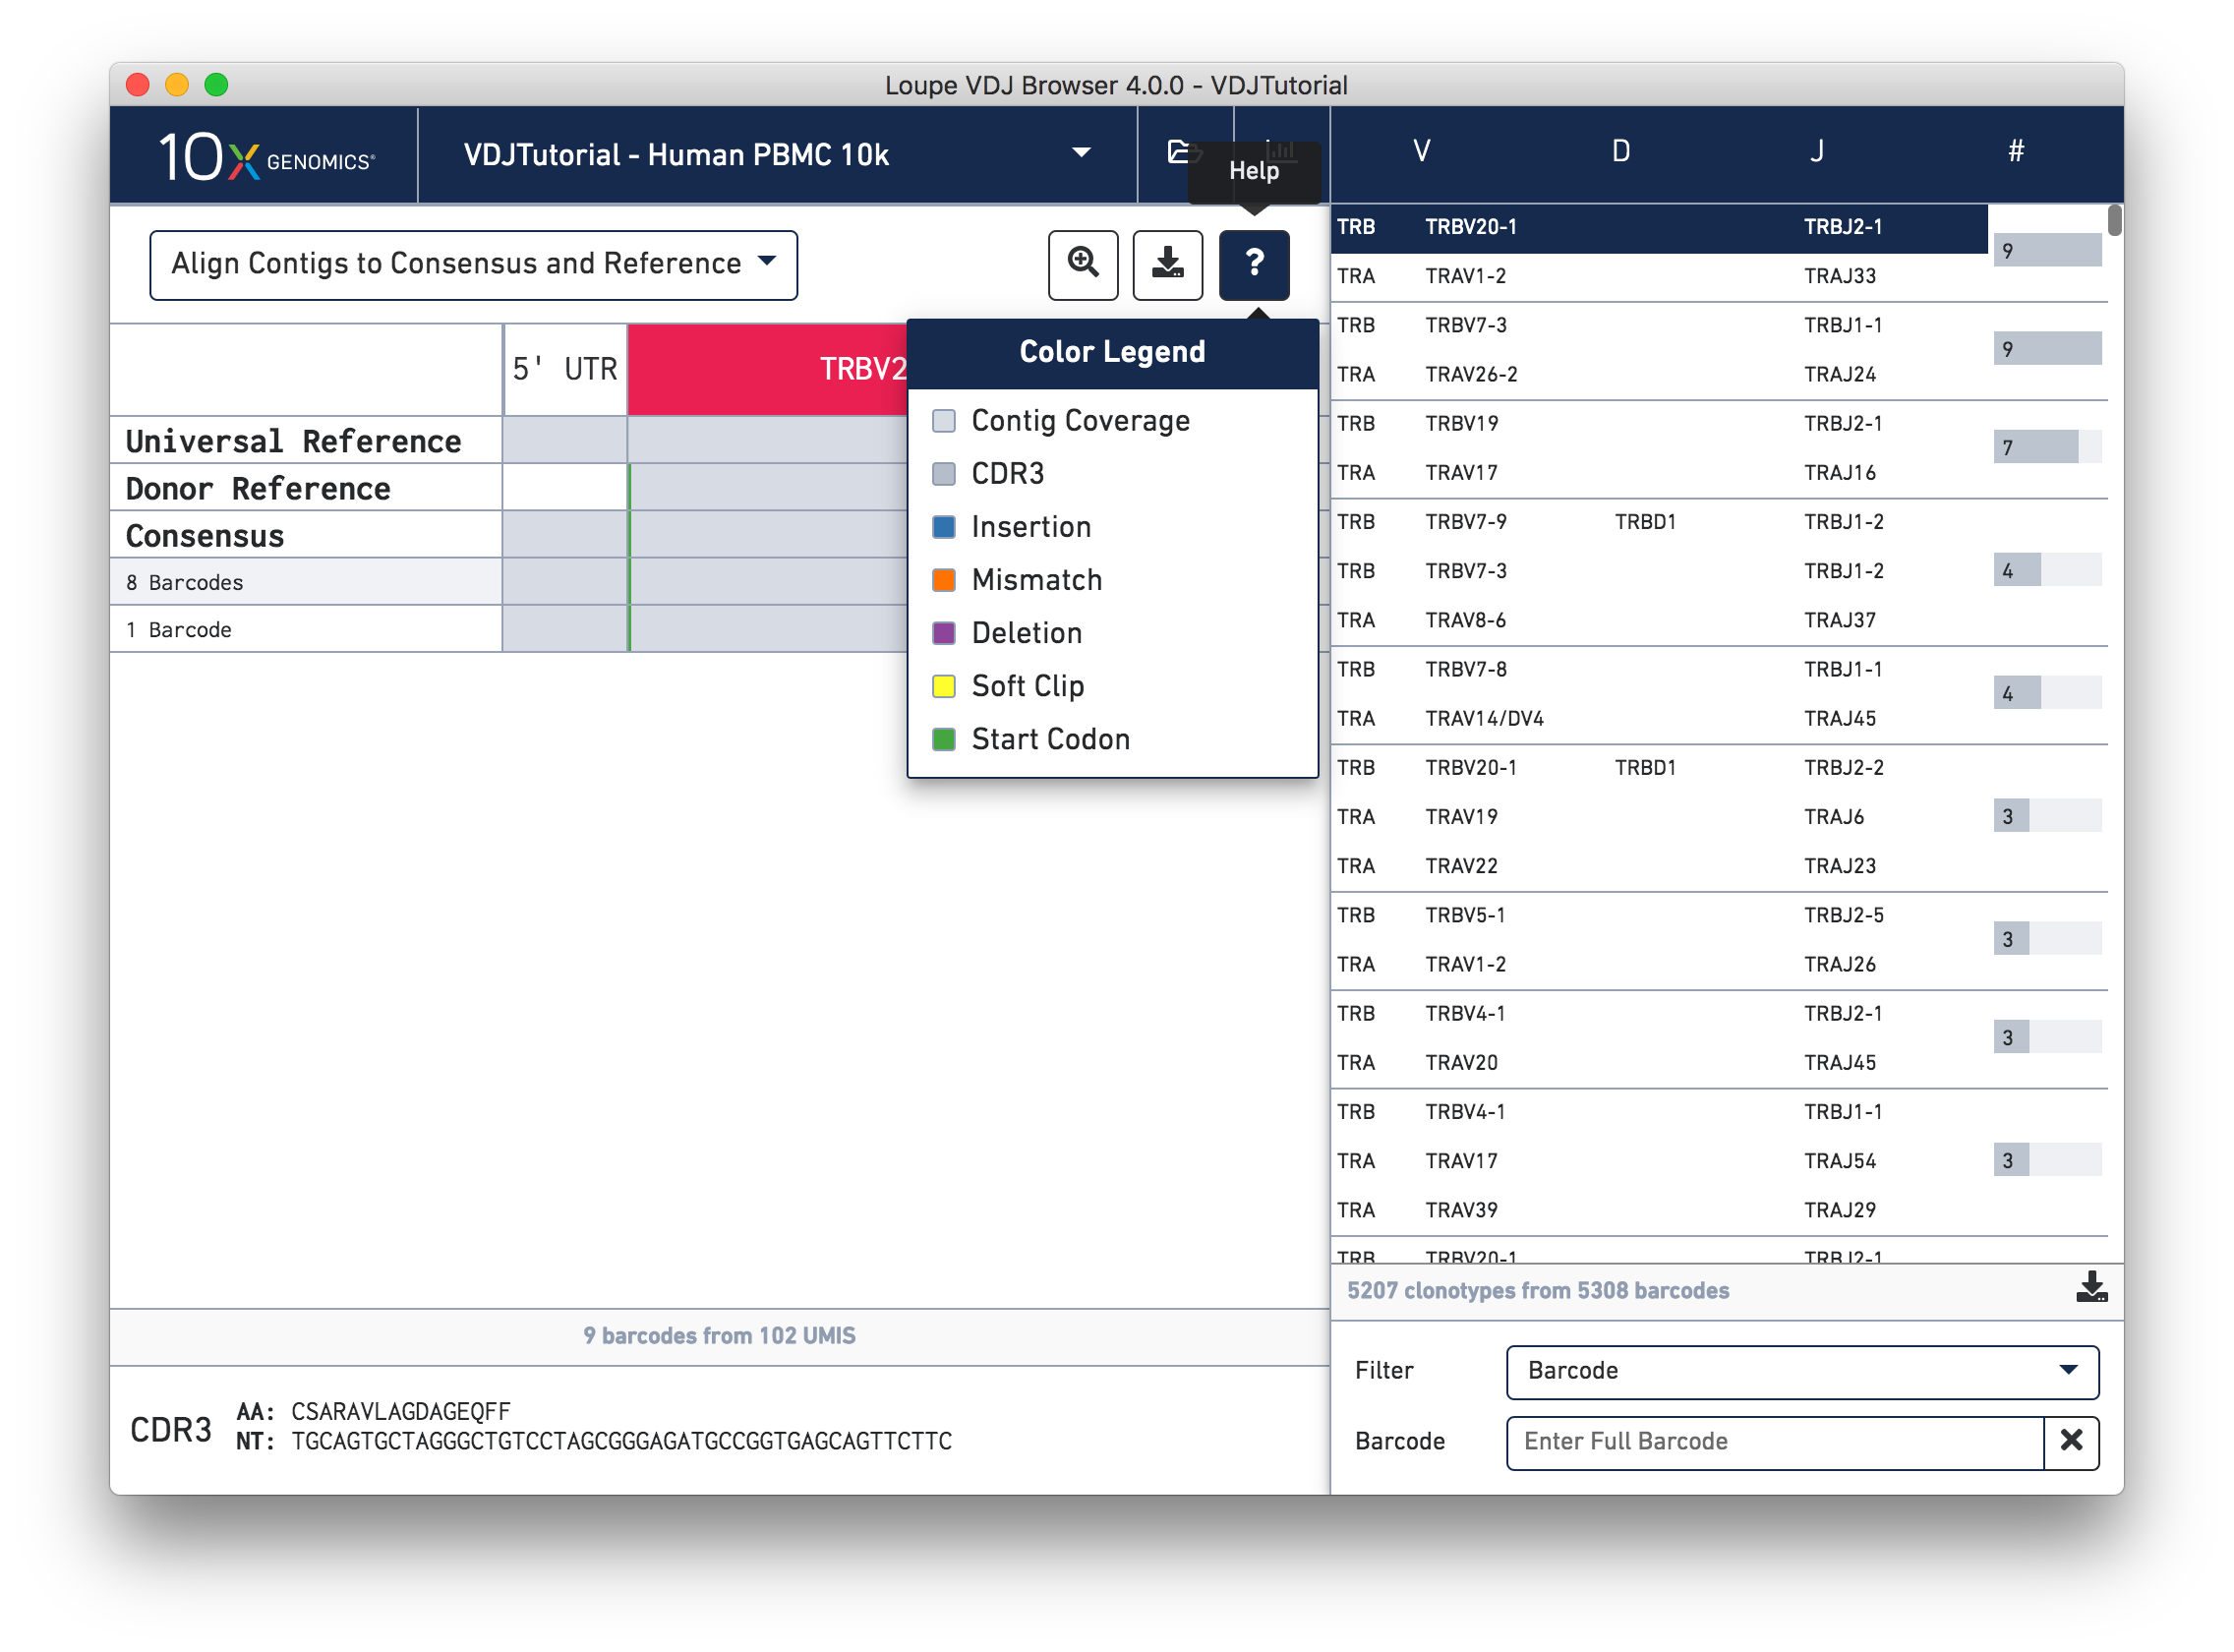
You can also see a series of vertical lines or blocks of various colors across some of the rows. Each indicates a feature of interest, such as a start codon or a variation from the reference. The button showing a question mark will display a legend showing what feature each color represents. Usually, start codons appear at the very beginning of the V gene annotation.
Somatic cells are not just characterized by their V, D, and J genes; the addition and deletion of bases at gene junctions during V(D)J recombination further contributes to T cell diversity. Because of this additional variability, areas around gene junctions will often appear to have many mutations compared to a canonical reference, as you see in this chain. Note, however, that the consensus sequence has the same variants here as the contigs, since it comes from the first exact subclonotype in the table.
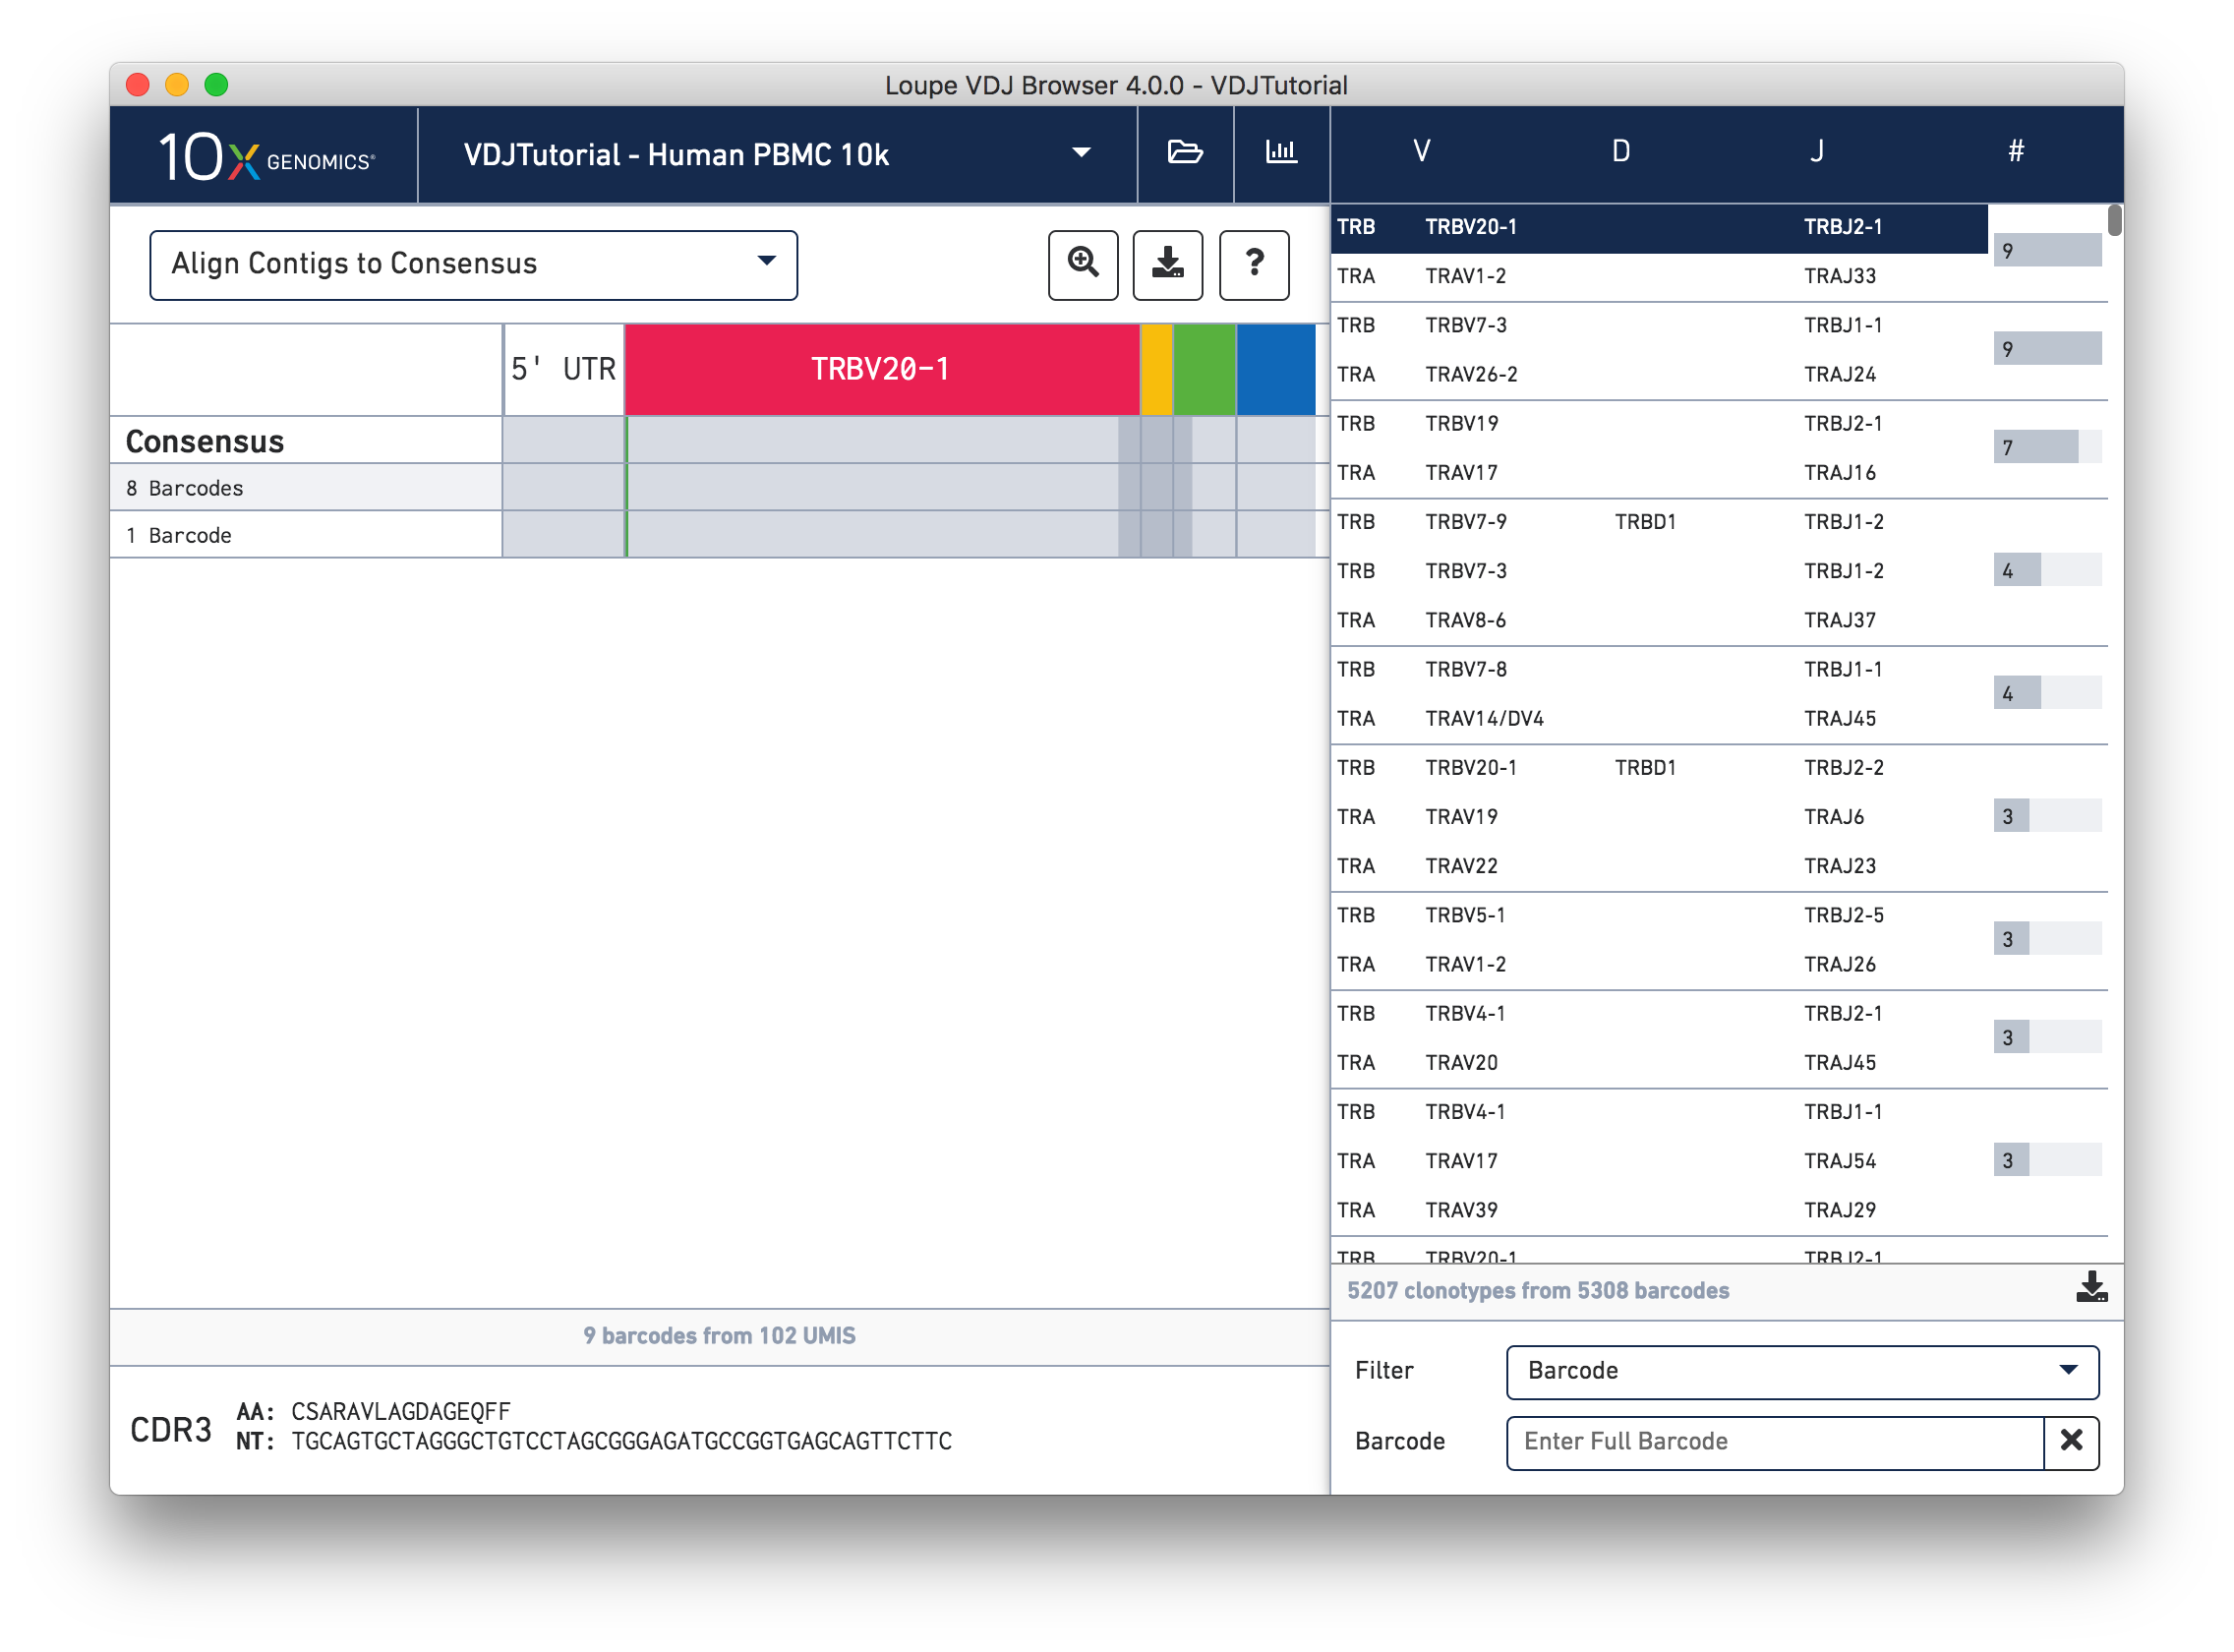
While it is useful to see the common mutations around gene junctions, they make it difficult to assess how closely the contigs map to the consensus sequence. You can more easily do this by visually aligning the contigs to the shared consensus sequence. To do so, click the selector above the gene annotations and select Align Contigs to Consensus.
Switching to consensus alignment view hides common intra-junction variability. In this case there is no difference (no mismatches, insertions, or deletions) between the exact subclonotypes. One might expect identical contigs to be grouped together into a single exact subclonotype, but the next section will explore why one cell barcode was grouped differently from the other eight.
Click on the alpha chain of the same clonotype (TRA:TRAV1-2:TRAJ33), and select Align Contigs and Consensus to Reference view in the top left dropdown.
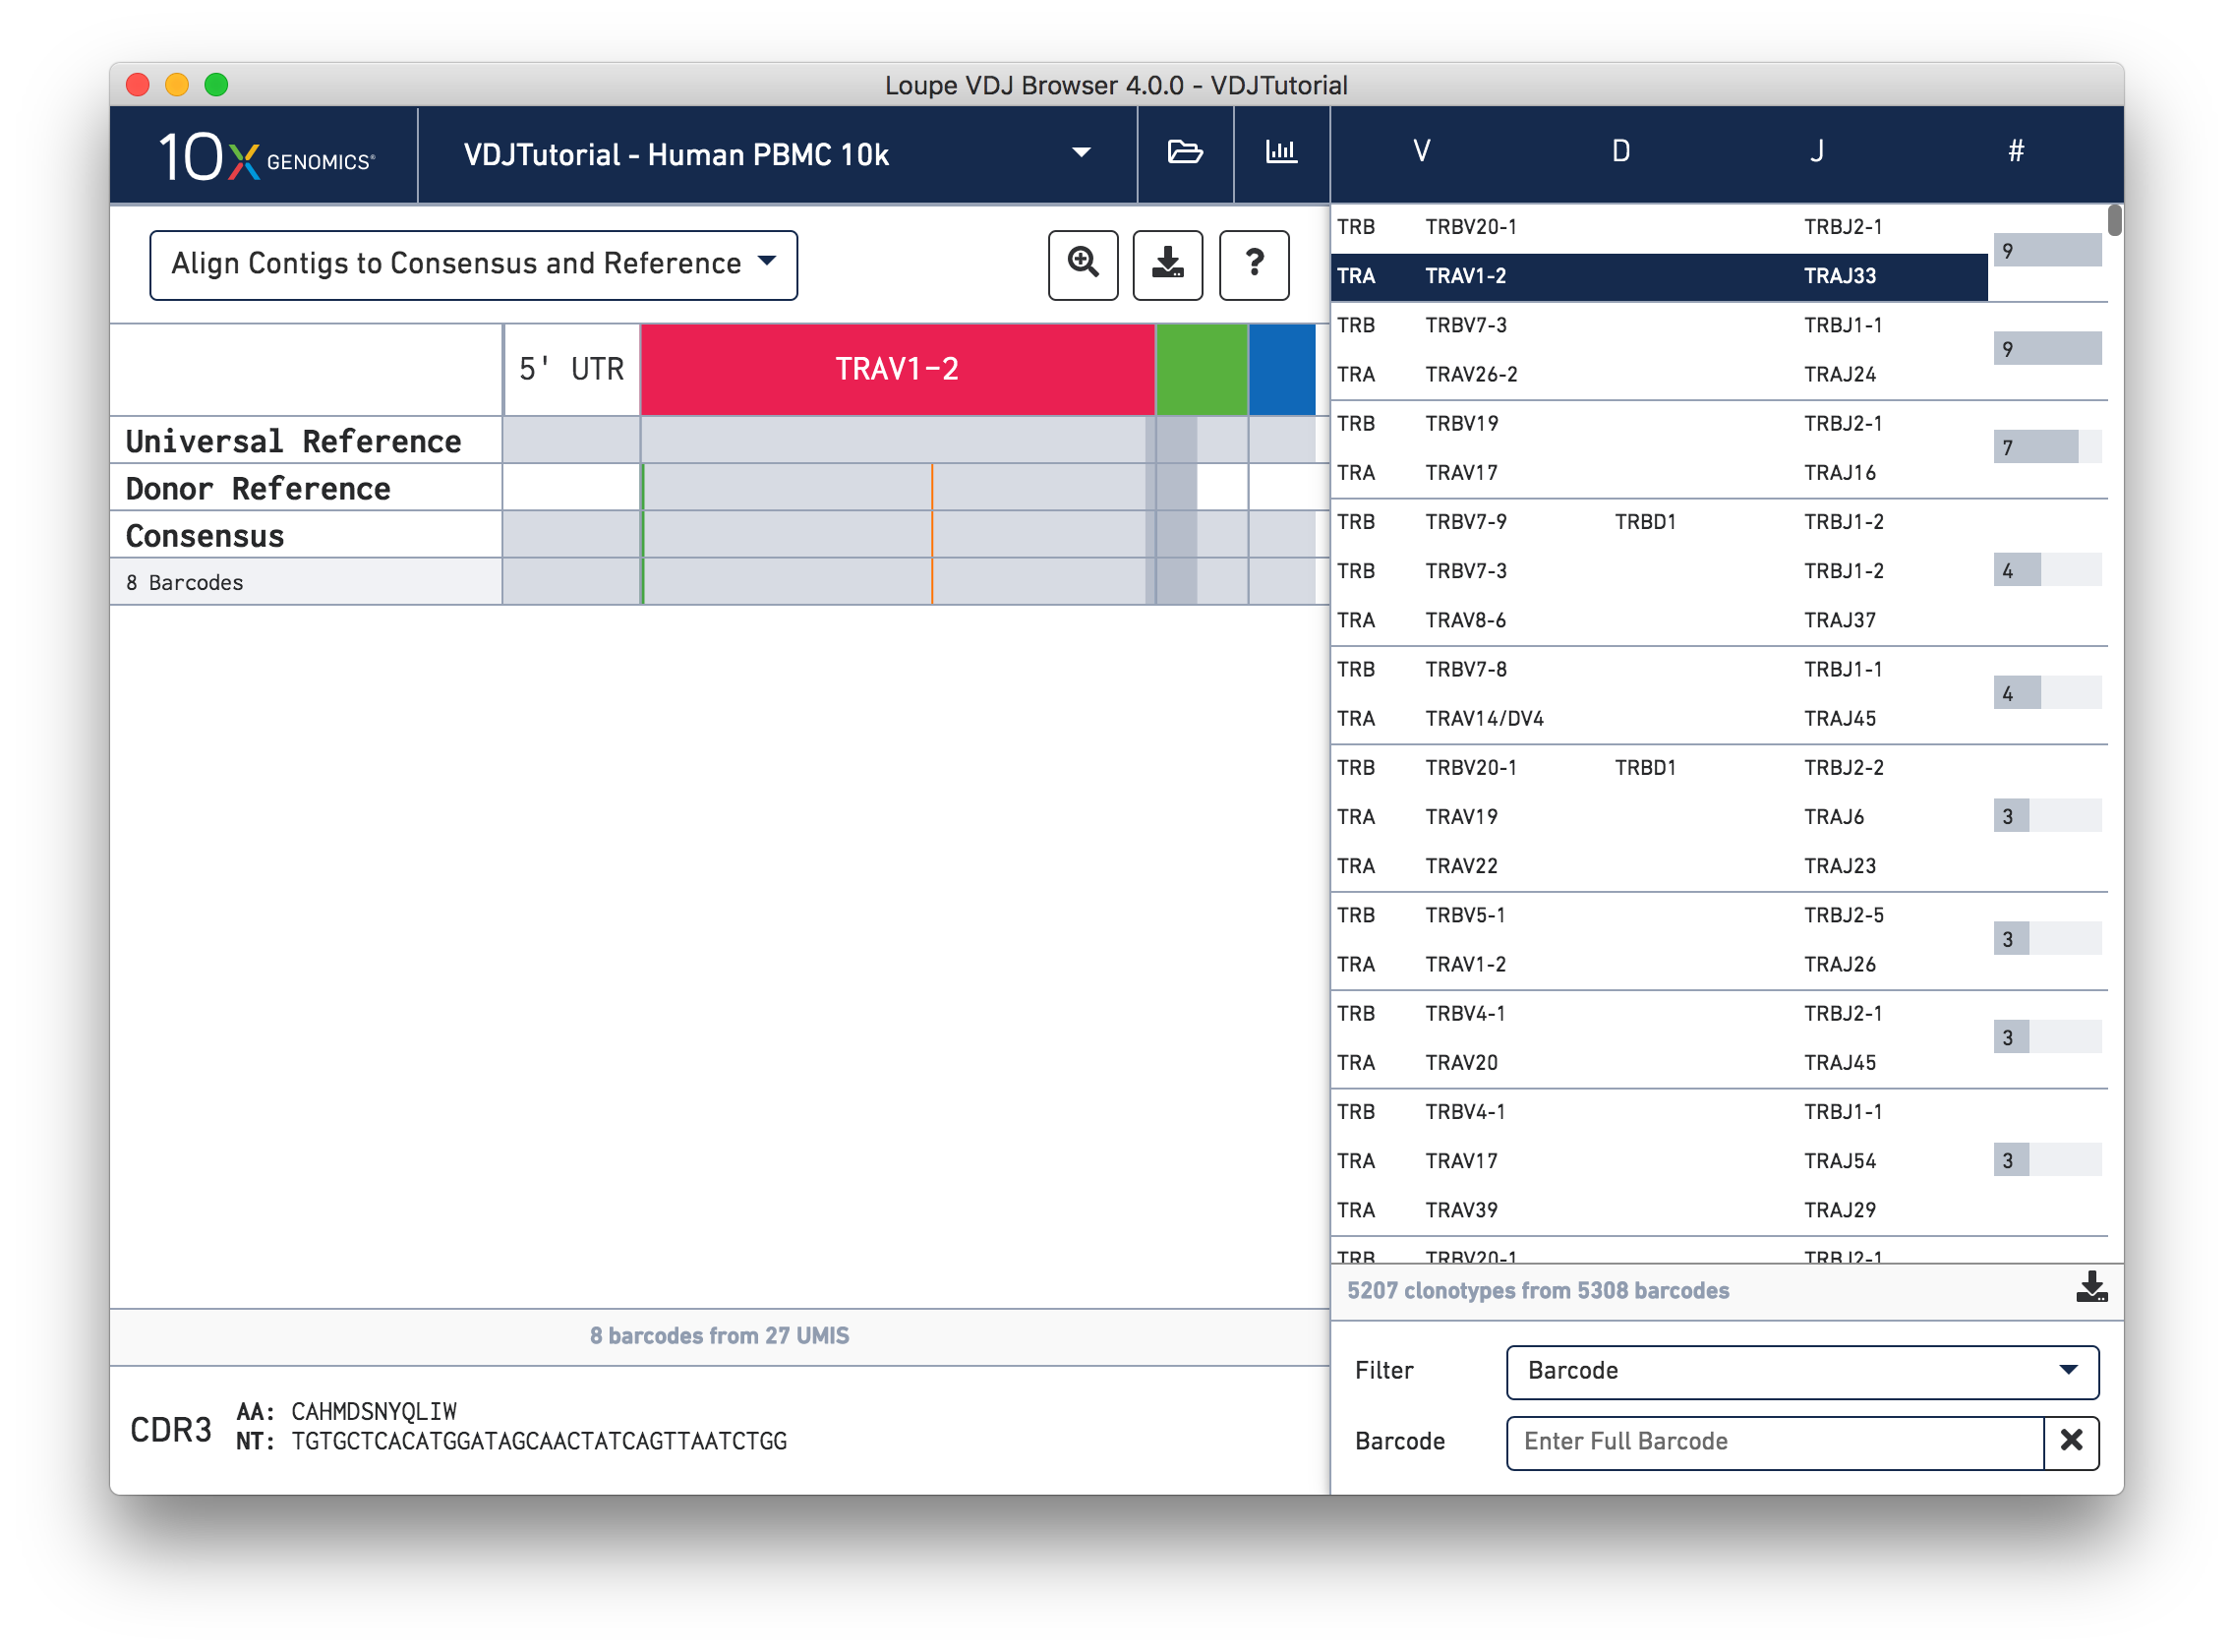
This chain only has a single exact subclonotype with eight barcodes. The single barcode exact subclonotype is missing here because that cell barcode had a TRB chain but was missing the TRA. The number of barcodes represented in the table might not add up to the barcode count for the clonotype in the clonotype list, but the count just above the CDR3 sequences indicates how many barcodes in this clonotype had the chain currently in the view.
The single (orange) mismatch in the middle of the TRAV1-2 annotation immediately stands out. Click on it to zoom in to the sequence level view and find out. After zooming in, the feature colors remain the same; orange still signifies mismatches. It looks like a single vertical row of bases are marked as mismatches. The reference base at this location is a T while our assembled contigs as well as the consensus at this location show an C. This SNP is listed in dbSNP.
In this sequence level view, you can scroll side to side to view more of the sequence. Since the sequences are long, it's easy to get lost scrolling side to side. The Jump button atop the gene annotations allows you to instantly navigate to the beginning of gene segments.
There are some additional helpful features of the single chain view we've not explored yet.
At the bottom of the Chain View, you can see the CDR3 for the chain in both amino acid and nucleotide sequences. The CDR3 shown is always the CDR3 of the consensus, regardless of the contig alignment setting. Clicking on either sequence will copy it to your clipboard for further documentation or investigation.
In the top right of the Chain View panel you will see a download button. Clicking on it will allow you to download all the sequences in this view (reference, consensus, and contigs) to a FASTA file as either nucleotides or amino acids. This allows for easy downstream analysis using standard bioinformatics tools.
Hovering over the barcode labels of any of the contigs will pop up a dialog with extra data about the contig, including:
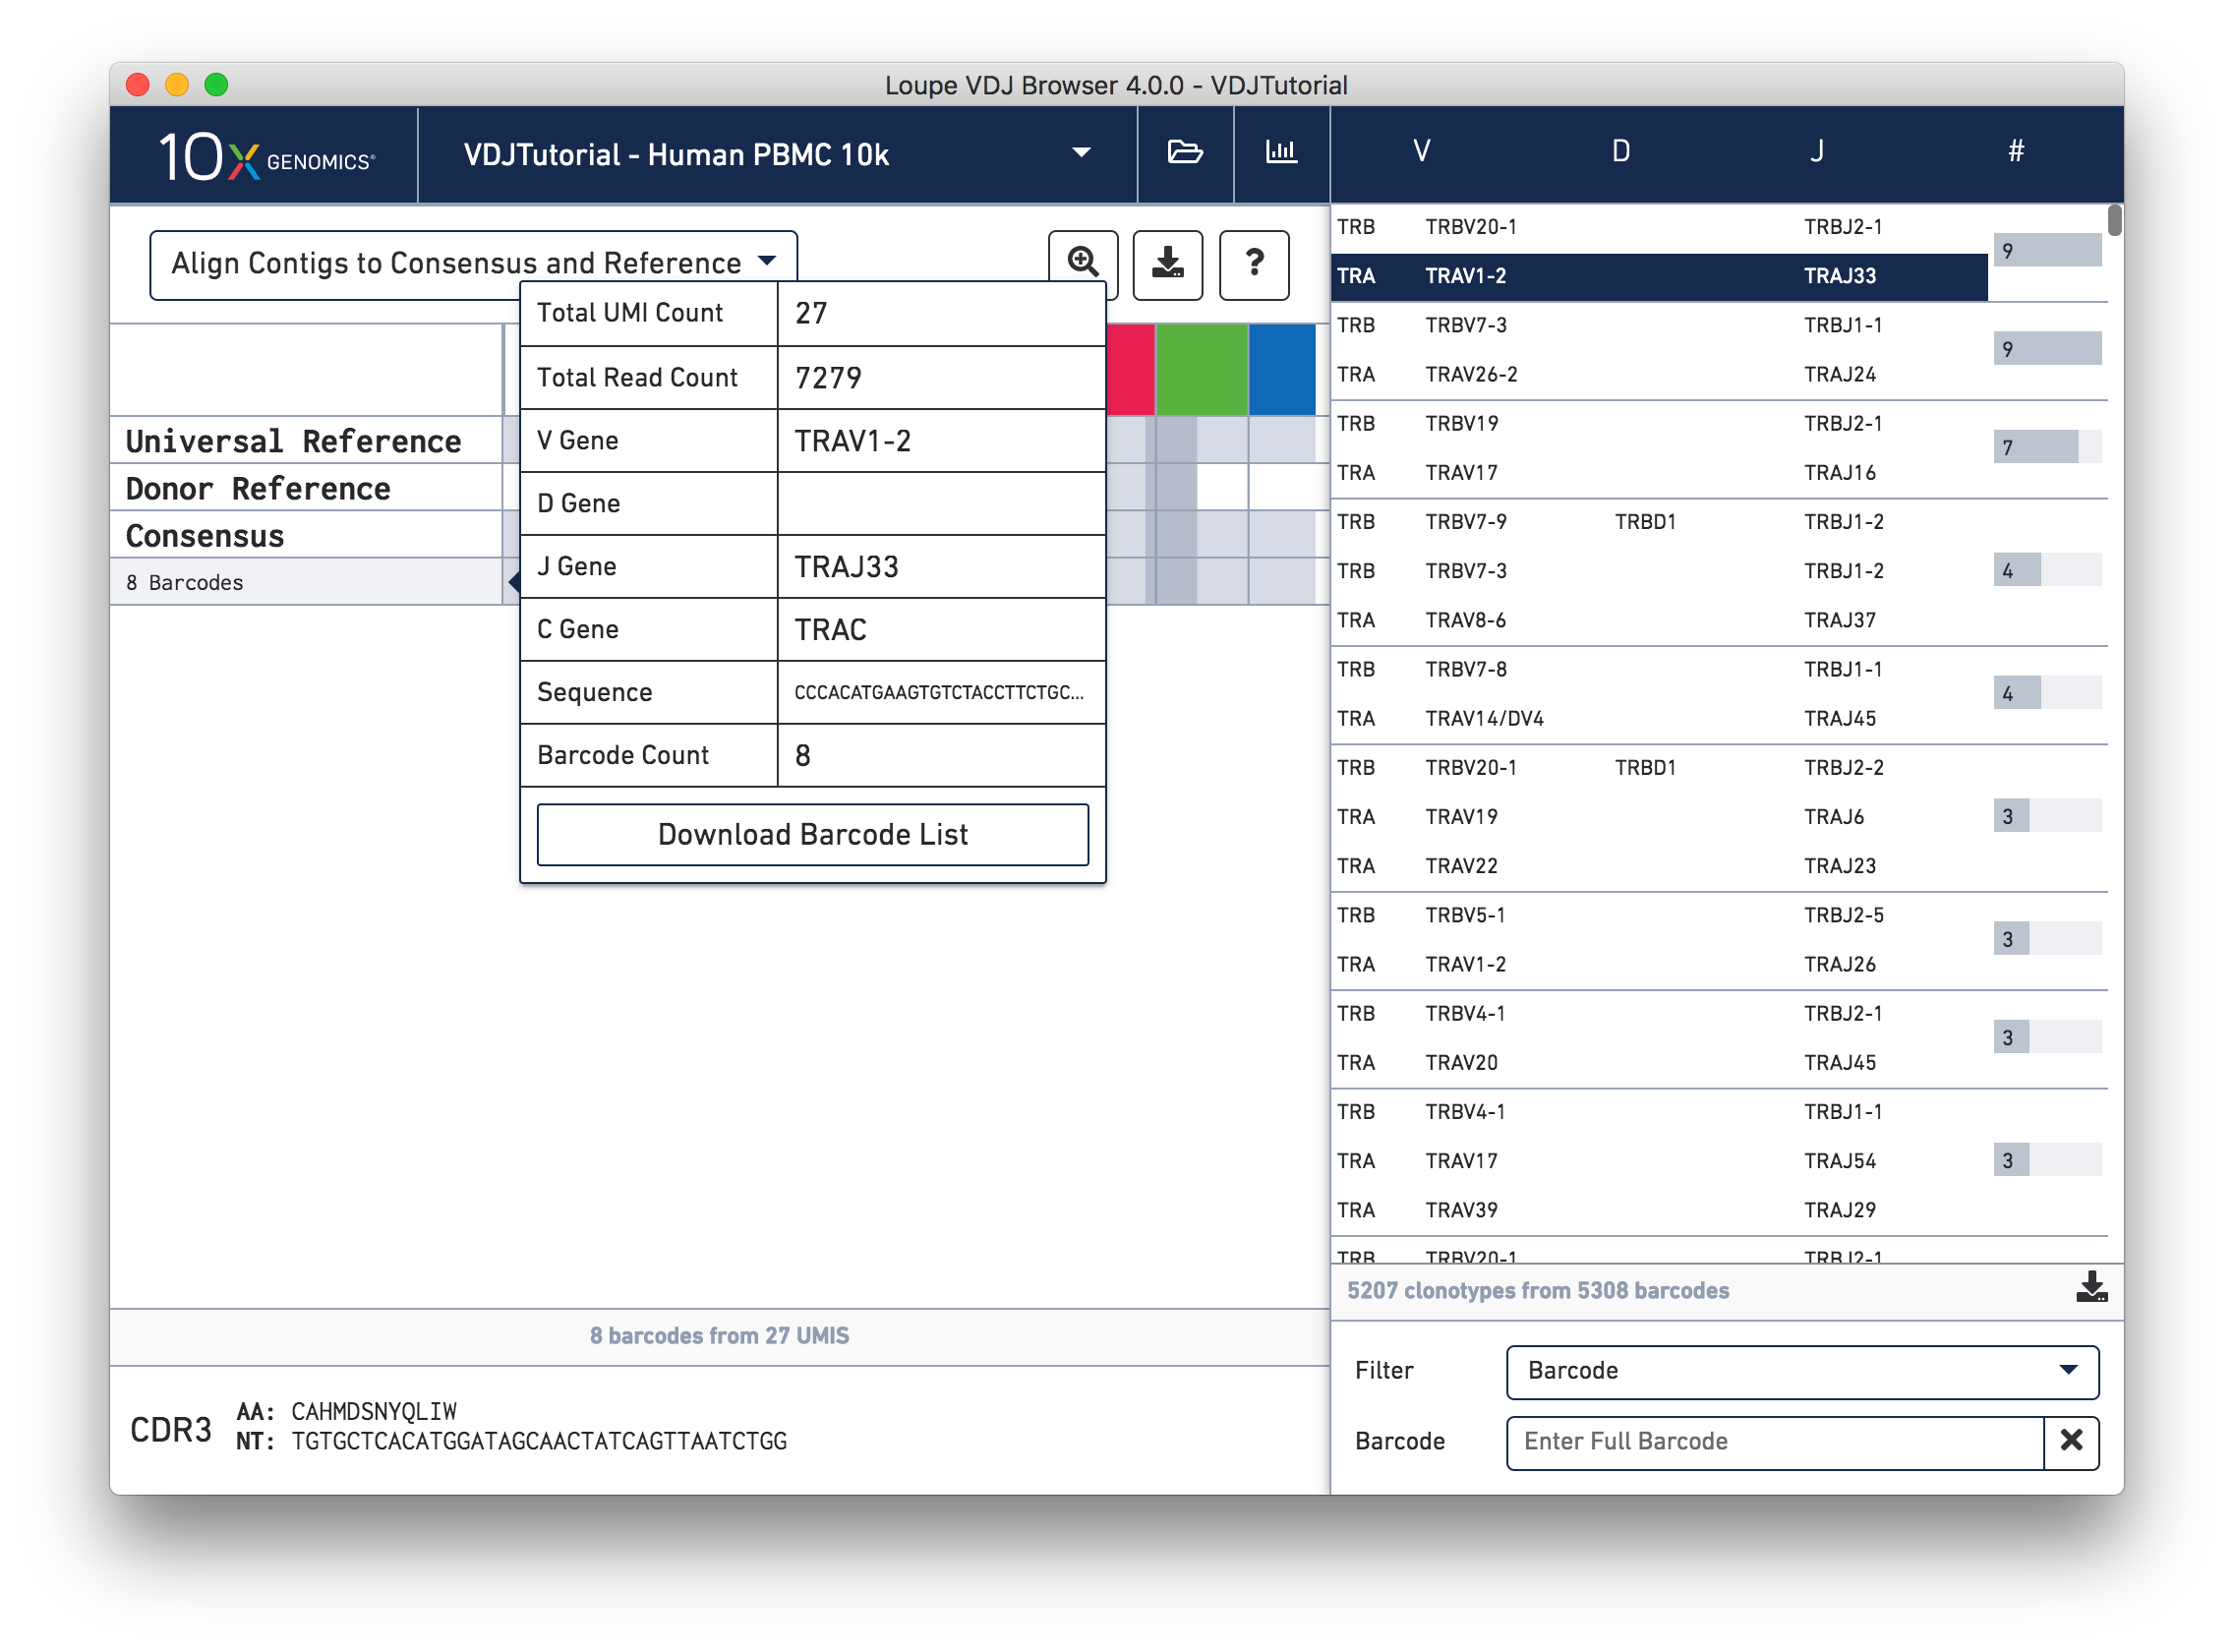
Clicking on any of these fields will copy them to your clipboard. It may be particularly useful to copy the contig sequence into the bioinformatics tools of your choice. Clicking the "Download Barcode List" button will create a CSV with the full list of barcodes in the current exact subclonotype.