Cell Ranger7.1, printed on 03/29/2025
To reduce sequencing and library preparation costs, Antibody Capture libraries without any gene expression data can be analyzed with Feature Barcode Only mode in cellranger count (Cell Ranger v3.1+).
To use cellranger in Feature Barcode Only mode, follow instructions for Feature Barcode Analysis, and omit Gene Expression entries from the Libraries CSV file. Results from Feature Barcode Only mode analysis can be used with cellranger aggr, with the requirement that all aggregated runs must share a common feature reference.
Cell Ranger performs the normal Feature Barcode quantification analysis in Feature Barcode Only mode, but uses a simplified version of the cell calling algorithm. The EmptyDrops step that refines cell calls is not performed. See the Cell Calling algorithm documentation for details.
|
We do not support:
|
| If fewer than 10 antibodies are used in the Feature Barcode Only mode, Cell Ranger will skip secondary analysis and will not output a .cloupe file. This restriction does not affect runs where Gene Expression libraries are present. |
A web_summary.html file summarizing the run is produced as usual. However, metrics displayed in the web summary in Feature Barcode Only mode do not precisely match results for Gene Expression + Feature Barcode analysis, since there are differences in the set of cells that are called in each mode. Click the question mark ? to read full descriptions for each section.
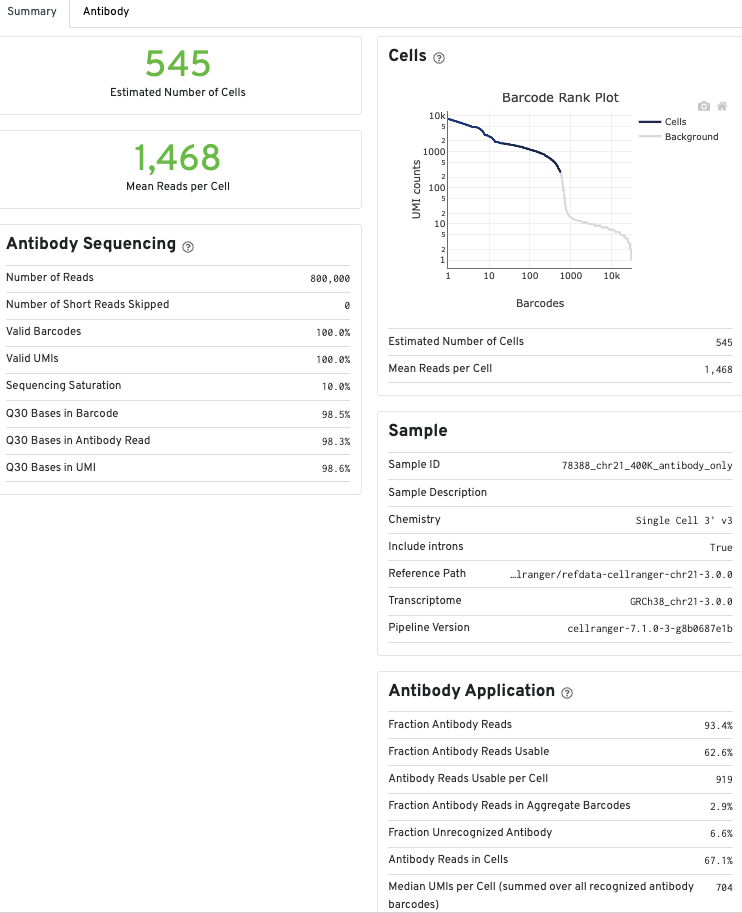
Metrics for Antibody libraries appear on the Summary tab under the Antibody Sequencing and Antibody Application sections. The Sequencing and Mapping sections, which display metrics from Gene Expression libraries, do not appear.
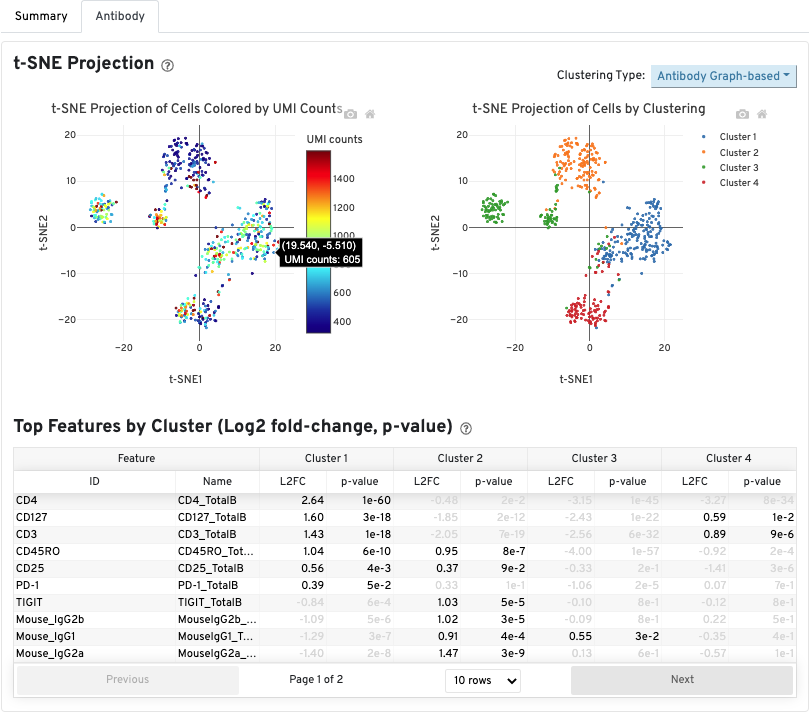
The Antibody tab will have t-SNE projection plots, a Top Features table, and a histogram of Antibody counts:
In Cell Ranger v7.1 and later, the Antibody tab includes a Distribution of Antibody Counts plot. This plot shows the relative composition of antibody counts for antibodies with at least one UMI. The box size is proportional to the fraction of total UMIs from cell barcodes derived from that antibody. Hovering over a box provides more information about the metrics displayed. In this example, the first blue box shows that at least one CD45RA antibody UMI was detected in 535 cells:
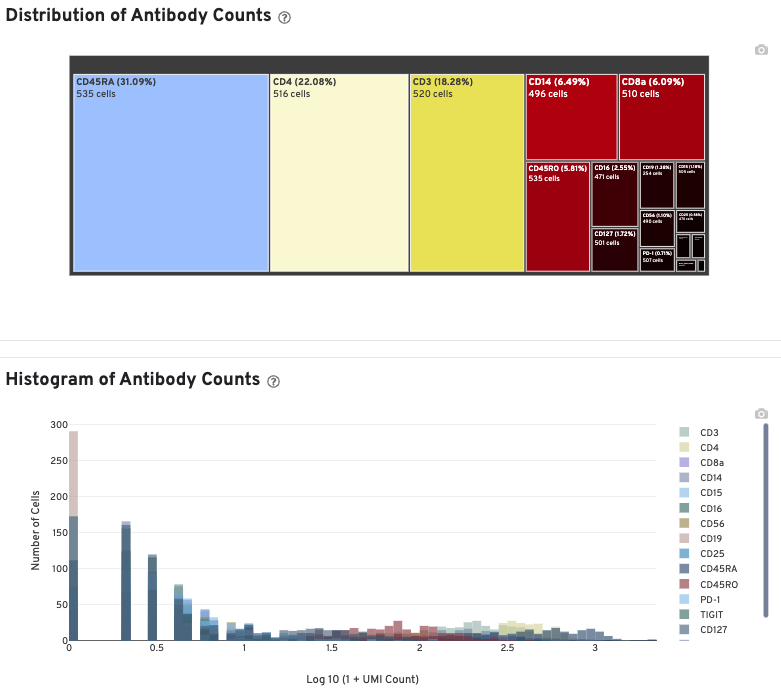
The Histogram of Antibody Counts shows the UMI counts in the log scale on the X-axis, and the number of cells on the Y-axis. Only antibodies with total UMI counts over 1,000 are plotted, and only up to the top 120 antibodies by UMI count are shown. To view this histogram for a specific subset of antibodies, select (or deselect) antibodies for display by clicking on the legend labels.
Shown below are results for a single sample with Gene Expression and Antibody Capture libraries. On the left, both libraries are processed together, and the barcode rank plot displays Gene Expression counts. On the right, only the Feature Barcode library is supplied to cellranger count, and the barcode rank plot displays the antibody counts.
Observe that a similar number of cells was called in each cellranger run, but the shape of barcode rank plot differs due to differences in the background levels of the Gene Expression and Antibody Capture libraries.
Gene Expression + Feature Barcode |
Feature Barcode Only |
| The choice of antibodies in the panel plays a significant role in the effectiveness of cell calling in Feature Barcode Only mode. |
Feature Barcode Only analysis only detects cells that are labelled by the Feature Barcode reagents in use. Cell types not well-stained by the panel have low total UMI counts and may not be called by the cell calling algorithm. The table below illustrates this effect by comparing the number of cells detected in the Gene Expression library and Antibody Capture library derived from the same cells. As the number of antibodies in the panel increases, the number of cells detected in the Feature Barcode Only analysis approaches the number detected in the gene expression analysis. Below are results for a series of TotalSeq-B antibody panels applied to human PBMCs.
| Description | Loaded Cells | GEX Called Cells | Ab Called Cells | Called In Both |
|---|---|---|---|---|
| TotalSeq-B 4 Antibodies | 1000 | 705 | 562 | 533 (75.6%) |
| TotalSeq-B 5 Antibodies | 1000 | 749 | 653 | 626 (83.6%) |
| TotalSeq-B 14 Antibodies | 5000 | 4233 | 4389 | 3977 (93.9%) |
| TotalSeq-B 31 Antibodies | 5000 | 4616 | 4488 | 4540 (97.2%) |