Space Ranger, printed on 10/22/2024
Loupe Browser 4.1 builds on spatial gene expression functionality introduced in the
4.0 release, supports new data types generated by Space Ranger 1.1, and offers
new ways of concurrently looking at multiple data views. In addition, it offers
some general user interface improvements and visualizations for spatial, gene
expression, and ATAC data. It is compatible with .cloupe files generated by all
versions of Space Ranger, and all versions of Cell Ranger after v1.3.
As of mid-2020, Visium now supports immunofluorescent stain protocols, and both Space Ranger 1.1 and Loupe Browser 4.1 support processing and visualization of immunofluorescent data.
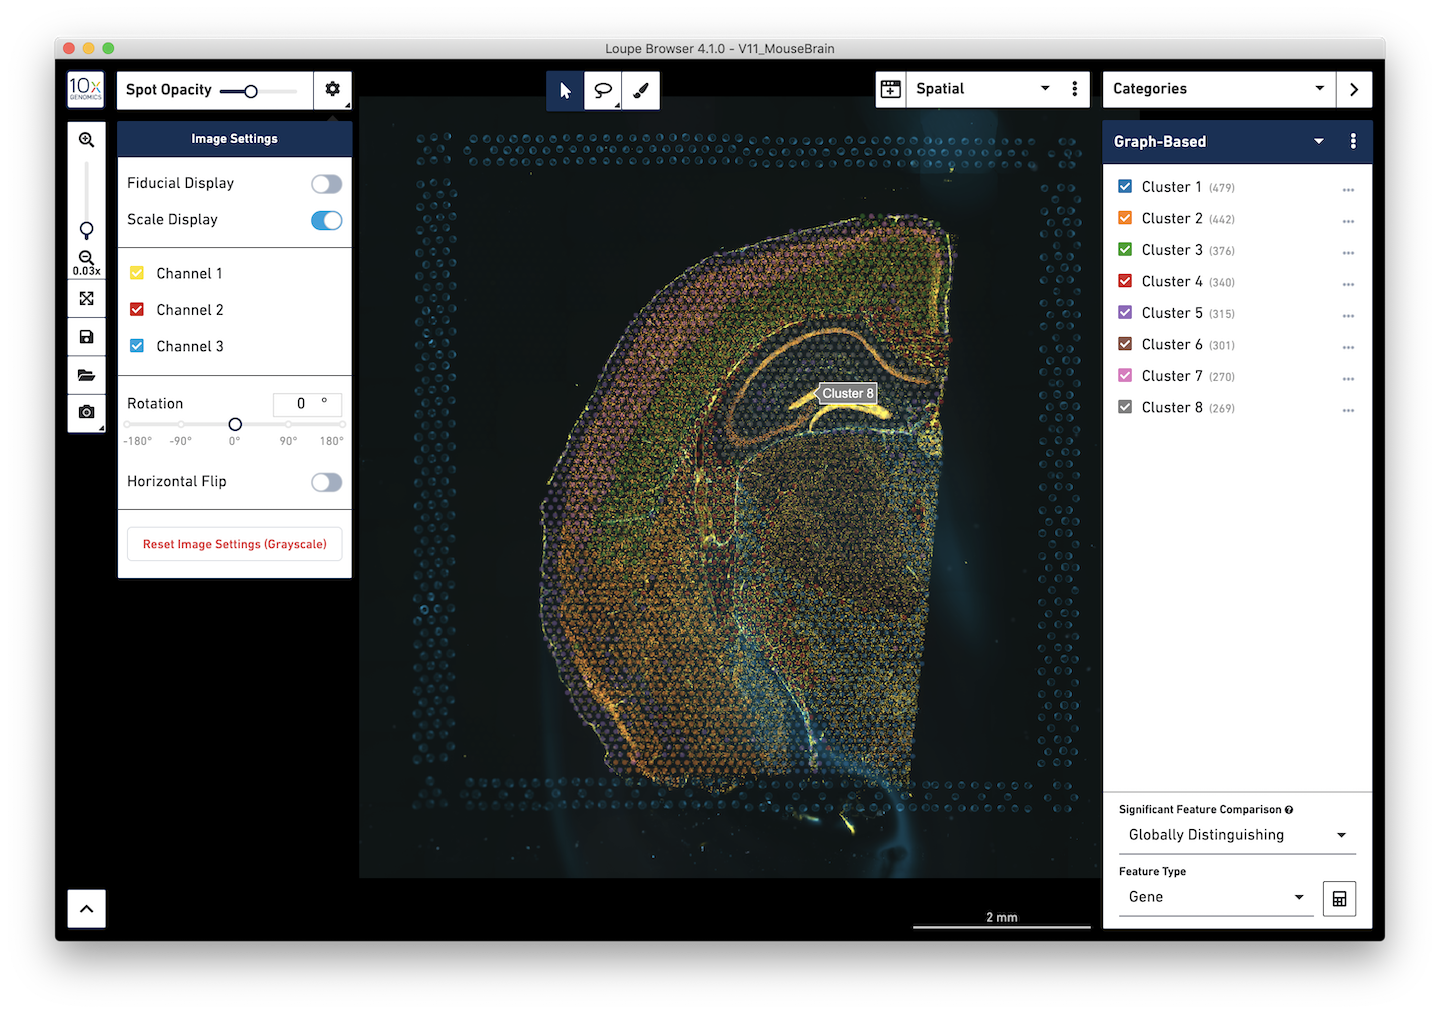
In particular, Loupe Browser 4.1 supports the visualization of multiple image channels per dataset. Multi-channel image settings can be changed by pressing on the icon next to the Spot Opacity slider. It is possible to change colors, brightness, contrast, and opacity of individual channels. It is also possible to rename individual channels after the name or target of each individual stain.
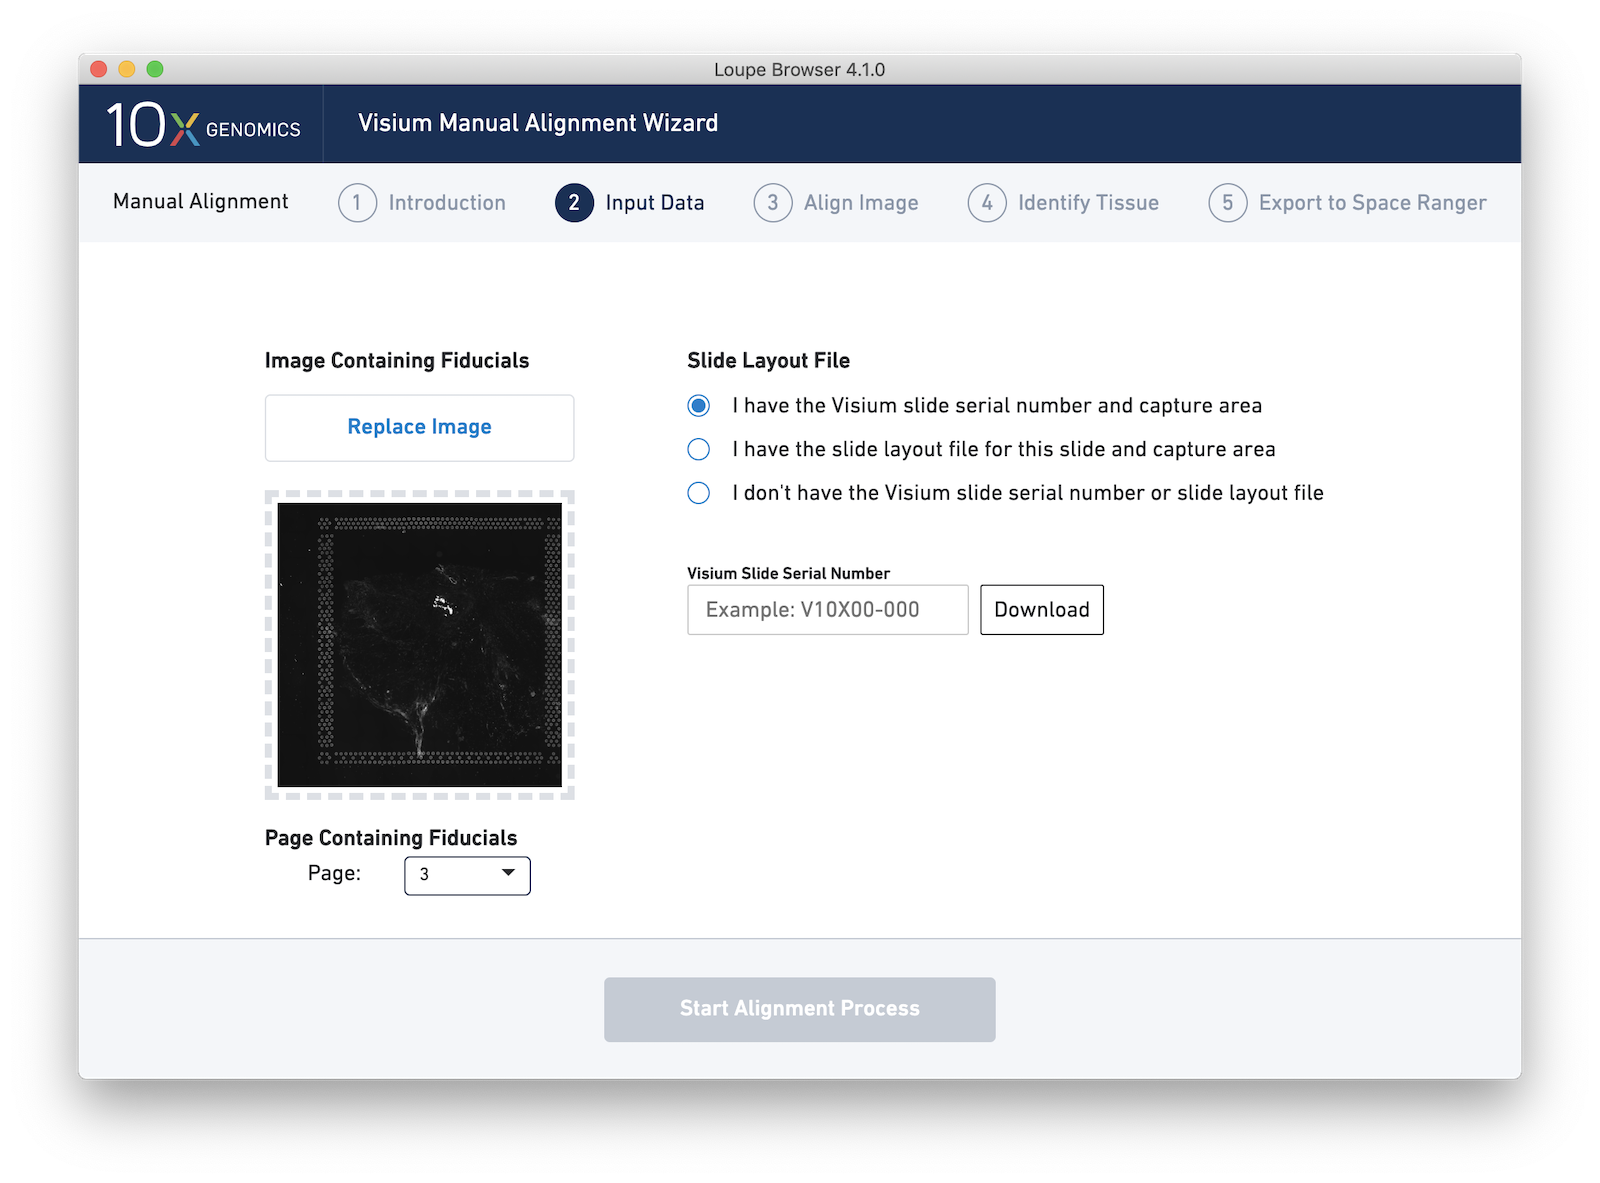
Unlike brightfield/H&E images, automatic detection of fiducials and tissue from immunofluorescent images is not currently supported by Space Ranger. As a result, it is critically important to correctly align an image with Loupe Browser's Visium manual aligner tool. Fortunately, Loupe Browser 4.1 adds functionality intended to make fluorescent image alignment easier:
Loupe Browser 4.1 introduces the concept of linked windows, windows that provide concurrent views of the same dataset.
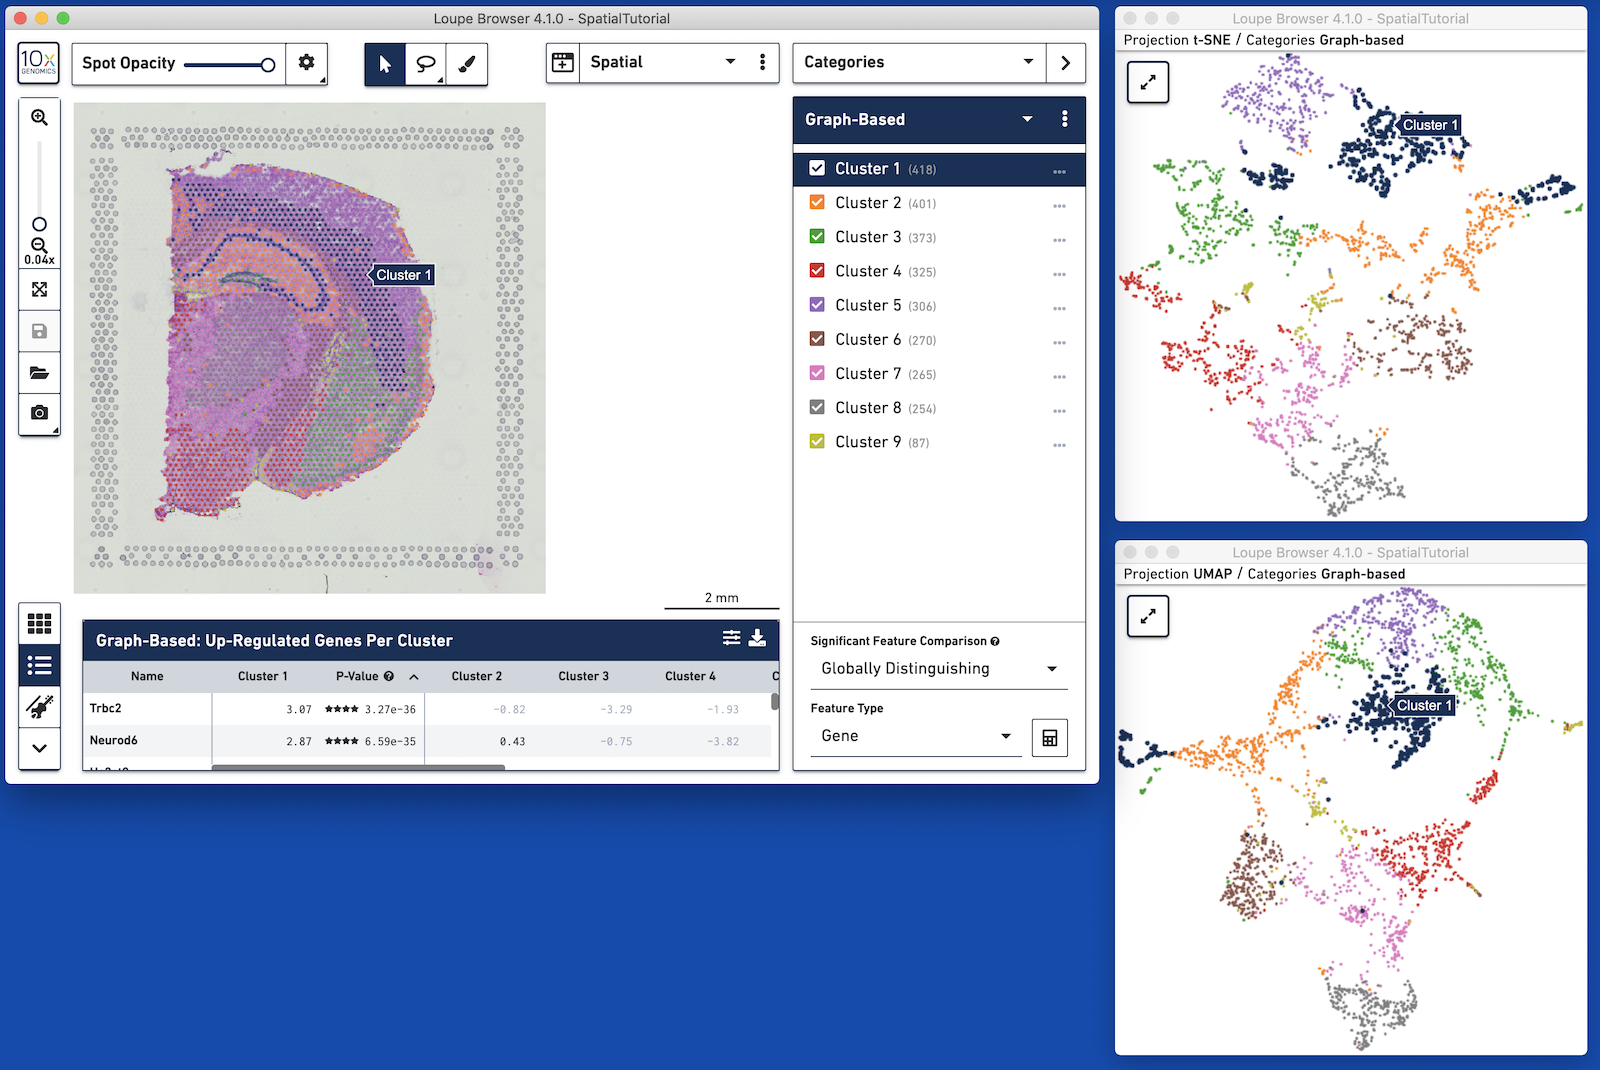
For example, with datasets generated with Cell Ranger 3.0 and Space Ranger, it is possible to view t-SNE, UMAP, spatial, custom projections, and feature barcode-derived projections concurrently. Operations in one window, such as switching categories or displaying the expression of a particular gene, propagate to the other windows. Pan and zoom remain independent between windows.
A linked window can be opened by clicking on the window icon on the left side of the view selector. This brings up a list of available projections. Selecting a projection launchs a window in mini-mode, with a subset of interface options available. A mini-mode window can be expanded by clicking on the expand icon at upper-left, which replaces the 10x icon. Multiple full windows for the same dataset make concurrent display of a variety of information much easier.
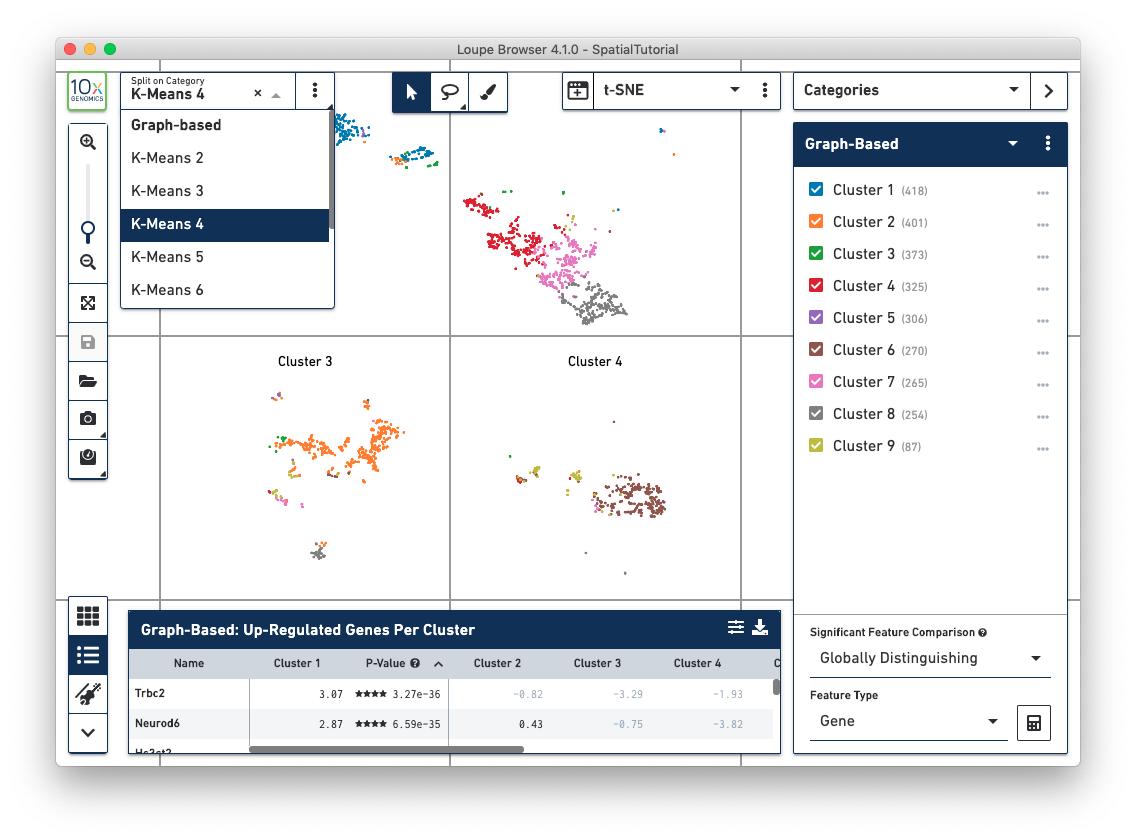
In t-SNE and UMAP views, the Split View selector has moved from the toolbar to the upper left of the window. This allows more rapid organization of these projections by cluster.
The rectangular and polygonal selection tools at the top of the window have been combined into a single button, which is toggleable. A draw selection tool has been added to the right of the selection buttons, which allows for more precise selection of cells or spots, particularly in spatial views.
It is now possible in Loupe Browser 4.1 to view feature expression normalized by UMI count (for single-cell and spatial datasets) or cut site count (for ATAC datasets). This is activated by selecting LogNorm as the scale in Feature Expression view, instead of Log2 (the default).
The log-normalization method is the same as methods used in Seurat and scanpy, with
quantitative expression computed as follows:
LogNorm(feature, barcode) = ln(10000 * (feature count/barcode count) + 1)
where the barcode count is the total number of UMIs or cut sites associated with
the barcode. The relative expression ratio is multiplied by 10000 in order to shift
the relative expression distribution above the constant introduced by the log1p operation.
Log-normalization is important when viewing comparative expression across clusters, which is now viewable via Violin Plots. Violin plots can be opened by pressing the violin plot icon in the Data Panel selector.
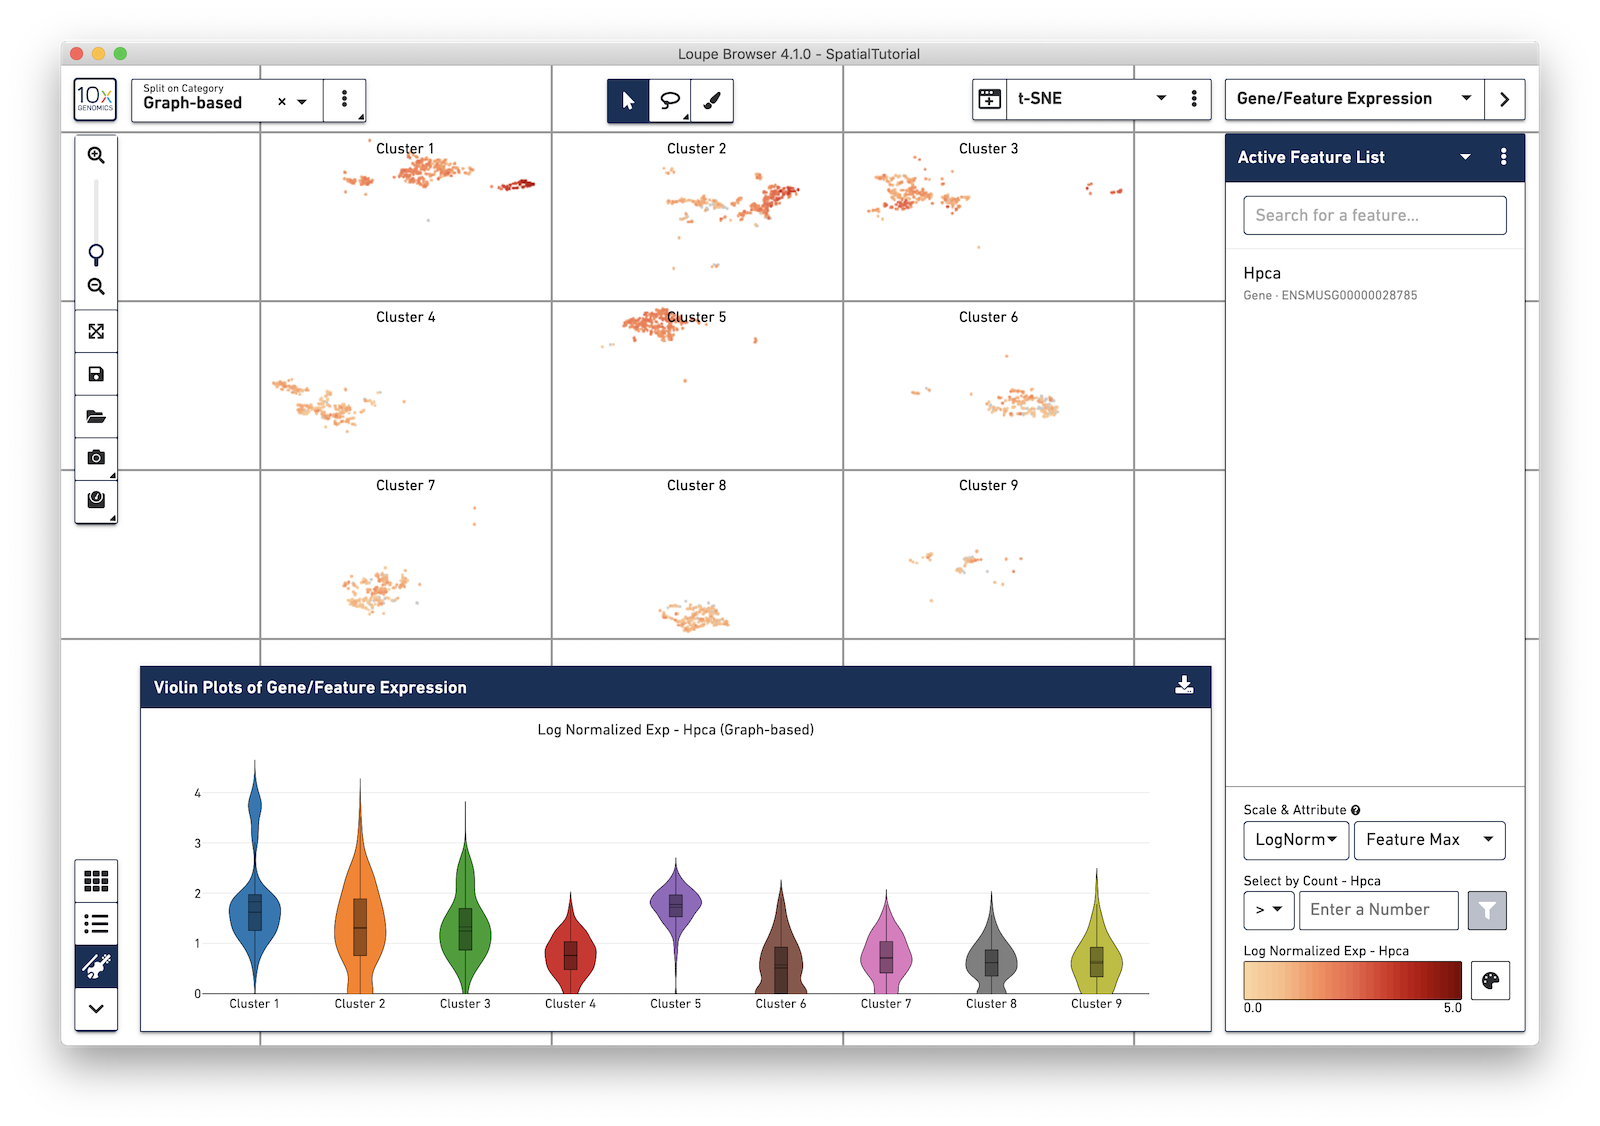
Violin plots show expression distributions of the currently active feature (or list of features), for the active category. Changes to either the active feature list or selected category are reflected in the Violin Plot. Hovering over each violin graph shows aggregate statistics of feature expression for that graph's cluster.
Violin plots are exportable to SVG or PNG formats. To save a Violin Plot, click on the Export icon and select Export Plot as PNG or Export Plot as SVG.
Space Ranger 1.1 now features an aggr mode, which can be used to generate spatial datasets with multiple tissue slices. Such datasets must be opened with Loupe Browser 4.1. Loupe Browser 4.1's enhancements, particularly linked windows, facilitate navigation of multi-layer, multi-tissue datasets.