Space Ranger2.0, printed on 03/26/2025
A full length cDNA construct is flanked by the 30 bp template switch oligo (TSO) sequence, AAGCAGTGGTATCAACGCAGAGTACATGGG, on the 5' end and poly-A on the 3' end. Some fraction of sequencing reads are expected to contain either or both of these sequences, depending on the fragment size distribution of the sequencing library. Reads derived from short RNA molecules are more likely to contain either or both TSO and poly-A sequence than longer RNA molecules.
Since the presence of non-template sequence in the form of either template switch oligo (TSO) or poly-A, low-complexity ends confound read mapping, TSO sequence is trimmed from the 5' end of read 2 and poly-A is trimmed from the 3' end prior to alignment. Trimming improves the sensitivity of the assay as well as the computational efficiency of the software pipeline.
Tags ts:i and pa:i in the output BAM files indicate the number of TSO nucleotides trimmed from the 5' end of read 2 and the number of poly-A nucleotides trimmed from the 3' end. The trimmed bases are present in the sequence of the BAM record, and the CIGAR string shows the position of these soft-clipped sequences.
For fresh-frozen tissues Space Ranger uses STAR to perform splicing-aware alignment of transcript reads to the genome. This is the default algorithm unless the --probe-set option is invoked for FFPE tissues, see below. After alignment, Space Ranger uses the transcript annotation GTF file to count each read as either exonic, intronic, or intergenic. Space Ranger counts a read as exonic if at least 50% of it intersects an exon, and as intronic if > 50% of its bases map to a gene but not to one of that gene’s exons. Otherwise, the read is counted as intergenic.
For reads that align to a single exonic locus, but also align to one or more non-exonic loci, the exonic locus is prioritized and the read is considered to be confidently mapped to the exonic locus with mapping quality (MAPQ) of 255. All uniquely mapping reads have a MAPQ of 255. For multi-mapping reads, the MAPQ score is defined as MAPQ=int(−10∗log10(1−1Nmap))
where Nmap is the number of loci a read can map to. BAM tag NH:i gives the value of Nmap which is 1 for uniquely mapped reads and > 1 for multi mapped reads.
Space Ranger further aligns exonic reads to annotated transcripts, looking for compatibility. A read that has bases 100% compatible with the exons of an annotated transcript, and aligned to the same strand, is considered mapped to the transcriptome. Space Ranger ignores antisense reads that are defined as any read with alignments to an entire gene on the opposite strand and no sense alignments. If the read is compatible with a single gene annotation, it is considered uniquely (confidently) mapped to the transcriptome. These confidently mapped reads are the only ones considered for UMI counting.
In the web_summary.html, the set of reads carried forward to UMI counting is referred to as "Reads mapped confidently to transcriptome". |
Space Ranger 1.3 introduces support for formalin fixed paraffin embedded (FFPE) tissues. During the FFPE workflow, whole transcriptome probe panels, consisting of a pair of probes for each targeted gene, are added to the tissue. These probe pairs hybridize to their target transcript and are then ligated together.
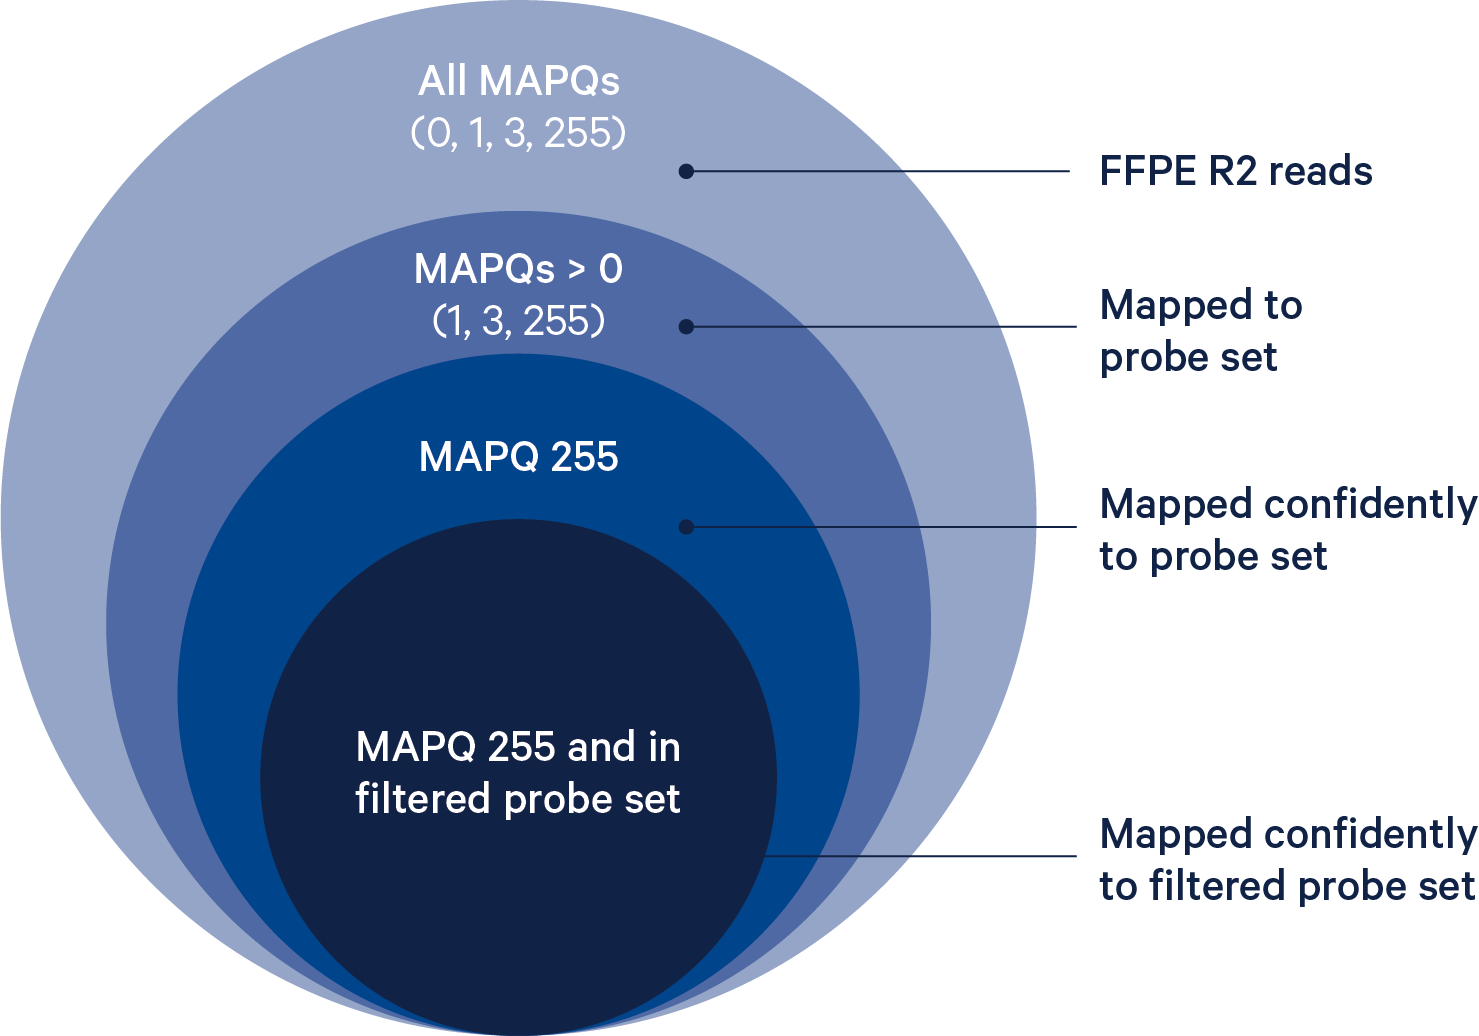
To analyze FFPE data it is necessary to use the --probe-set option to specify a probe set reference CSV file. When this option is invoked, Space Ranger will count ligation events using the probe aligner algorithm. Reads are also aligned to the reference transcriptome using STAR, but only to determine their alignment positions and CIGAR strings; STAR alignments are not used to assign reads to genes for FFPE data. Sequencing reads are aligned to the probe set reference and assigned to the genes they target. The probe alignment algorithm is similar to a seed-and-extend aligner, where each half of the read is a seed, and is described in detail below.
The BAM tag pr:Z reports a semicolon-separated list of probe IDs. See BAM Alignment Tags for a detailed description.
The probe reference is filtered to remove genes/features where one or more of the probes targeting this feature might hybridize and ligate at non-targeted loci. Probes that are predicted to have off-target activity to homologous genes or sequences are excluded from analysis by default. These probes are marked with FALSE in the included column of the probe set reference CSV. Any gene that has at least one probe with predicted off-target activity will be excluded from filtered outputs. Setting the --filter-probes=true command line argument of spaceranger count will result in UMI counts from all non-deprecated probes, including those with predicted off-target activity, to be used in the analysis. Probes whose ID is prefixed with DEPRECATED are always excluded from the analysis.
To determine whether barcode sequence is correct, Space Ranger compares 10x Barcodes to the known barcodes for a given assay chemistry, which are stored in a barcode whitelist file. For example, there are 4992 barcodes in the whitelist for Visium slides with 6.5 mm Capture Area and 14336 barcodes for Visium slides with 11 mm Capture Area.
Space Ranger uses the following algorithm to correct putative barcode sequences against the whitelist:
In the output BAM file, the original uncorrected barcode is encoded in the CR tag, and the corrected barcode sequence is encoded in the CB tag. Reads that cannot be assigned a corrected barcode will not have a CB tag.
Before counting UMIs, Space Ranger attempts to correct for sequencing errors in the UMI sequences. Reads that were confidently mapped to the transcriptome are placed into groups that share the same barcode, UMI, and gene annotation. If two groups of reads have the same barcode and gene, but their UMIs differ by a single base (i.e., are Hamming distance 1 apart), then one of the UMIs was likely introduced by a substitution error in sequencing. In this case, the UMI of the less-supported read group is corrected to the UMI with higher support.
Space Ranger again groups the reads by barcode, UMI (possibly corrected), and gene annotation. If two or more groups of reads have the same barcode and UMI, but different gene annotations, the gene annotation with the most supporting reads is kept for UMI counting, and the other read groups are discarded. In case of a tie for maximal read support, all read groups are discarded, as the gene cannot be confidently assigned.
After these two filtering steps, each observed barcode, UMI, gene/feature combination is recorded as a UMI count in the unfiltered feature-barcode matrix. The number of reads supporting each counted UMI is also recorded in the molecule info file.
Space Ranger detects spots under the tissue section in the Imaging subpipeline. Only the barcodes associated to these under tissue spots are captured in the Filtered feature-barcode matrix and are used for downstream analyses.
Space Ranger uses the feature barcode matrix and the spatial location data from the image to generate secondary analysis results including clusters, t-SNE and UMAP projections as well as differential gene expression between the clusters. All of the secondary data are recorded in the cloupe.cloupe file which can be visualized in Loupe Browser.
In order to reduce the gene expression matrix to its most important features, Space Ranger uses Principal Components Analysis (PCA) to change the dimensionality of the dataset from (spots x genes) to (spots x M) where M is 10. The pipeline uses a python implementation of IRLBA algorithm, (Baglama & Reichel, 2005), which is modified to reduce memory consumption.
For visualizing data in 2-d space, Space Ranger passes the PCA-reduced data into t-Stochastic Neighbor Embedding (t-SNE), a nonlinear dimensionality reduction method (Van der Maaten, 2014). The C++ reference implementation by Van der Maaten (2014) was modified to take a PRNG seed for determinism. The runtime is also decreased by fixing the number of output dimensions at compile time to two or three. The t-SNE is visualized in both web_summary.html and in Loupe Browser.
Space Ranger also supports Uniform Manifold Approximation and Projection (UMAP), which estimates a topology of the high dimensional data and uses this information to estimate a low dimensional embedding that preserves relationships between datapoints (McInnes & Healy, 2018). The pipeline uses the python implementation of this algorithm by McInnes & Healy (2018). UMAP coordinates are available in the pipeline output, but not displayed in the web_summary.html.
Space Ranger uses two different methods for clustering spots by expression similarity, both of which operate in the PCA representation.
The graph-based clustering algorithm consists of building a sparse nearest-neighbor graph (where spots are linked if they are among the k nearest Euclidean neighbors of one another), followed by Louvain Modularity Optimization (LMO; Blondel, Guillaume, Lambiotte, & Lefebvre, 2008), an algorithm which seeks to find highly-connected "modules" in the graph. The value of k, the number of nearest neighbors, is set to scale logarithmically with the number of spots. An additional cluster-merging step is done: Perform hierarchical clustering on the cluster-medoids in PCA space and merge pairs of sibling clusters if there are no genes differentially expressed between them (with B-H adjusted p-value below 0.05). The hierarchical clustering and merging is repeated until there are no more cluster-pairs to merge.
The use of LMO to cluster spots was inspired by a similar method in the R package Seurat.
Space Ranger also performs traditional K-means clustering across a range of K values, where K is the preset number of clusters.
In order to identify genes whose expression is specific to each cluster, Space Ranger tests, for each gene and each cluster, whether the in-cluster mean differs from the out-of-cluster mean.
In order to find differentially expressed genes between groups of spots, Space Ranger uses the quick and simple method sSeq (Yu, Huber, & Vitek, 2013), which employs a negative binomial exact test. When the counts become large, Space Ranger switches to the fast asymptotic beta test used in edgeR (Robinson & Smyth, 2007). For each cluster, the algorithm is run on that cluster versus all other spots, yielding a list of genes that are differentially expressed in that cluster relative to the rest of the sample.
Space Ranger's implementation differs slightly from that in the paper. In the sSeq paper, the authors recommend using DESeq's geometric mean-based definition of library size (Love, Huber & Anders, 2014). Space Ranger instead computes relative library size as the total UMI counts for each spot divided by the median UMI counts per spot. As with sSeq, normalization is implicit in that the per-spot library-size parameter is incorporated as a factor in the exact-test probability calculations.
Space Ranger quantifies spatial enrichment, measured by Moran's I, as a discovery tool that can be useful to identify features that have distinct patterns of expression (spatial autocorrelation). Moran’s I is not related to differential expression as it is independent from any clustering information. Features with similar Moran's I do not necessarily have similar spatial expression patterns although methods do exist for identifying groups of genes with similar spatial enrichment patterns. The Moran's I metric scale ranges from -1 (perfectly dispersed) to 1 (perfectly enriched).
Baglama, J. & Reichel, L., Augmented Implicitly Restarted Lanczos Bidiagonalization Methods. SIAM Journal on Scientific Computing 27, 19–42 (2005).
Blondel, V. D., Guillaume, J.-L., Lambiotte, R. & Lefebvre, E. Fast unfolding of communities in large networks. Journal of Statistical Mechanics: Theory and Experiment 2008, (2008).
Love, M. L., Huber, W. & Anders, S., Moderated estimation of fold change and dispersion for RNA-seq data with DESeq2. Genome Biology 15, number 550 (2014).
McInnes, L, Healy, J, UMAP: Uniform Manifold Approximation and Projection for Dimension Reduction. arXiv (2018).
Robinson, M. D. & Smyth, G. K. Small-sample estimation of negative binomial dispersion, with applications to SAGE data. Biostatistics 9, 321–332 (2007).
Van der Maaten, L., Accelerating t-SNE using Tree-Based Algorithms. Journal of Machine Learning Research 15, 3221-3245 (2014).
Yu, D., Huber, W. & Vitek, O., Shrinkage estimation of dispersion in Negative Binomial models for RNA-seq experiments with small sample size. Bioinformatics 29, 1275–1282 (2013).