Space Ranger2.0, printed on 03/23/2025
Here we describe the files in the outs folder of a targeted-compare run, which are generated using the spaceranger targeted-compare command to directly compare results from a Targeted Gene Expression dataset and its corresponding parent Whole Transcriptome Analysis (WTA) dataset.
web_summary.html)metrics_summary.csv)barcode_summary.csv)feature_summary.csv)| After June 30, 2023, new Space Ranger releases will no longer support Targeted Gene Expression analysis. |
web_summary.html)The targeted-compare pipeline outputs a summary HTML called web_summary.html that contains summary metrics and comparative analysis results.
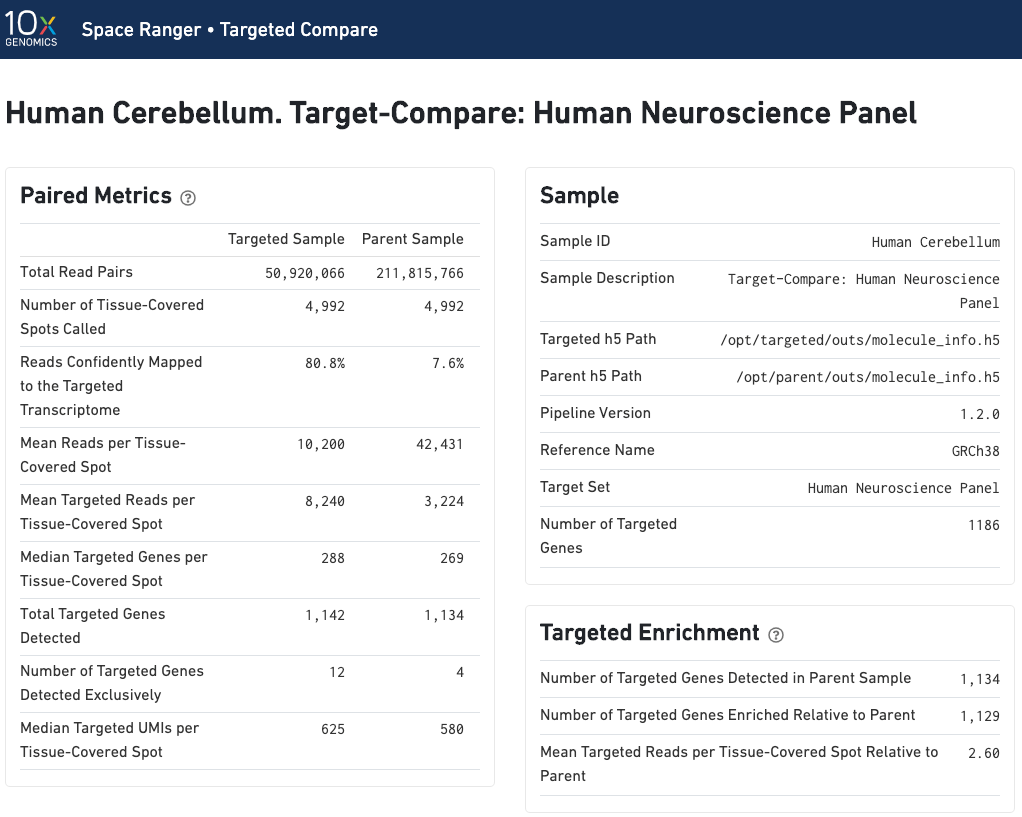
Paired summary metrics and sample information provide an overview of the parent and targeted samples. The Targeted Enrichment table is related to the Per-Gene Read Enrichment dashboard (see below).
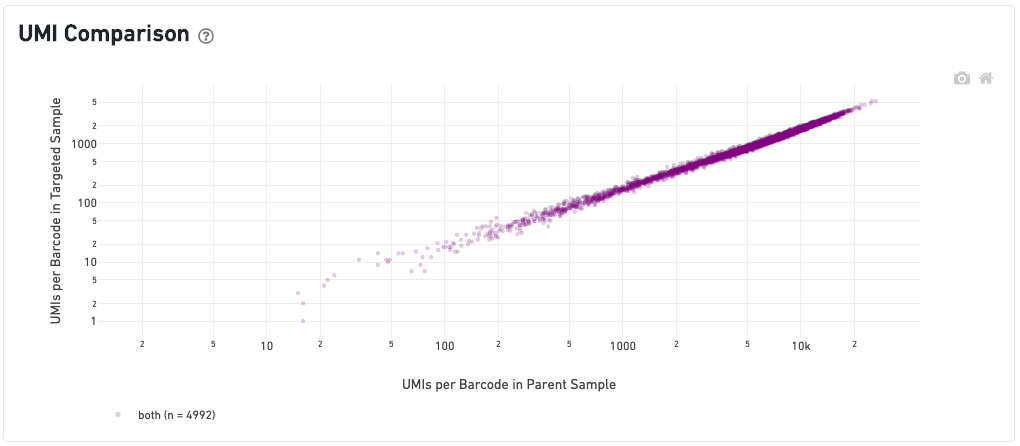
Under the UMI Comparison dashboard, the scatterplot in the middle shows the correlation of UMI counts per barcode between the two samples. Barcodes called as tissue-covered spots in both samples (colored in purple) should be well-correlated. Note that using the same image, or image + alignment file, in the targeted sample and parent sample is the preferable approach in a target and compare run and caution should be taken if these inputs diverge.
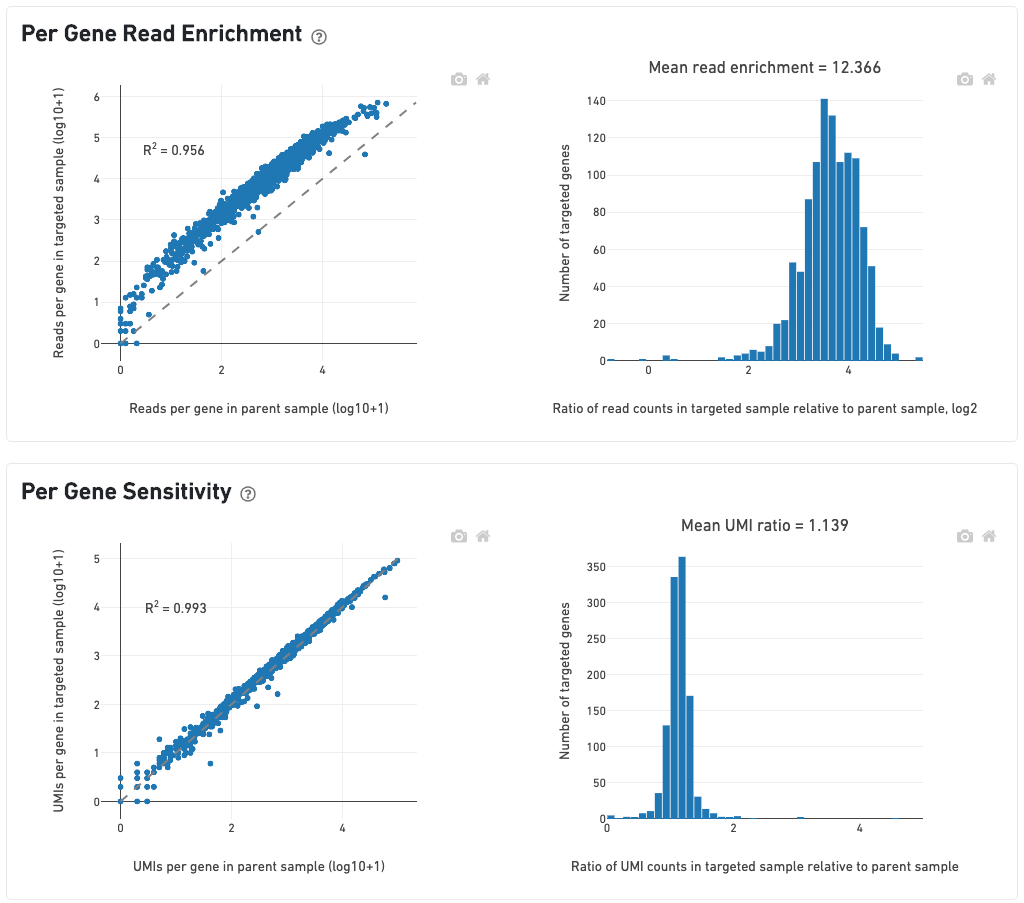
The scatterplot on the left of the Per-Gene Read Enrichment dashboard shows the read counts per targeted gene in the targeted and parent samples. Read counts per gene are rescaled so that the total number of reads is equal in both samples. All points should lie above the dashed 1-to-1 line, and the histogram of targeted gene enrichments on the right should lie well to the right of 0.
The Per-Gene Sensitivity dashboard shows the UMI counts per targeted gene in the parent and targeted samples. Genes should ideally lie on the 1-to-1 line. UMI counts are not rescaled to sequencing depth, so genes may lie slightly above or below the dashed line if there are large differences in targeted sequencing depth (Mean Targeted Reads per Tissue-Covered Spot; see below) across both samples. A histogram centered around 1 (or greater) indicates that UMIs in the parent sample were successfully recovered.
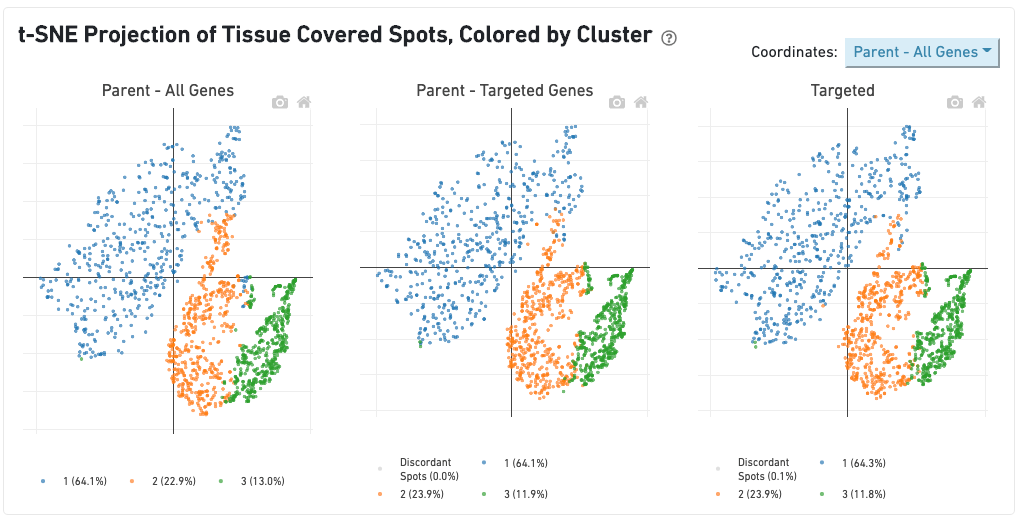
The dashboard "t-SNE Projection of Tissue Covered Spot, Colored by Cluster" allows for comparison of spot clustering patterns across samples. Barcodes called as tissue-covered spots in either sample are used for this analysis. The t-SNE projections and clusterings are computed separately for:
Barcodes are clustered using the K-Means algorithm (see Gene Expression Algorithms). The selected value of k (the number of clusters) is that which yields the best Davies-Bouldin index in the "Parent - All Genes" sample, a rough measure of clustering quality. The color of the barcode represents its cluster, with barcodes that are not called as tissue-covered spots in that sample being colored in gray.
While the clustering patterns remain sample-specific, the t-SNE projection displayed can be chosen using the dropdown in the upper-right corner. For example, selecting the Parent - Targeted Genes option displays barcodes using t-SNE projection 2 in all three plots. Lastly the Per Sample selection shows the three individual t-SNEs and clustering patterns side-by-side. Clusters with a high fraction of overlapping barcodes across samples use the same color across samples. For example, in the image above, the orange cluster is largely composed of the same barcodes in all three samples, while the green cluster in the bottom right of the Targeted plot contains barcodes corresponding to a variety of clusters and therefore remains unmatched in the other two plots.
metrics_summary.csv)The list of metrics displayed in the above Summary HTML file are also provided in CSV format. Below are the definitions of the reported metrics.
| Metric | Description |
|---|---|
Total Reads Pairs in Targeted Sample | Total number of read pairs in the targeted sample that were assigned to gene expression libraries in demultiplexing. |
Total Reads Pairs in Parent Sample | Total number of read pairs in the parent sample that were assigned to gene expression libraries in demultiplexing. |
Fraction of Reads Confidently Mapped to the | Fraction of reads that mapped to a unique and targeted gene in the transcriptome in the targeted sample. The read must be consistent with annotated splice junctions. These reads are considered for UMI counting. This metric differs slightly from the similarly-named metrics in the Targeted Gene Expression Run Summary, due to the filtering of reads with invalid barcodes or UMIs with low read support. |
Fraction of Reads Confidently Mapped to the | Fraction of reads that mapped to a unique and targeted gene in the transcriptome in the parent sample. The read must be consistent with annotated splice junctions. These reads are considered for UMI counting. |
Number of tissue-covered spots called in Targeted Sample | Number of barcodes called as tissue-covered spots in the Targeted Sample. |
Number of tissue-covered spots called in Parent Sample | Number of barcodes called as tissue-covered spots in the Parent Sample. |
Number of tissue-covered spots called in Parent and Targeted | Number of barcodes called as tissue-covered spots in both the parent and targeted samples. |
Number of tissue-covered spots called only in Targeted Sample | Number of barcodes called as tissue-covered spots in the Targeted Sample and not the Parent Sample. |
Number of tissue-covered spots called only in Parent Sample | Number of barcodes called as tissue-covered spots in the Parent Sample and not the Targeted Sample. |
Mean Reads per tissue-covered spot in Targeted Sample | The total number of reads divided by the number of barcodes associated with a tissue-covered spot in the targeted sample. |
Mean Reads per tissue-covered spot in Parent Sample | The total number of reads divided by the number of barcodes associated with a tissue-covered spot in the parent sample. |
Mean Targeted Reads per tissue-covered spot in Targeted Sample | The total number of targeted reads divided by the number of barcodes associated with a tissue-covered spot in the targeted sample. |
Mean Targeted Reads per tissue-covered spot in Parent Sample | The total number of targeted reads divided by the number of barcodes associated with a tissue-covered spot in the parent sample. |
Median Targeted Genes per tissue-covered spot in Targeted Sample | The median number of targeted genes detected per tissue-covered spot in the targeted sample. |
Median Targeted Genes per tissue-covered spot in Parent Sample | The median number of targeted genes detected per tissue-covered spot in the parent sample. |
Number of Targeted Genes Detected in Targeted Sample | Number of Targeted Genes Detected in Targeted Sample. A gene is considered detected if it has at least 1 tissue-covered UMI in the targeted sample. |
Number of Targeted Genes Detected in Parent Sample | Number of Targeted Genes Detected in Parent Sample. A gene is considered detected if it has at least 1 tissue-covered UMI in the parent sample. |
Number of Targeted Genes Detected Exclusively | Number of Targeted Genes Detected Exclusively in Targeted Sample. A gene is considered detected if it has at least 1 UMI count in a tissue-covered spot barcode. |
Number of Targeted Genes Detected Exclusively | Number of Targeted Genes Detected Exclusively in Parent Sample. A gene is considered detected if it has at least 1 UMI count in a tissue-covered spot barcode. |
Median Targeted UMIs per tissue-covered spot in Targeted Sample | The median number of UMI counts in targeted genes per tissue-covered spot in the targeted sample. |
Median Targeted UMIs per tissue-covered spot in Parent Sample | The median number of UMI counts in targeted genes per tissue-covered spot in the parent sample. |
Number of Targeted Genes Enriched Relative to Parent | Number of targeted genes classified as enriched. Only genes that have at least 1 tissue-covered spot in the parent sample are considered. Genes are classified as enriched or non-enriched based on their read enrichment (see Targeted Gene Expression Algorithms). |
Mean Targeted Reads per tissue-covered spot Relative to Parent | Mean ratio of targeted reads per tissue-covered spot in the targeted sample relative to parent sample for all barcodes called as tissue-covered spots in both samples. |
Mean Read Enrichment across Targeted Genes | Mean Read Enrichment across Targeted Genes. Enrichments are only computed for genes with at least 1 tissue-covered spot UMI in both the targeted and parent samples. Mean is the geometric mean of the enrichments. Samples are rescaled to the total number of reads in order to account for differences in sequencing depth. |
Per-gene read counts R-squared | Pearson correlation coefficient (squared) of the number of reads confidently mapped to targeted genes (log10) in the targeted vs parent experiments. |
Mean Ratio of Targeted UMI Counts in Targeted | Mean per-gene ratio of UMIs observed in targeted sample relative to the parent sample. |
Per-gene UMI counts R-squared | Pearson correlation coefficient (squared) of the number of UMIs confidently mapped to targeted genes (log10) in the targeted vs parent experiments. |
barcode_summary.csv)A CSV file containing data per barcode in the targeted and parent samples. Each row corresponds to a barcode.
$ head -5 barcode_summary.csv
Number of Reads in Targeted Sample in Targeted Genes,Number of Umis in Targeted Sample in Targeted Genes,Barcode,Is Tissue-Covered Spot in Targeted Sample,Number of Reads in Parent Sample in Targeted Genes,Number of Umis in Parent Sample in Targeted Genes,Is Tissue-Covered Spot in Parent Sample,Number of Reads in Targeted Sample in All Genes,Number of Umis in Targeted Sample in All Genes,Number of Reads in Parent Sample in All Genes,Number of Umis in Parent Sample in All Genes,Tissue-Covered Spot Call Category,Cluster in Targeted Sample,Cluster in Parent Sample Subset to Targeted Genes,Cluster in Parent Sample
49100,4746,CATATTCGTACCATCA-1,True,19866,4566,True,55048,6081,211045,46787,both,3,3,1
54912,4839,GCAGCCATCACATAGC-1,True,17716,4220,True,55884,5245,199889,45704,both,7,7,4
51920,4408,ACGATACTCTGAGTGT-1,True,12354,3179,True,53137,5057,140148,34364,both,3,3,3
38994,4321,AGATTGCCAAACCTAC-1,True,18670,4239,True,39411,4445,89865,20624,both,2,2,2
Column descriptions:
| Column Name | Description |
|---|---|
Barcode | Barcode sequence being considered. |
Number of Reads in Targeted Sample in Targeted Genes | Number of reads with this barcode that mapped to a unique, targeted gene in the targeted sample. The read must be consistent with annotated splice junctions and is considered for UMI counting. |
Number of Umis in Targeted Sample in Targeted Genes | Number of UMIs with this barcode that mapped to a unique, targeted gene in the targeted sample. |
Is Tissue-Covered Spot in Targeted Sample | True or False, whether this barcode was called as a tissue-covered spot in the targeted sample. |
Number of Reads in Parent Sample in Targeted Genes | Number of reads with this barcode that mapped to a unique, targeted gene in the parent sample. The read must be consistent with annotated splice junctions and is considered for UMI counting. |
Number of Umis in Parent Sample in Targeted Genes | Number of UMIs with this barcode that mapped to a unique, targeted gene in the parent sample. |
Is Tissue-Covered Spot in Parent Sample | True or False, whether this barcode was called as a tissue-covered spot in the parent sample. |
Number of Reads in Parent Sample in All Genes | Number of reads with this barcode that mapped to a unique gene in the parent sample. The read must be consistent with annotated splice junctions and is considered for UMI counting. |
Number of Umis in Parent Sample in All Genes | Number of UMIs with this barcode that mapped to a unique gene in the parent sample. |
Tissue-Covered Spot Call Category | Classifies barcodes based on whether they are called as tissue-covered spots in these samples. Must be one of 1) both, 2) targeted-only, 3) parent-only, or 4) neither. |
Cluster in Targeted Sample | Cluster this barcode belongs to. Will be -1 if the barcode is not a tissue-covered spot in this sample. |
feature_summary.csv)A CSV file containing data per feature in the targeted and parent samples. Each row corresponds to a feature.
$ head -5 feature_summary.csv
Feature Id,Feature Name,Is Targeted,Read Enrichment,Is Enriched,Number of Reads in Targeted Sample,Number of Umis in Targeted Sample,Number of Reads Tissue-Covered Spots in Targeted Sample,Number of Umis Tissue-Covered Spots in Targeted Sample,Number of Reads in Parent Sample,Number of Umis in Parent Sample,Number of Reads Tissue-Covered Spots in Parent Sample,Number of Umis Tissue-Covered Spots in Parent Sample,Umi Recovery
ENSG00000116691,MIIP,False,-9.696865148549238,False,3,3,3,3,11340,2532,10897,2420,0.0012396694214876036
ENSG00000120949,TNFRSF8,True,4.55480906020458,True,5943,329,5671,311,1115,271,1056,257,1.2101167315175096
ENSG00000285604,AL357835.1,False,,False,0,0,0,0,0,0,0,0,
ENSG00000028137,TNFRSF1B,True,4.258973216469358,True,170378,11129,160881,10385,38995,9377,36776,8835,1.1754385964912282
ENSG00000048707,VPS13D,False,-10.307936333724916,False,1,1,1,1,6169,1887,5548,1686,0.0005931198102016608
Column descriptions:
| Column Name | Description |
|---|---|
Feature Id | Unique ID for the gene, as specified via the ID field in the reference transcriptome GTF. |
Feature Name | Common gene name, as specified via the name field in the reference transcriptome GTF. |
Is Targeted | True or False, whether this gene is included in the target panel. |
Number of Reads in Targeted Sample | Number of reads aligned uniquely to this gene in the targeted sample. The read must be consistent with annotated splice junctions for this gene and is considered for UMI counting. |
Number of Umis in Targeted Sample | Number of UMIs aligned uniquely to this gene in the targeted sample. |
Number of Reads Tissue-Covered Spots in Targeted Sample | Number of reads in tissue-covered spots aligned uniquely to this gene in the targeted sample. The read must be consistent with annotated splice junctions for this gene and is considered for UMI counting. |
Number of Umis Tissue-Covered Spots in Targeted Sample | Number of UMIs in tissue-covered spots aligned uniquely to this gene in the targeted sample. |
Number of Reads in Parent Sample | Number of reads aligned uniquely to this gene in the parent sample. The read must be consistent with annotated splice junctions for this gene and is considered for UMI counting. |
Number of Umis in Parent Sample | Number of UMIs aligned uniquely to this gene in the parent sample. |
Number of Reads Tissue-Covered Spots in Parent Sample | Number of reads in tissue-covered spots aligned uniquely to this gene in the parent sample. The read must be consistent with annotated splice junctions for this gene and is considered for UMI counting. |
Number of Umis Tissue-Covered Spots in Parent Sample | Number of UMIs in tissue-covered spots aligned uniquely to this gene in the parent sample. |
Read Enrichment | Defined as Number of reads in Targeted Sample divided by Number of reads in Parent Sample, after rescaling read counts in each sample to the same number of read pairs from Gene Expression libraries |
Is Enriched | True or False, whether or not the gene is enriched in the Targeted Sample relative to the Parent sample. See Targeted Gene Expression Algorithms for more information on how this is determined. |
Umi Recovery | Defined as Number of UMIs in Targeted Sample divided by Number of UMIs in Parent Sample. This ratio uses the raw UMI counts in both experiments and is not adjusted for sequencing depth. |