Space Ranger2.0, printed on 03/23/2025
In this tutorial you will:
For successful run of this tutorial, you must:
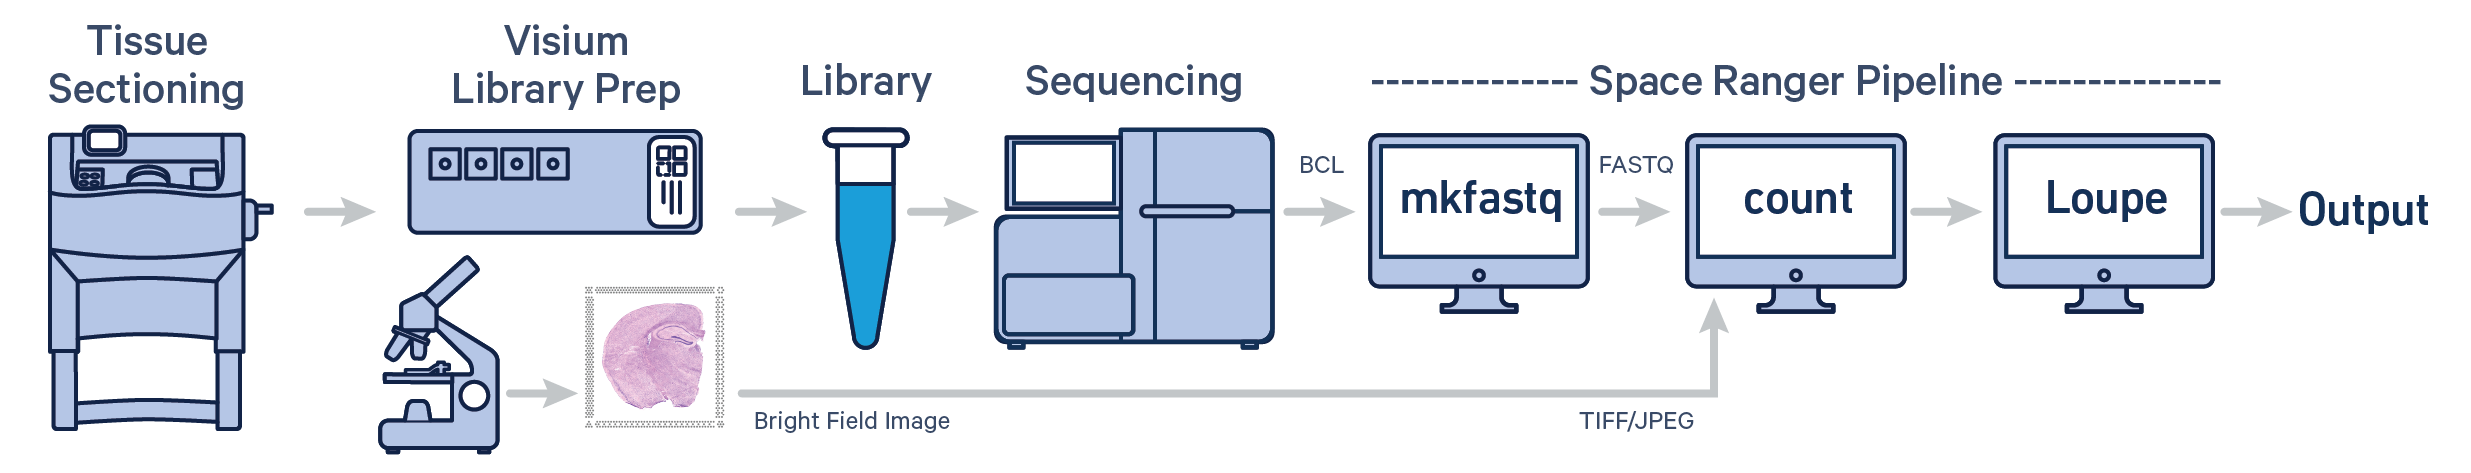
Spatial gene expression for fresh frozen (FF) tissue is determined using spaceranger count pipeline which takes microscope image of the visium slide (in either TIFF or JPEG formats) and sample FASTQ files as inputs. The pipeline performs alignment, tissue and fiducial detection as well as barcode/UMI counting. Outputs capture the feature-spot matrices, clustering and differential gene expression (DGE) which can be further analyzed and visualized in Loupe Browser.
In this tutorial, we will run run spaceranger count pipeline on a mouse brain coronal section public dataset. Key dataset features are:
| The example dataset includes a brightfield image with clear view of the fiducial frame enabling the use of spaceranger automatic image processing pipeline. The code included in this tutorial reflects this workflow. |
All the following commands will be run in the working directory spaceranger_tutorial that was use to setup spaceranger on a compatible compute platform.
| We strongly encourage backing up the raw sequencing files generated from your own experiments. As the example dataset and the reference data are publicly available, you will be able to re-download and run the tutorial should the files be deleted from your server. |
Both the raw sequencing files in FASTQ format, and the image in TIFF format, are available for batch download on the dataset page. For better organization, we will create a datasets folder prior to downloading the required file.
# Create datasets folder
mkdir datasets

# Download FASTQ to datasets folder
curl https://s3-us-west-2.amazonaws.com/10x.files/samples/spatial-exp/1.1.0/V1_Adult_Mouse_Brain/V1_Adult_Mouse_Brain_fastqs.tar -o datasets/V1_Adult_Mouse_Brain_fastqs.tar

# Download image file to datasets folder
curl https://cf.10xgenomics.com/samples/spatial-exp/1.1.0/V1_Adult_Mouse_Brain/V1_Adult_Mouse_Brain_image.tif -o datasets/V1_Adult_Mouse_Brain_image.tif
% Total    % Received % Xferd  Average Speed   Time    Time     Time  Current
                                 Dload  Upload   Total   Spent    Left  Speed
  0 26.9G    0  135M    0     0  34.4M      0  0:13:22  0:00:03  0:13:19 34.4M
Alternatively, you can also use wget to download.
# Create datasets folder
mkdir datasets

# Download FASTQ to datasets folder
wget -P datasets/ https://s3-us-west-2.amazonaws.com/10x.files/samples/spatial-exp/1.1.0/V1_Adult_Mouse_Brain/V1_Adult_Mouse_Brain_fastqs.tar

# Download image file to datasets folder
wget -P datasets/ https://cf.10xgenomics.com/samples/spatial-exp/1.1.0/V1_Adult_Mouse_Brain/V1_Adult_Mouse_Brain_image.tif
Resolving s3-us-west-2.amazonaws.com (s3-us-west-2.amazonaws.com)... 52.218.217.16
Connecting to s3-us-west-2.amazonaws.com (s3-us-west-2.amazonaws.com)|52.218.217.16|:443...
connected.
HTTP request sent, awaiting response... 200 OK
Length: 28987985920 (27G) [application/x-tar]
Saving to: ‘V1_Adult_Mouse_Brain_fastqs.tar’

10% [=======>                                                                         ] 3,179,419,763 36.2MB/s  eta 11m 35s
Since the example dataset is based on mouse tissue section, we can download the latest version of the mouse transcriptome reference available from the Downloads page. Here the curl download option is highlighted.
# Download mouse reference
curl -O https://cf.10xgenomics.com/supp/spatial-exp/refdata-gex-mm10-2020-A.tar.gz
% Total    % Received % Xferd  Average Speed   Time    Time     Time  Current
                                 Dload  Upload   Total   Spent    Left  Speed
  1 9835M    1  158M    0     0  34.1M      0  0:04:48  0:00:04  0:04:44 34.1M
After successful download of the all the required files, the contents of the tar files need to be extracted before moving onto the next steps.
# Extract sample FASTQ files
tar -xvf datasets/V1_Adult_Mouse_Brain_fastqs.tar -C datasets/ && rm datasets/V1_Adult_Mouse_Brain_fastqs.tar

# Extract mouse reference transcriptome
tar -xzvf refdata-gex-mm10-2020-A.tar.gz && rm refdata-gex-mm10-2020-A.tar.gz
# Sample FASTQ files
V1_Adult_Mouse_Brain_fastqs/
V1_Adult_Mouse_Brain_fastqs/V1_Adult_Mouse_Brain_S5_L002_I2_001.fastq.gz
V1_Adult_Mouse_Brain_fastqs/V1_Adult_Mouse_Brain_S5_L001_R1_001.fastq.gz
...

# Reference mouse transcriptome
refdata-gex-mm10-2020-A/
refdata-gex-mm10-2020-A/fasta/
refdata-gex-mm10-2020-A/fasta/genome.fa
...
Successful extraction will create two additional folders, highlighted in bold, within the working directory.
spaceranger_tutorial
├── datasets
│   ├── V1_Adult_Mouse_Brain_fastqs
│   └── V1_Adult_Mouse_Brain_image.tif
├── refdata-gex-mm10-2020-A
└── spaceranger-2.0.0
We now have all the required inputs needed to run the spaceranger count pipeline. To obtain more information about the specifying inputs, print the pipeline specific usage statement.
# Print count usage statement
spaceranger count --help
spaceranger-count Count gene expression and feature barcoding reads from a single capture areaUSAGE: spaceranger count [FLAGS] [OPTIONS] --id <ID> --transcriptome <PATH> --fastqs <PATH>... <--image <IMG>|--darkimage <IMG>...|--colorizedimage <IMG>> FLAGS: --no-bam Do not generate a bam file --nosecondary Disable secondary analysis, e.g. clustering. Optional --disable-ui Do not serve the web UI --noexit Keep web UI running after pipestance completes or fails --nopreflight Skip preflight checks -h, --help Prints help information ... OPTIONS: --id <ID> A unique run id and output folder name [a-zA-Z0-9_-]+ --description <TEXT> Sample description to embed in output files --image <IMG> Single H&E brightfield image in either TIFF or JPG format --slide <TEXT> Visium slide serial number, for example 'V10J25-015' --area <TEXT> Visium area identifier, for example 'A1' --transcriptome <PATH> Path of folder containing 10x-compatible reference
...
We can now build the spaceranger count command for the example dataset. We will running the pipeline in our working directory spaceranger_tutorial assuming the same directory structure as shown previously. The input folder paths below reflect this choice.
In case you have a different setup, amend the paths accordingly prior to running the pipeline to avoid any errors. The easiest method to customize would be to copy the code below in any text editor of your choice (e.g. notepad++), edit and paste it back to the terminal.
spaceranger count --id="V1_Adult_Mouse_Brain" \
                   --description="Adult Mouse Brain (Coronal)" \
                   --transcriptome=refdata-gex-mm10-2020-A \
                   --fastqs=datasets/V1_Adult_Mouse_Brain_fastqs \
                   --image=datasets/V1_Adult_Mouse_Brain_image.tif \
                   --slide=V19L01-041 \
                   --area=C1 \
                   --localcores=16 \
                   --localmem=128
For compute platforms connected to the internet, spaceranger uses the value of the --slide argument to automatically download the slide layout file in gpr format.
spaceranger count --id="V1_Adult_Mouse_Brain" \
                  --description="Adult Mouse Brain (Coronal)" \
                  --transcriptome=refdata-gex-mm10-2020-A \
                  --fastqs=datasets/V1_Adult_Mouse_Brain_fastqs \
                  --image=datasets/V1_Adult_Mouse_Brain_image.tif \
                  --slide=V19L01-041 \
                  --slidefile=V19L01-041.gpr \
                  --area=C1 \
                  --localcores=16 \
                  --localmem=128
In absence of internet connectivity to the compute platform, you can download this specific slide layout file in gpr format and provide it to spaceranger using the --slidefile argument.
Below are brief descriptions of the above command line options.
| Option | Description |
|---|---|
--id |
The id must be unique string and will be used to name the resulting folder with all of the pipeline outputs. We choose to keep the original dataset name of V1_Adult_Mouse_Brain |
--description |
This is sample description included in the output files (e.g. web_summary.html). We describe the sample as "Adult Mouse Brain (Coronal)" |
--transcriptome |
The path to the species specific pre-compiled transcriptome files. Note that you can either provide the relative path as shown above or the absolute path to this folder. As the tissue sample was of mouse origin, we provide the path to the mouse reference transcriptome refdata-gex-mm10-2020-A |
--fastqs |
The path to the folder containing sample sequencing files in FASTQ format. The path can be relative as shown above or absolute. The relative path is /datasets/V1_Adult_Mouse_Brain_fastqs |
--image |
The path to a single brightfield image with H&E staining in either TIFF or JPEG formats. The path can be relative or absolute. Here we have a TIFF format image with the following relative path /datasets/V1_Adult_Mouse_Brain_image.tif |
--slide |
The visium slide serial number of which the tissue sample was mounted and the value here is V19L01-041 |
--area |
The capture area identifier on the visium slide. It can be one of four values: A1, B1, C1 or D1. Here the tissue sample was mounted on C1 capture area. |
--slidefile |
The slide layout file in gpr format which is provided when spaceranger does not have internet access. You can download the slide layout file and provide it as V19L01-041.gpr |
--localcores |
The number of CPU cores available to run the spaceranger count pipeline. The maximum upper limit for your specific compute system is determined using the sitecheck subcommand. We will use 16 cores in this tutorial. |
--localmem |
The max memory in GB available to run the spaceranger count pipeline. The maximum upper limit for your specific compute system is determined using the sitecheck subcommand. We will use 128 GB in this tutorial. |
When using the localmode as shown in this tutorial, you can run the pipeline directly in your terminal. However for an uninterrupted run, it is preferable to use a terminal multiplexer program (e.g screen, tmux).
|
At the start of the pipeline, you should see the message about the preflight checks printed to the command line.
# Run spaceranger count
spaceranger count --id="V1_Adult_Mouse_Brain" \
                  --description="Adult Mouse Brain (Coronal)" \
                  --transcriptome=refdata-gex-mm10-2020-A \
                  --fastqs=datasets/V1_Adult_Mouse_Brain_fastqs \
                  --image=datasets/V1_Adult_Mouse_Brain_image.tif \
                  --slide=V19L01-041 \
                  --area=C1 \
                  --localcores=16 \
                  --localmem=128
# Run spaceranger count
spaceranger count --id="V1_Adult_Mouse_Brain" \
                  --description="Adult Mouse Brain (Coronal)" \
                  --transcriptome=refdata-gex-mm10-2020-A \
                  --fastqs=datasets/V1_Adult_Mouse_Brain_fastqs \
                  --image=datasets/V1_Adult_Mouse_Brain_image.tif \
                  --slide=V19L01-041 \
                  --slidefile=V19L01-041.gpr \
                  --area=C1 \
                  --localcores=16 \
                  --localmem=128
Martian Runtime - v4.0.5

Running preflight checks (please wait)...
Checking sample info...
Checking FASTQ folder...
Checking reference...
Checking reference_path...
Checking optional arguments...

...
Successful completion of the pipeline is indicated by summary of the output files generated.
Outputs:
- Run summary HTML:                                          /spaceranger_tutorial/V1_Adult_Mouse_Brain/outs/web_summary.html
- Outputs of spatial pipeline:
    aligned_fiducials:              /spaceranger_tutorial/V1_Adult_Mouse_Brain/outs/spatial/aligned_fiducials.jpg
    detected_tissue_image:          /spaceranger_tutorial/V1_Adult_Mouse_Brain/outs/spatial/detected_tissue_image.jpg
    scalefactors_json:              /spaceranger_tutorial/V1_Adult_Mouse_Brain/outs/spatial/scalefactors_json.json
    tissue_hires_image:             /spaceranger_tutorial/V1_Adult_Mouse_Brain/outs/spatial/tissue_hires_image.png
    tissue_lowres_image:            /spaceranger_tutorial/V1_Adult_Mouse_Brain/outs/spatial/tissue_lowres_image.png
    cytassist_image:                null
    aligned_tissue_image:           null
    tissue_positions:               /spaceranger_tutorial/V1_Adult_Mouse_Brain/outs/spatial/tissue_positions.csv
    spatial_enrichment:             /spaceranger_tutorial/V1_Adult_Mouse_Brain/outs/spatial/spatial_enrichment.csv
    barcode_fluorescence_intensity: null
- Run summary CSV:                                           /spaceranger_tutorial/V1_Adult_Mouse_Brain/outs/metrics_summary.csv
- Correlation values between isotypes and Antibody features: null
- BAM:                                                       /spaceranger_tutorial/V1_Adult_Mouse_Brain/outs/possorted_genome_bam.bam
- BAM BAI index:                                             /spaceranger_tutorial/V1_Adult_Mouse_Brain/outs/possorted_genome_bam.bam.bai
- BAM CSI index:                                             null
- Filtered feature-barcode matrices MEX:                     /spaceranger_tutorial/V1_Adult_Mouse_Brain/outs/filtered_feature_bc_matrix
- Filtered feature-barcode matrices HDF5:                    /spaceranger_tutorial/V1_Adult_Mouse_Brain/outs/filtered_feature_bc_matrix.h5
- Unfiltered feature-barcode matrices MEX:                   /spaceranger_tutorial/V1_Adult_Mouse_Brain/outs/raw_feature_bc_matrix
- Unfiltered feature-barcode matrices HDF5:                  /spaceranger_tutorial/V1_Adult_Mouse_Brain/outs/raw_feature_bc_matrix.h5
- Secondary analysis output CSV:                             /spaceranger_tutorial/V1_Adult_Mouse_Brain/outs/analysis
- Per-molecule read information:                             /spaceranger_tutorial/V1_Adult_Mouse_Brain/outs/molecule_info.h5
- Loupe Browser file:                                        /spaceranger_tutorial/V1_Adult_Mouse_Brain/outs/cloupe.cloupe
- Feature Reference:                                         null
- Target Panel file:                                         null
- Probe Set file:                                            null

Waiting 6 seconds for UI to do final refresh.
Pipestance completed successfully!
After the run is completed, the working directory will have a new folder named V1_Adult_Mouse_Brain (value provided to --id argument) that contains all the metadata and outputs generated from the spaceranger count pipeline. We will highlight some key components of this folder (highlighted in bold):
V1_Adult_Mouse_Brain
├── _cmdline
├── _filelist
├── _finalstate
├── _invocation
├── _jobmode
├── _log
├── _mrosource
├── outs
├── _perf
├── _sitecheck
├── SPATIAL_RNA_COUNTER_CS
├── _tags
├── _timestamp
├── _uuid
├── V1_Adult_Mouse_Brain.mri.tgz
├── _vdrkill
└── _versions
outs contains all the final pipeline generated outputsV1_Adult_Mouse_Brain.mri.tgz contains diagnostic information helpful to 10x Genomics support to resolve any errors_sitecheck captures the system configuration similar to sitecheck subcommand_timestamp contains information on pipeline runtimes. The runtime for the example dataset with the above configuration was 1:26:17_cmdline captures the count command provided to run the pipeline_versions contains both the spaceranger and Martian versions used in the runThe outs folder contain all the calculated results.
![]()
You can further explore and understand these results by
.cloupe file in
Loupe BrowserQ. I ran spaceranger count and got this error Could not retrieve spot layout data. What does this mean and how can I proceed ?
When you specify the visium slide id using the --slide argument, spaceranger count downloads the corresponding slide file layout file in gpr format. This step requires internet connectivity. However in some instances, compute platforms may not have internet access and hence the resulting error message. If you know the visium slide id, you can download the slide layout file and provide it to the pipeline using the --slidefile argument along with specifying the capture area with --area.
Q. I received visium dataset from my collaborator. However I do not have information about the visium slide id number and the capture area used in the experiment. What can I use instead ?
The spaceranger count pipeline can run in absence of knowledge of actual slide id or capture area information by providing --unknown-slide argument instead. This allows the pipeline to use a default slide layout file that comes bundled with the installation tarball. The typical per-spot difference between the default layout and a specific slide is under 10 microns.
Q. I ran into this error Tissue image incorrectly formatted: TinyImageError What does this mean ?
The spaceranger count pipelines expects an image with atleast 2000 pixels on one side. This error indicates that the provided image does not meet this requirement. You can address this by rescaling the image in any suitable tool (e.g. ImageJ/Fiji Image Magick) such that one of the image dimensions are greater than 2000 pixels. Read more about image requirements and accepted formats in Image Recommendations.