Space Ranger2.0, printed on 04/26/2025
In this tutorial you will learn more about:
For success with this tutorial, you must:
Tissue Microarrays (TMAs) are composed of representative small-tissue cores extracted from formaldehyde fixed paraffin embedded (FFPE) tissue blocks arranged in a predetermined order. The tissue cores can be extracted manually or using an automated TMA machine. TMAs offer the ability to perform
high-throughput analysis over a large number of tissue samples under the same experimental conditions. TMAs can contain cores across multiple tissue types, disease conditions, from different time points in the disease progression, or from different donors, with widely different clinical outcomes.
In this tutorial, the FFPE tissue cores (2 mm diameter) were arranged in a 3x3 grid layout with edge to edge spacing of 2 mm, sectioned (5 μm) on a standard glass slide and analytes were captured using CytAssist Spatial Gene Expression Slide, 11 mm. The alternating tissue cores represent two different tissue types from a mouse specimen: brain and lung.
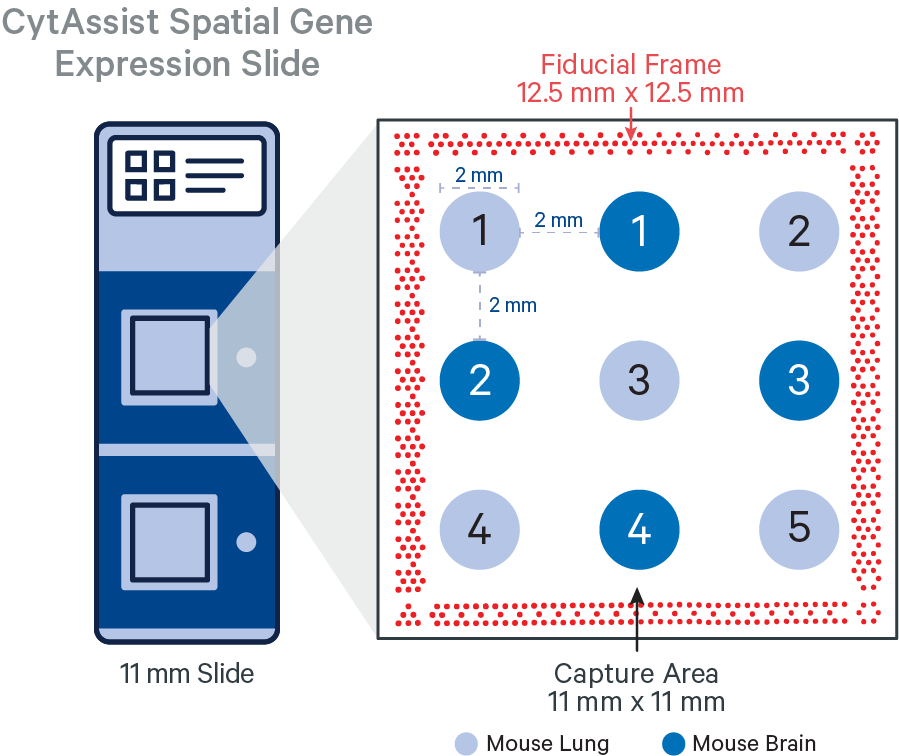
The CytAssist instrument automates the transfer of analytes from the tissue section on a standard glass slide to the Visium CytAssist Spatial Gene Expression Slide. The analysis workflow for CytAssist-mediated Spatial Gene Expression is similar to that for FFPE samples. For TMAs, one could create the tissue core punches, that will be an additional step required for the standard workflow, or source a premade tissue block with tissue cores.
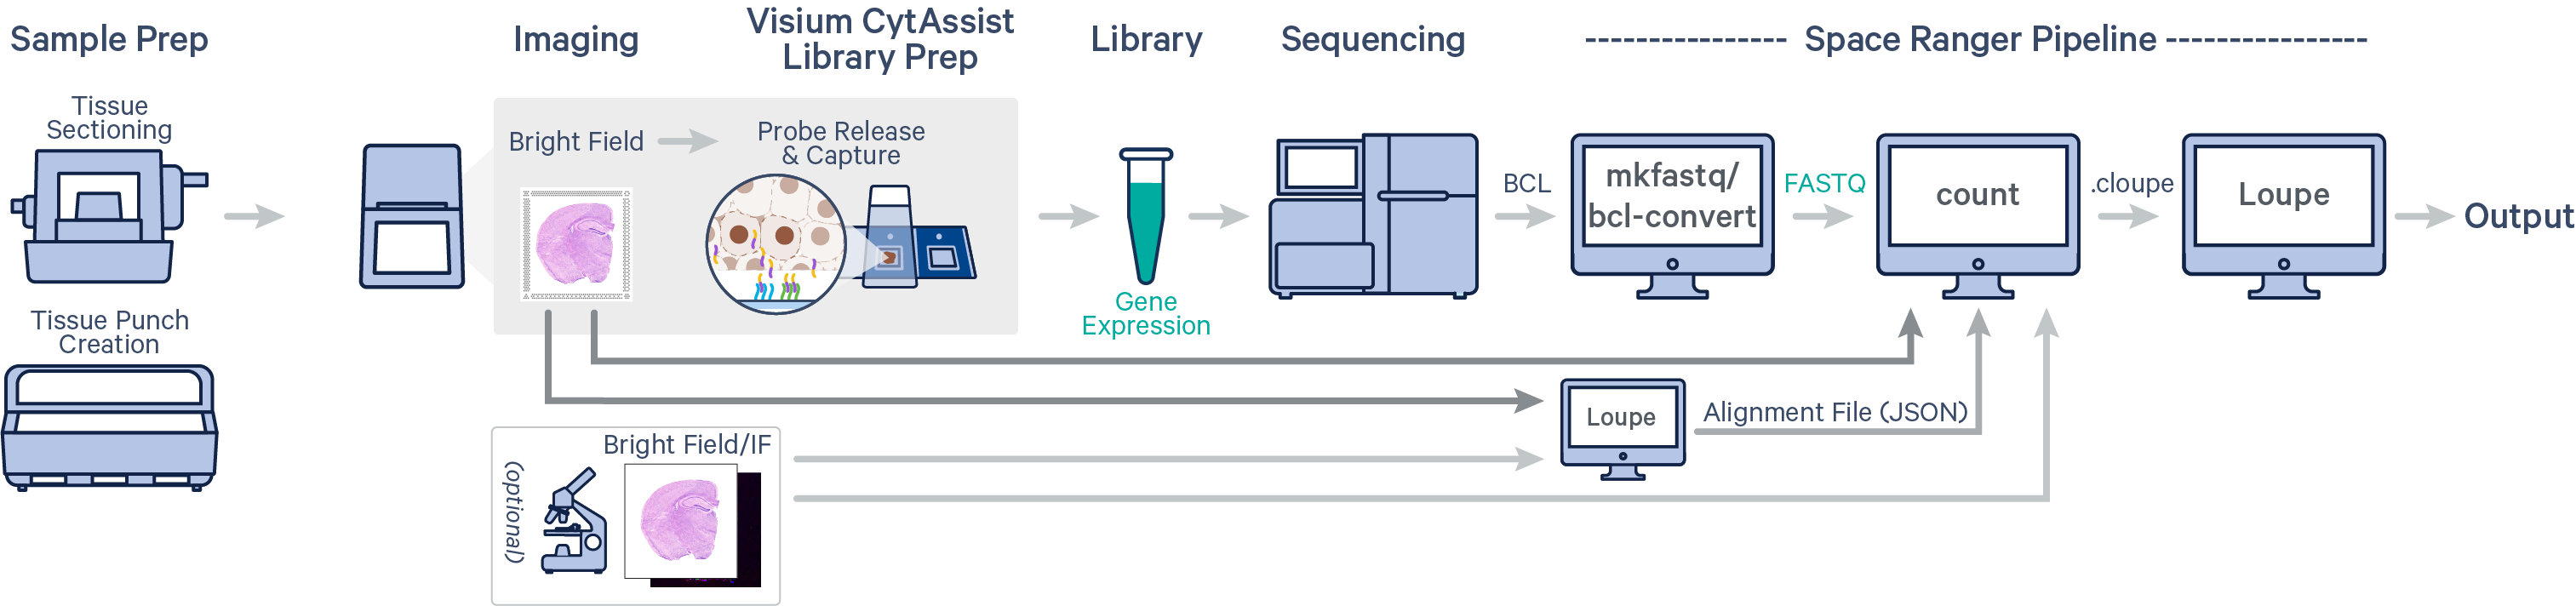
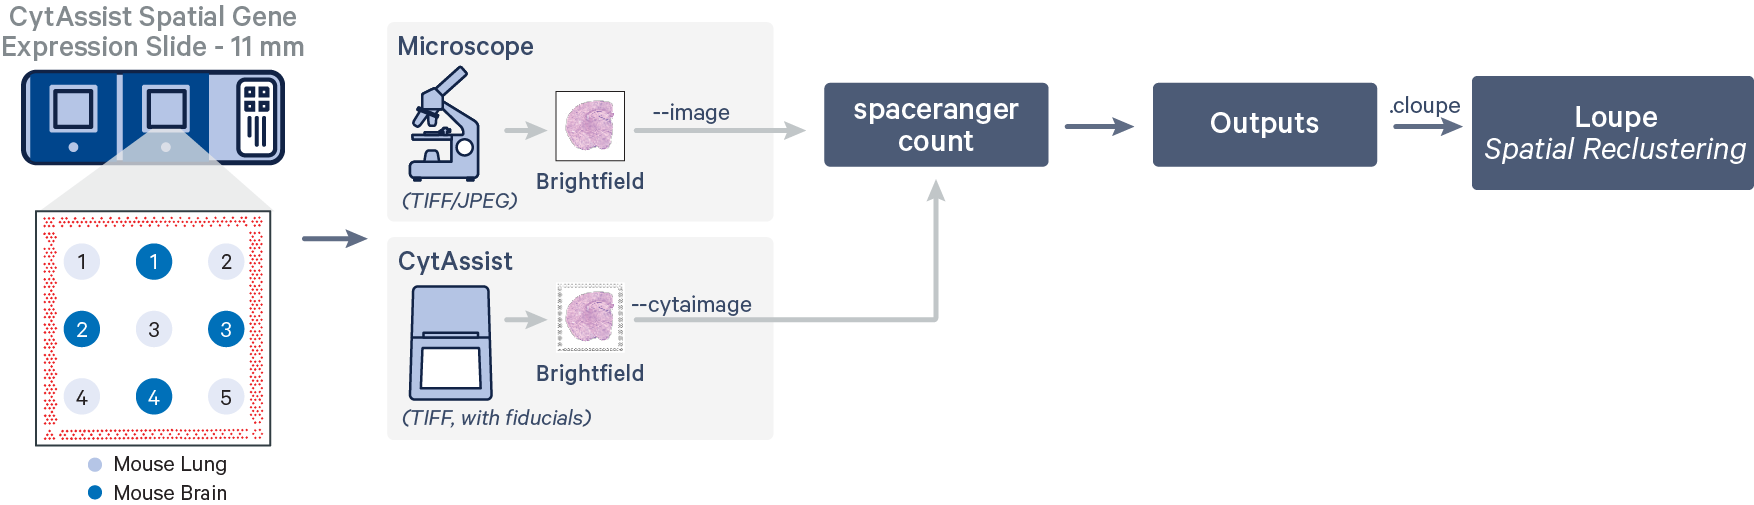
Spatial gene expression is determined using the spaceranger count pipeline, which inputs the CytAssist instrument-generated image of the CytAssist slide with the tissue section (the CytAssist image in TIFF format), with an optional microscope image of the stained tissue section on the standard glass slide (in either TIFF or JPEG formats), and sample FASTQ files. The brightfield CytAssist image includes the fiducial frame, and is used for automatic image processing pipeline for fiducial alignment and tissue detection. The pipeline performs alignment, image registration, tissue and fiducial detection as well as barcode/UMI counting. Outputs capture the feature-spot matrices, clustering and differential gene expression (DGE) which can be further analyzed and visualized in Loupe Browser.
In this tutorial, we will run spaceranger count pipeline on a mouse TMA public dataset. Key dataset features include:
All the following commands will be run in the working directory spaceranger_tutorial that was used to set up spaceranger on a compatible compute platform.
| We strongly encourage backing up the raw sequencing files generated from your own experiments. As the example dataset and the reference data are publicly available, you will be able to redownload and run the tutorial should the files be deleted from your server. |
Both the raw sequencing files in FASTQ format, the CytAssist image in TIFF format, and the microscope image in TIFF are available for batch download on the dataset page. For better organization, we will create a datasets folder before downloading the required files.
# Create datasets folder
mkdir datasets

# Download FASTQ files to datasets folder
curl https://s3-us-west-2.amazonaws.com/10x.files/samples/spatial-exp/2.0.1/CytAssist_11mm_FFPE_Mouse_TMA_3x3_2mm/CytAssist_11mm_FFPE_Mouse_TMA_3x3_2mm_fastqs.tar -o datasets/CytAssist_11mm_FFPE_Mouse_TMA_3x3_2mm_fastqs.tar

# Download CytAssist image file to datasets folder
curl https://cf.10xgenomics.com/samples/spatial-exp/2.0.1/CytAssist_11mm_FFPE_Mouse_TMA_3x3_2mm/CytAssist_11mm_FFPE_Mouse_TMA_3x3_2mm_image.tif -o datasets/CytAssist_FFPE_Mouse_TMA_3x3_2mm_cytaimage.tif

# Download microscope image file to datasets folder
curl https://cf.10xgenomics.com/samples/spatial-exp/2.0.1/CytAssist_11mm_FFPE_Mouse_TMA_3x3_2mm/CytAssist_11mm_FFPE_Mouse_TMA_3x3_2mm_tissue_image.tif -o datasets/CytAssist_FFPE_Mouse_TMA_3x3_2mm_microscope.tif
 % Total    % Received % Xferd  Average Speed   Time    Time     Time  Current
                                 Dload  Upload   Total   Spent    Left  Speed
 11 7200M   11  855M    0     0  40.8M      0  0:02:56  0:00:20  0:02:36 41.6M
Alternatively, you can also use wget to download.
# Create datasets folder
mkdir datasets

# Download FASTQ to datasets folder
wget -O datasets/ https://s3-us-west-2.amazonaws.com/10x.files/samples/spatial-exp/2.0.1/CytAssist_11mm_FFPE_Mouse_TMA_3x3_2mm/CytAssist_11mm_FFPE_Mouse_TMA_3x3_2mm_fastqs.tar

# Download CytAssist image file to datasets folder
wget -O datasets/CytAssist_FFPE_Mouse_TMA_3x3_2mm_cytaimage.tif https://cf.10xgenomics.com/samples/spatial-exp/2.0.1/CytAssist_11mm_FFPE_Mouse_TMA_3x3_2mm/CytAssist_11mm_FFPE_Mouse_TMA_3x3_2mm_image.tif

# Download microscope image file to datasets folder
wget -O datasets/CytAssist_FFPE_Mouse_TMA_3x3_2mm_microscope.tif https://cf.10xgenomics.com/samples/spatial-exp/2.0.1/CytAssist_11mm_FFPE_Mouse_TMA_3x3_2mm/CytAssist_11mm_FFPE_Mouse_TMA_3x3_2mm_tissue_image.tif
Resolving cf.10xgenomics.com (cf.10xgenomics.com)... 104.18.0.173, 104.18.1.173, 2606:4700::6812:1ad, ...
Connecting to cf.10xgenomics.com (cf.10xgenomics.com)|104.18.0.173|:443... connected.
HTTP request sent, awaiting response... 200 OK
Length: 7549905376 (7.0G) [image/tiff]
Saving to: ‘datasets/CytAssist_FFPE_Mouse_TMA_3x3_2mm_microscope.tif’

20% [============>                                                     ] 1,568,249,675 37.5MB/s  eta 2m 39s
Since the example dataset is based on a mouse tissue section, we can download the latest version of the mouse transcriptome reference from the Downloads page. Here, the curl download option is highlighted.
# Download mouse reference
curl -O https://cf.10xgenomics.com/supp/spatial-exp/refdata-gex-mm10-2020-A.tar.gz
% Total    % Received % Xferd  Average Speed   Time    Time     Time  Current
                                 Dload  Upload   Total   Spent    Left  Speed
  1 9835M    1  158M    0     0  34.1M      0  0:04:48  0:00:04  0:04:44 34.1M
Since the tissue cores are FFPE tissue samples, the assay uses a pair of oligonucleotide probes targeting protein coding genes. In addition to the reference transcriptome, spaceranger count also requires the species-specific probe set reference file in CSV format to enable analysis of FFPE samples. You can either download the probe set reference from the 10x Genomics support website or use the probe set references prebundled in Space Ranger.
# Download mouse probe set reference from support website
curl -O https://cf.10xgenomics.com/supp/spatial-exp/probeset/Visium_Mouse_Transcriptome_Probe_Set_v1.0_mm10-2020-A.csv
# Space Ranger 2.0.1 comes bundled with probe set files
## Source mouse probe set reference
~/spaceranger_tutorial/spaceranger-2.0.1/probe_sets/Visium_Mouse_Transcriptome_Probe_Set_v1.0_mm10-2020-A.csv
% Total    % Received % Xferd  Average Speed   Time    Time     Time  Current
                                 Dload  Upload   Total   Spent    Left  Speed
100 2257k  100 2257k    0     0  5579k      0 --:--:-- --:--:-- --:--:-- 5587k
In this tutorial, we will use the path associated with the first option.
After successful download of the all the required files, the contents of the tar files need to be extracted before moving onto the next steps.
# Extract sample FASTQ files
tar -xvf datasets/CytAssist_11mm_FFPE_Mouse_TMA_3x3_2mm_fastqs.tar -C datasets/ && rm datasets/CytAssist_11mm_FFPE_Mouse_TMA_3x3_2mm_fastqs.tar

# Extract mouse reference transcriptome
tar -xzvf refdata-gex-mm10-2020-A.tar.gz && rm refdata-gex-mm10-2020-A.tar.gz
# Sample FASTQ files
CytAssist_11mm_FFPE_Mouse_TMA_3x3_2mm_fastqs/
CytAssist_11mm_FFPE_Mouse_TMA_3x3_2mm_fastqs/CytAssist_11mm_FFPE_Mouse_TMA_3x3_2mm_S1_L001_I1_001.fastq.gz
CytAssist_11mm_FFPE_Mouse_TMA_3x3_2mm_fastqs/CytAssist_11mm_FFPE_Mouse_TMA_3x3_2mm_S1_L001_I2_001.fastq.gz
CytAssist_11mm_FFPE_Mouse_TMA_3x3_2mm_fastqs/CytAssist_11mm_FFPE_Mouse_TMA_3x3_2mm_S1_L001_R1_001.fastq.gz
CytAssist_11mm_FFPE_Mouse_TMA_3x3_2mm_fastqs/CytAssist_11mm_FFPE_Mouse_TMA_3x3_2mm_S1_L001_R2_001.fastq.gz
...

# Reference mouse transcriptome
refdata-gex-mm10-2020-A/
refdata-gex-mm10-2020-A/fasta/
refdata-gex-mm10-2020-A/fasta/genome.fa
...
Successful extraction will create two additional folders, highlighted in bold, within the working directory.
spaceranger_tutorial
├── datasets
│   ├── CytAssist_11mm_FFPE_Mouse_TMA_3x3_2mm_fastqs
│   ├── CytAssist_FFPE_Mouse_TMA_3x3_2mm_cytaimage.tif
│   └── CytAssist_FFPE_Mouse_TMA_3x3_2mm_microscope.tif
├── refdata-gex-mm10-2020-A
├── Visium_Mouse_Transcriptome_Probe_Set_v1.0_mm10-2020-A.csv
└── spaceranger-2.0.1
In this workflow, the tissue cores are considered as a single sample.
We will run the pipeline in our working directory spaceranger_tutorial assuming the same directory structure as shown previously. The input folder paths below reflect this choice.
In case you have a different set up, amend the paths accordingly before running the pipeline to avoid any errors. The easiest method to customize would be to copy the code below in any text editor of your choice (e.g. notepad++), edit and paste it back to the terminal. The example code is set up for the tissue core corresponding to mouse brain replicate one. Refer to the Command-line argument reference section on the CytAssist Spatial Gene Expression page for more details.
spaceranger count --id="CytAssist_11mm_FFPE_Mouse_TMA_3x3_2mm" \
                --description="Gene expression library of Mouse Tissue Microarray (CytAssist FFPE) using the Mouse Whole Transcriptome Probe Set of 9 Samples with 2mm Spacing" \
                --transcriptome=refdata-gex-mm10-2020-A \
                --probe-set=Visium_Mouse_Transcriptome_Probe_Set_v1.0_mm10-2020-A.csv \
                --fastqs=datasets/CytAssist_11mm_FFPE_Mouse_TMA_3x3_2mm_fastqs \
                --cytaimage=datasets/CytAssist_FFPE_Mouse_TMA_3x3_2mm_cytaimage.tif \
                --image=datasets/CytAssist_FFPE_Mouse_TMA_3x3_2mm_microscope.tif \
                --slide=V52Y10-344 \
                --area=A \
                --localcores=16 \
                --localmem=128
For compute platforms connected to the internet, spaceranger uses the value of the --slide argument to download automatically the slide layout file in gpr format.
spaceranger count --id="CytAssist_11mm_FFPE_Mouse_TMA_3x3_2mm" \
                --description="Gene expression library of Mouse Tissue Microarray (CytAssist FFPE) using the Mouse Whole Transcriptome Probe Set of 9 Samples with 2mm Spacing" \
                --transcriptome=refdata-gex-mm10-2020-A \
                --probe-set=Visium_Mouse_Transcriptome_Probe_Set_v1.0_mm10-2020-A.csv \
                --fastqs=datasets/CytAssist_11mm_FFPE_Mouse_TMA_3x3_2mm_fastqs \
                --cytaimage=datasets/CytAssist_FFPE_Mouse_TMA_3x3_2mm_cytaimage.tif \
                --image=datasets/CytAssist_FFPE_Mouse_TMA_3x3_2mm_microscope.tif \
                --slide=V52Y10-344 \
                --slidefile=V52Y10-344.gpr \
                --area=A \
                --localcores=16 \
                --localmem=128
In absence of internet connectivity to, the compute platform, you can download this specific slide layout file in gpr format and provide it to spaceranger using the --slidefile argument.
After the run is completed, the working directory will have a new folder named CytAssist_11mm_FFPE_Mouse_TMA_3x3_2mm (value provided to --id argument) that contains all the metadata and outputs generated from the spaceranger count pipeline. The subfolder named outs contains the main pipeline output files.
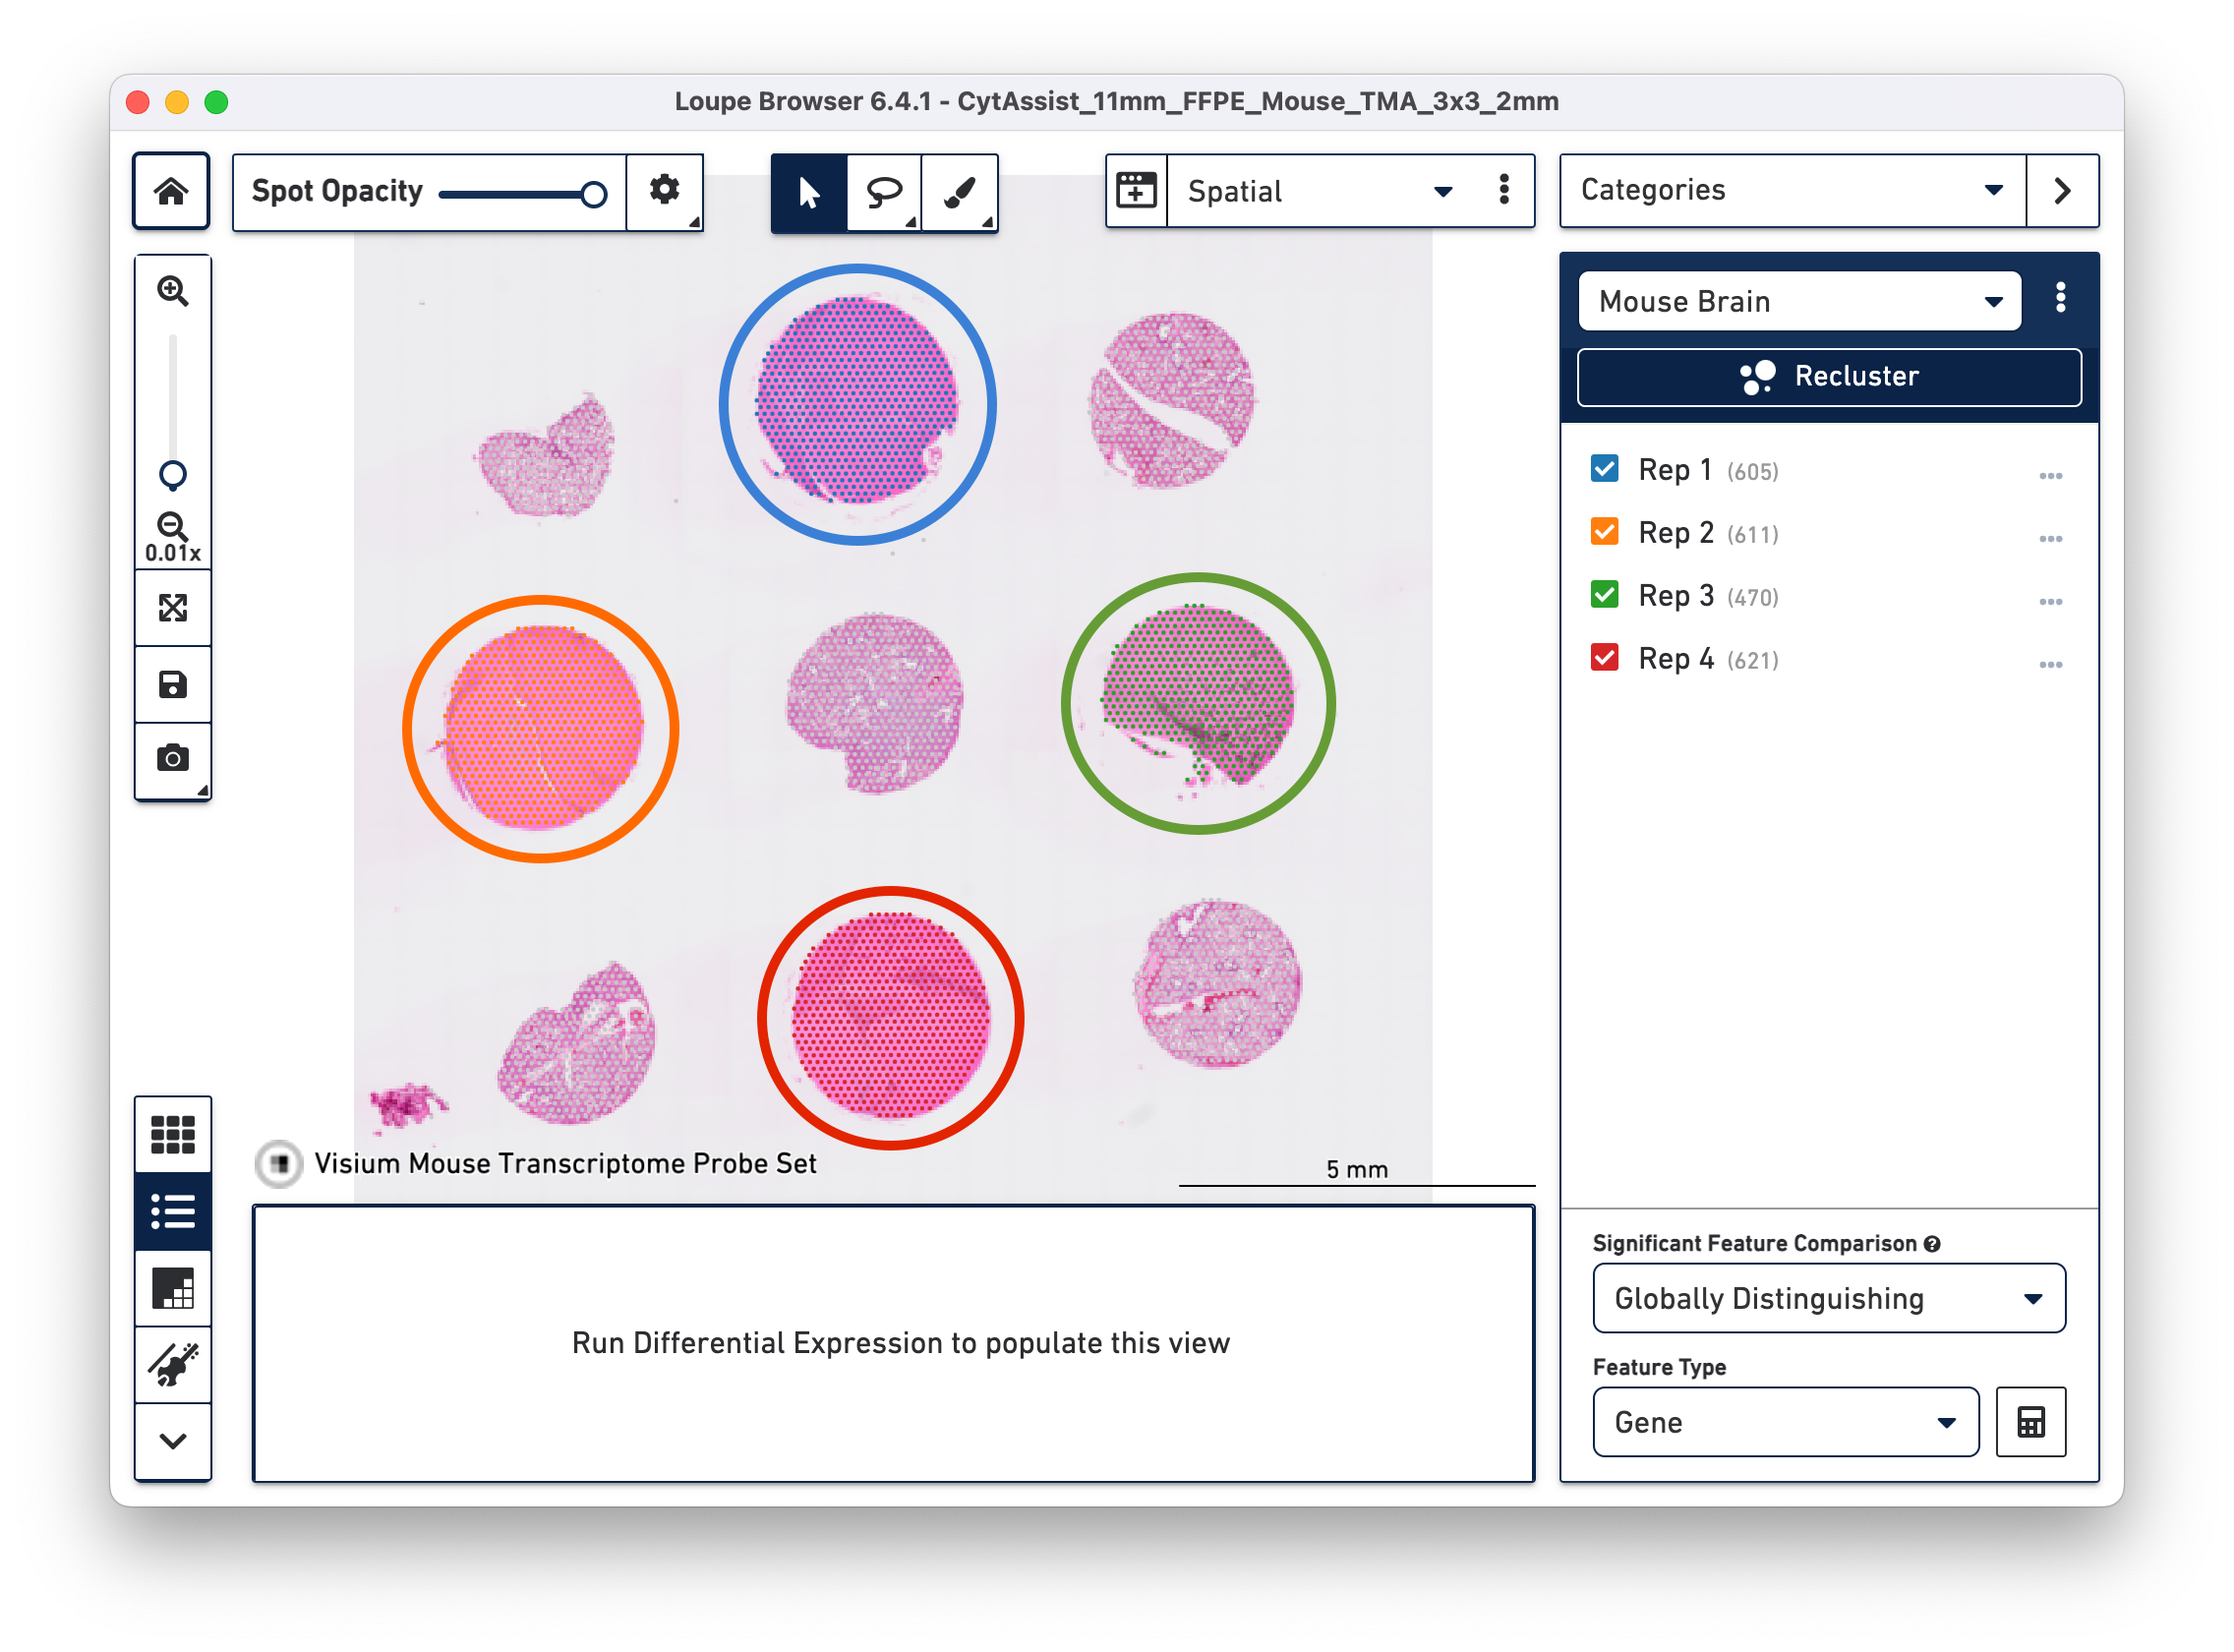
By manually selecting the tissue cores from a given tissue type, it is possible to redo the Differential Expression analysis and clustering in Loupe Browser using the Spatial Reclustering workflow.
a. Open the cloupe.cloupe in the latest version of Loupe Browser. Click on ![]() to select one tissue core at a time. In this tutorial, all the tissue cores from mouse brain are selected for demonstration. Assign the selected spots to a new Category called Mouse Brain, and a new Cluster called Rep 1. Once this is saved, you are taken to Category mode.
to select one tissue core at a time. In this tutorial, all the tissue cores from mouse brain are selected for demonstration. Assign the selected spots to a new Category called Mouse Brain, and a new Cluster called Rep 1. Once this is saved, you are taken to Category mode.
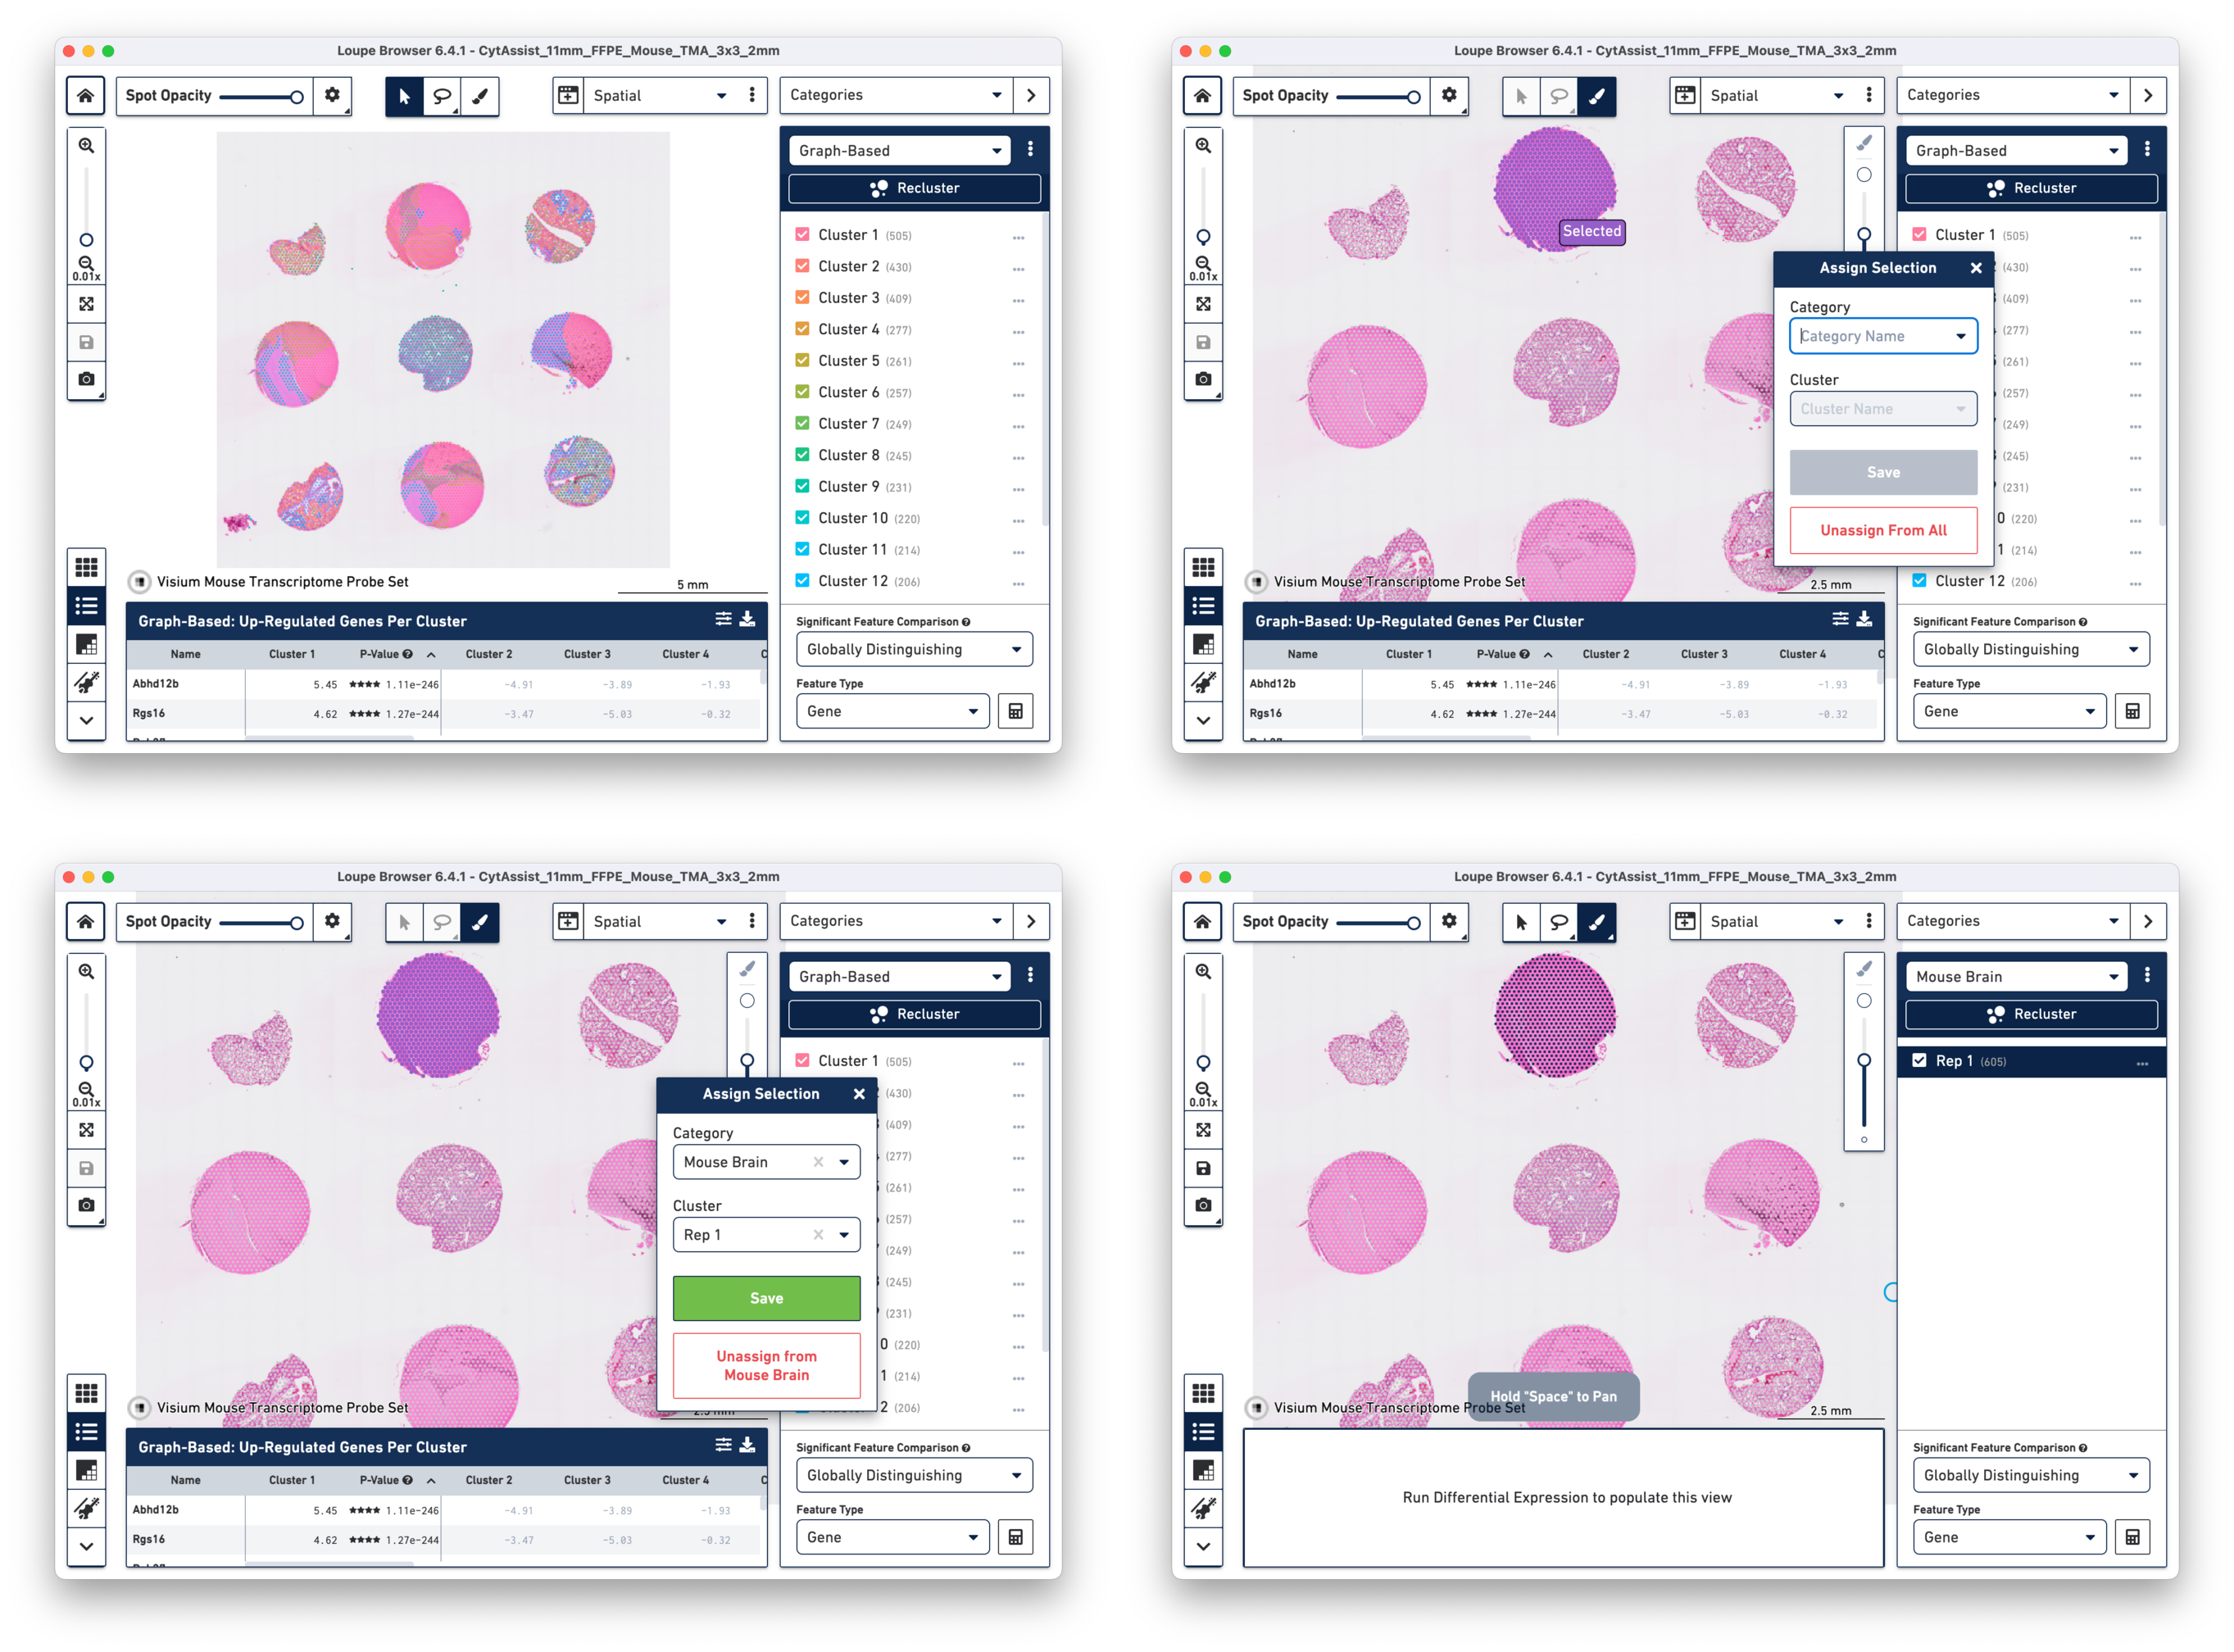
b. Repeat the steps to select the spots until all tissue cores from mouse brain are selected and assigned to the custom category of Mouse Brain.
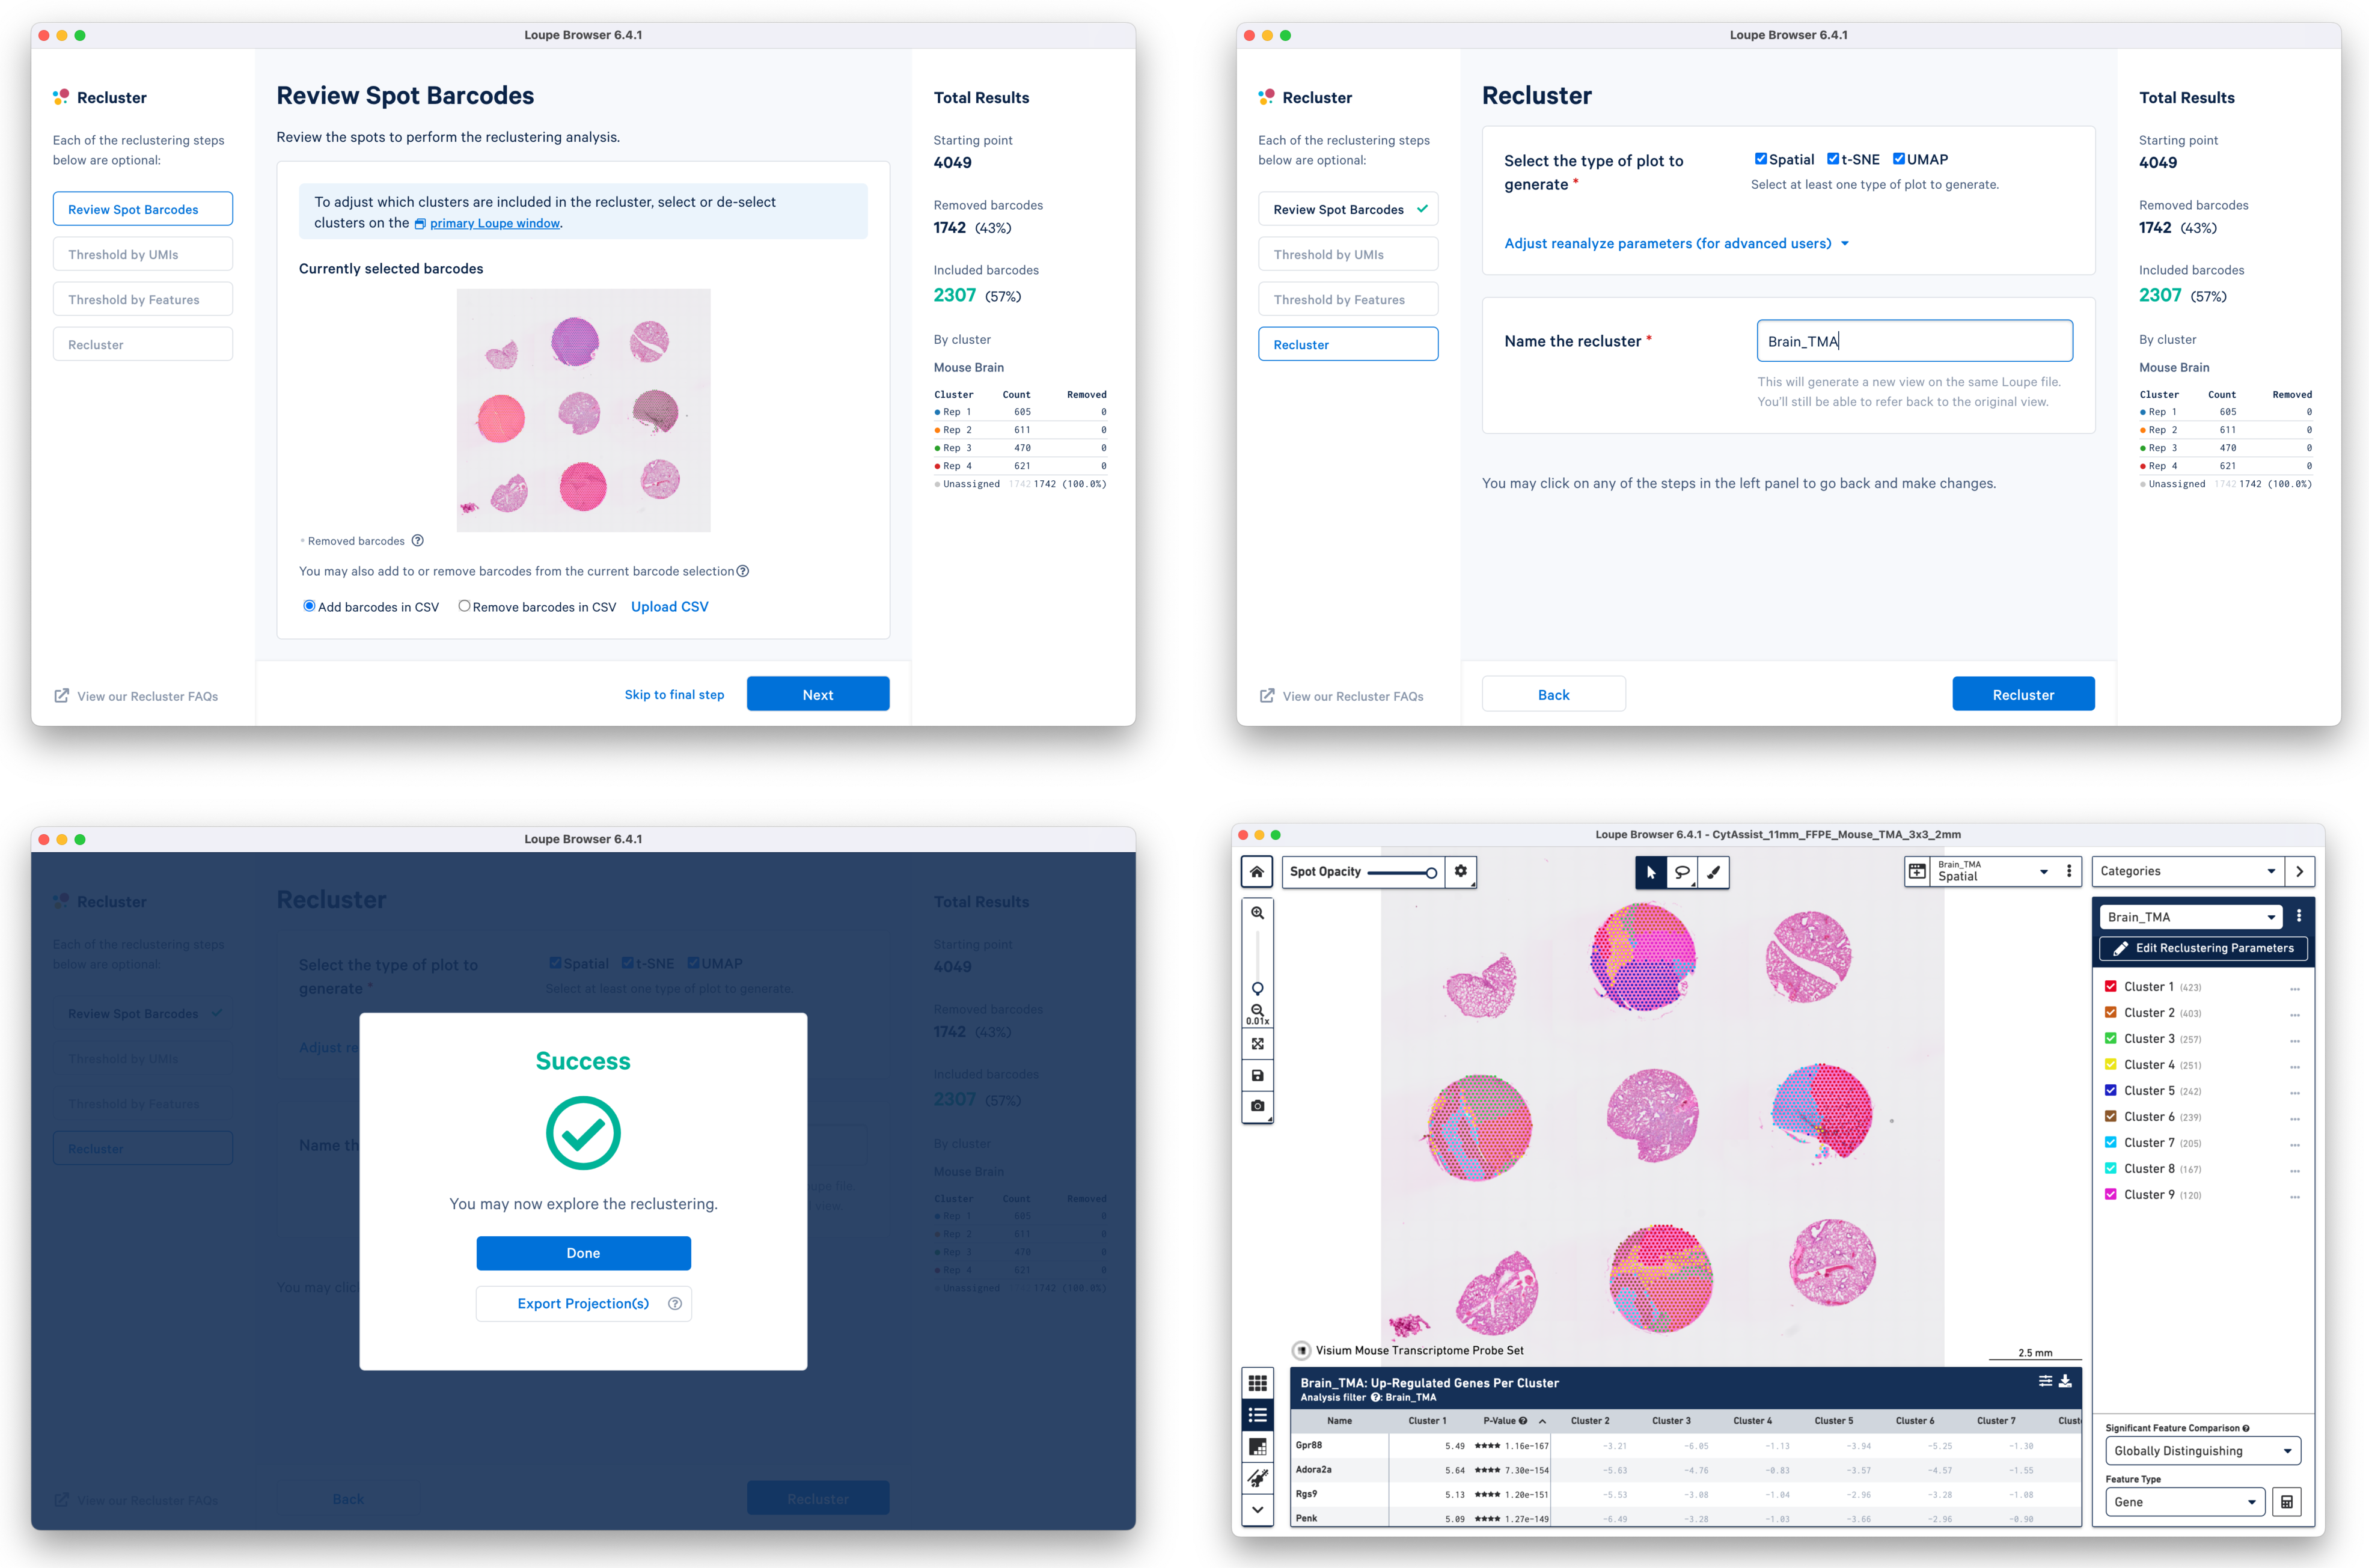
c. Start Reclustering by clicking which opens in a new window. For this tutorial, we choose to skip filtering steps.
On the Recluster page, all plots types are selected with no change to the default plot parameters. A unique name for the recluster is given i.e. Brain_TMA. Click to initiate reclustering algorithms. In the background, Loupe will run virtually the same PCA, Louvain clustering, t-SNE, and UMAP algorithms as the Space Ranger pipeline.
Click to close the recluster window, and update the primary Loupe window to the new projection and category. You now have mouse brain-specific clusters that can be used to calculate differential expression. The color assignments for the clusters have been manually updated from defaults in this example.
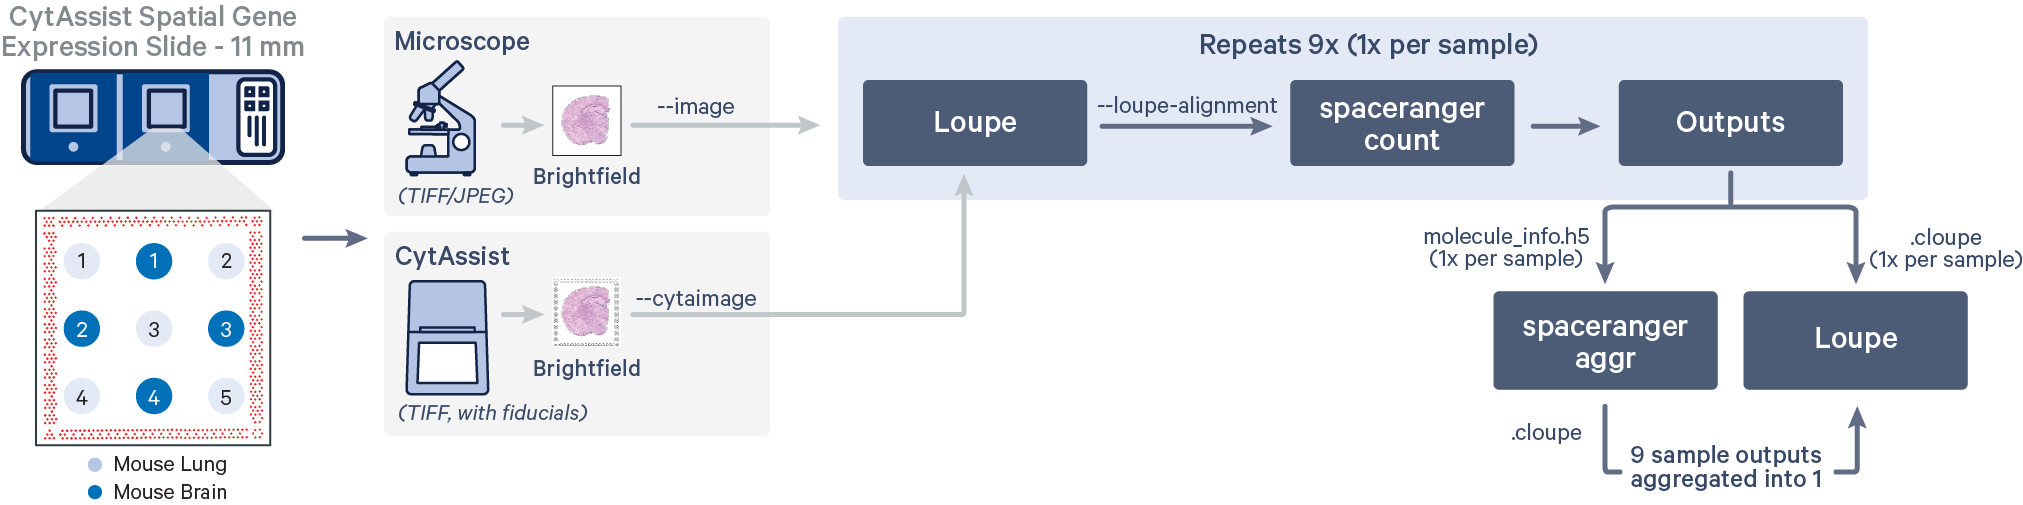
In this workflow, each of the tissue cores are considered as independent samples.
Loupe Browser is used to generate the manual alignment file in JSON format that contains information about the CytAssist image alignment and the fiducial alignment.
a. In the latest Loupe Browser, select the CytAssist Image Alignment workflow and upload both the CytAssist and the microscope images. Follow the prompts to select landmarks, and perform Auto-refine if necessary.
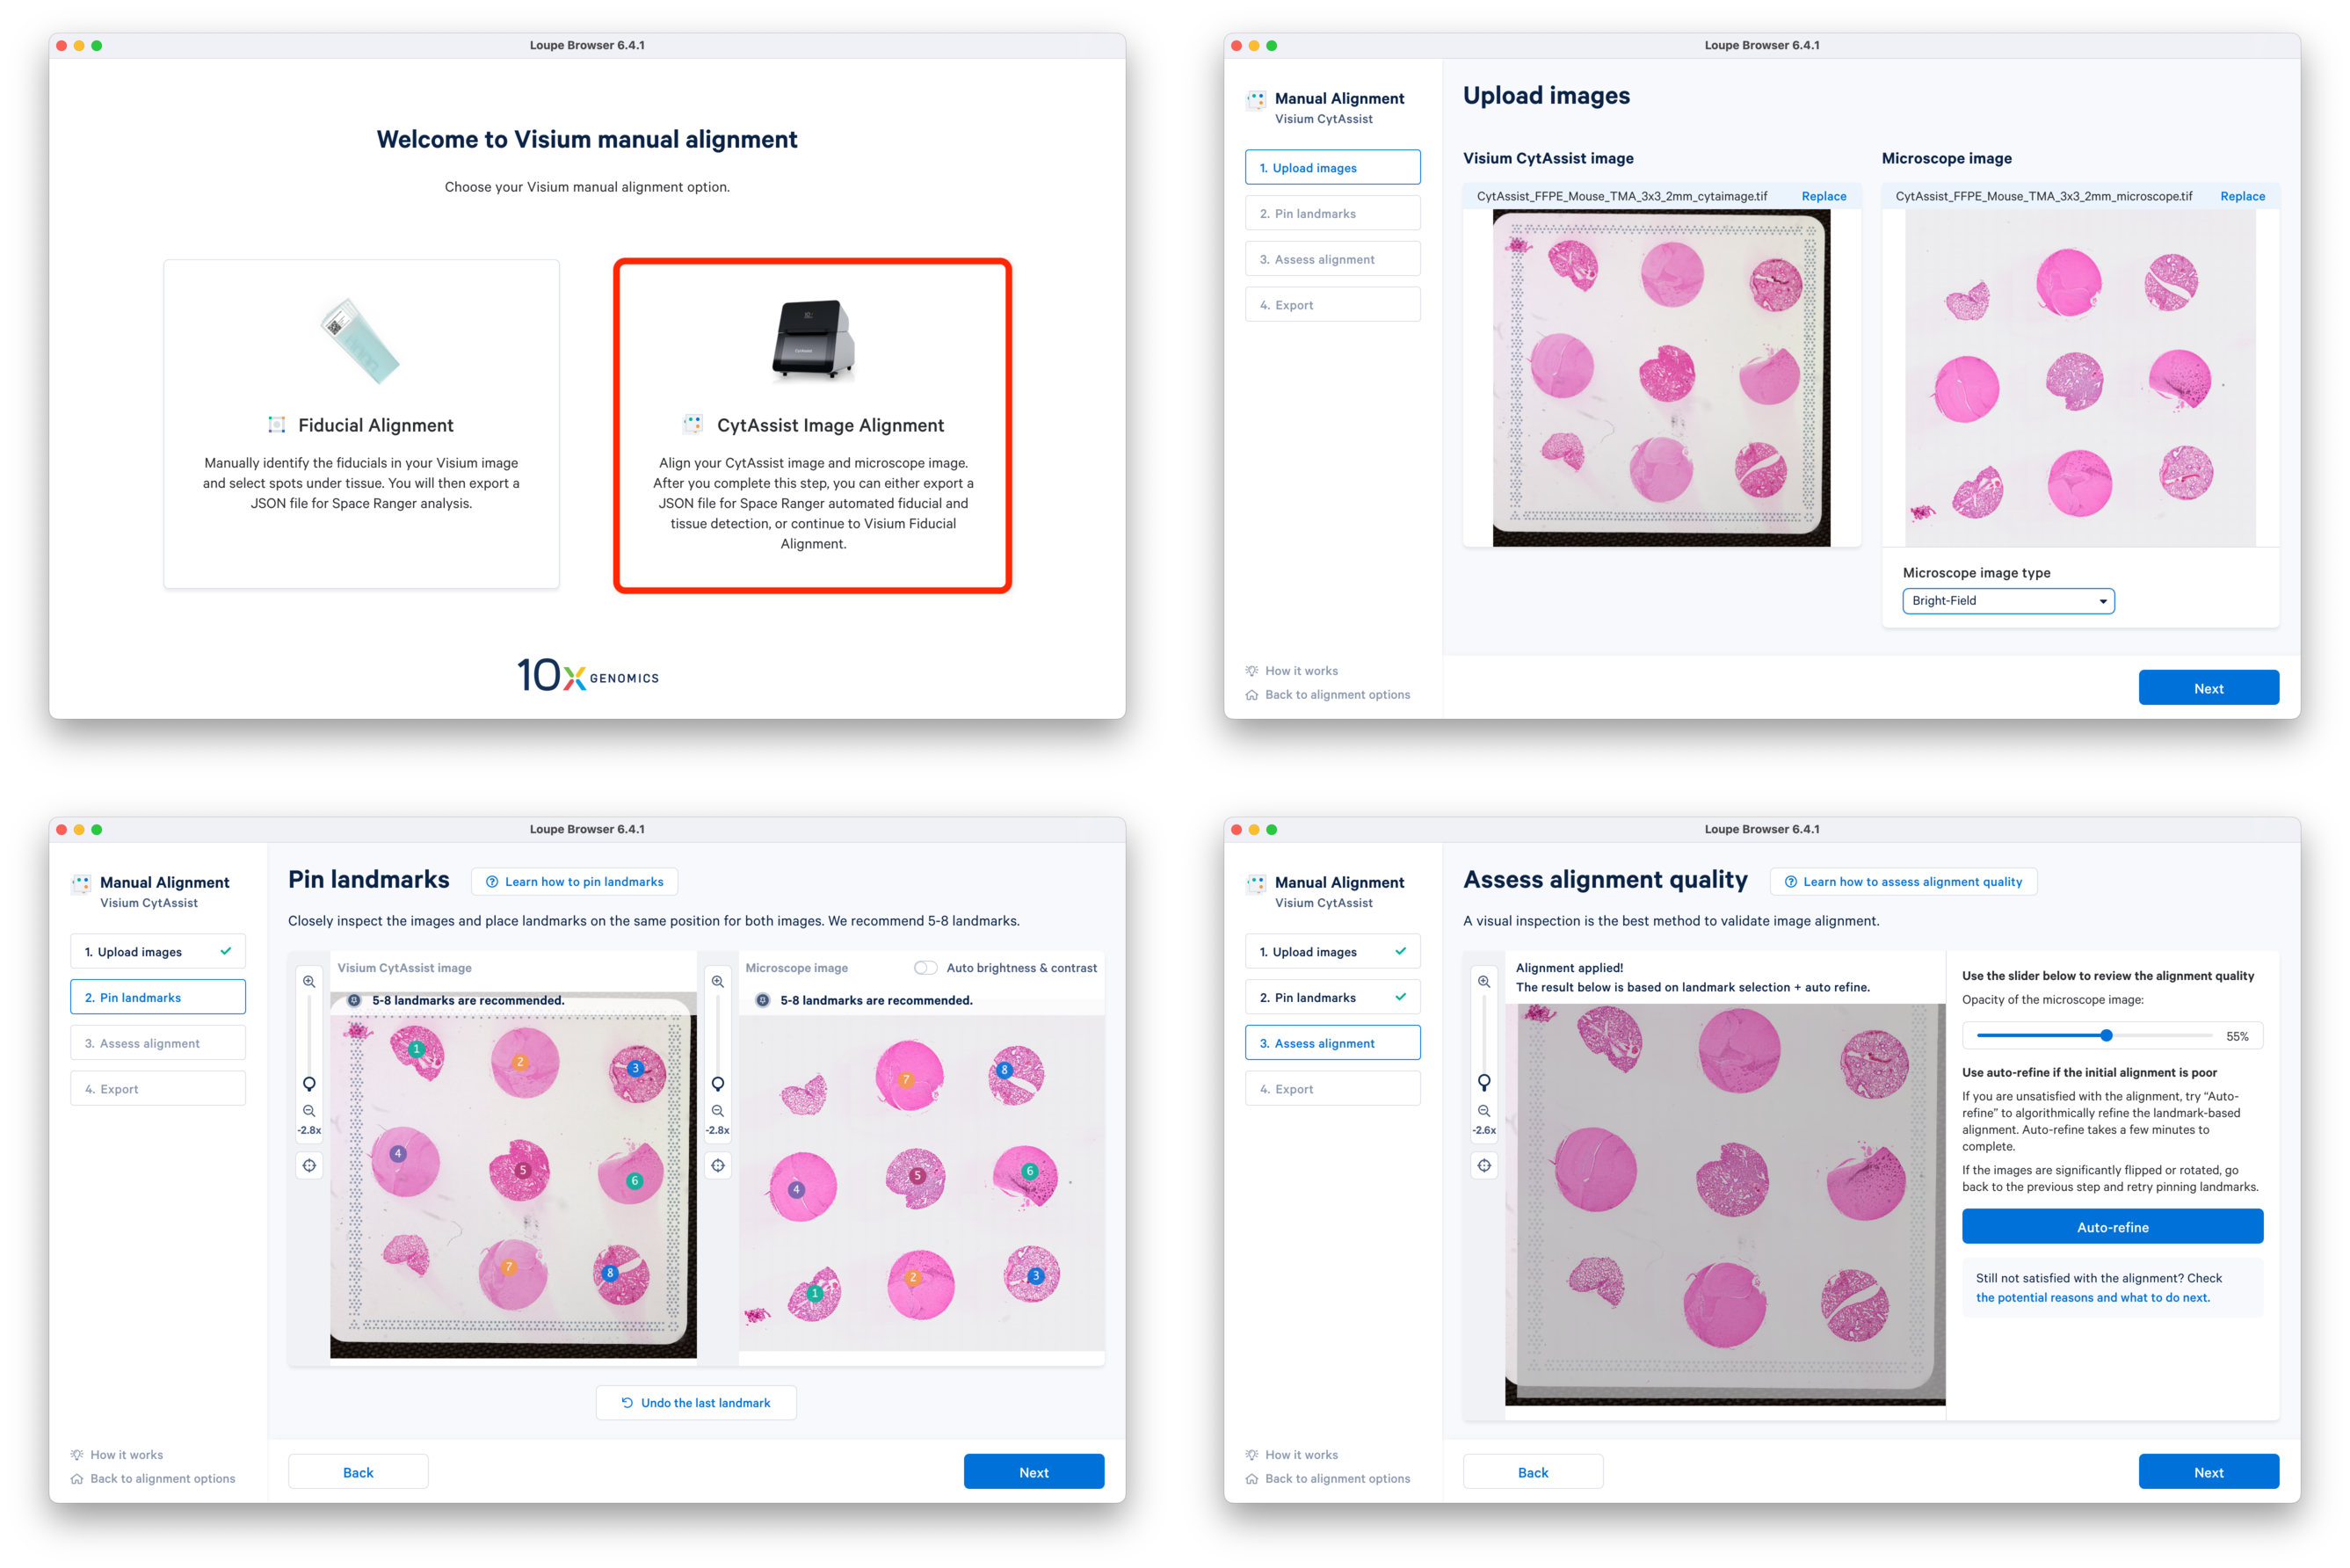
b. Continue to the Fiducial Alignment workflow where the CytAssist image is automatically loaded. Enter the slide information, identify, and adjust the fiducials. In the Identify tissue step, select tissue-covered spots corresponding to only one tissue core at a time. Export the alignment JSON file and save it corresponding to the tissue core replicate (e.g. CytAssist_FFPE_Mouse_TMA_3x3_2mm_Brain_Rep1.json). You can go back to the previous step, delete the selected spots, and redo the tissue spot selection for another tissue core. This is repeated until manual alignment files for all nine tissue cores are obtained.
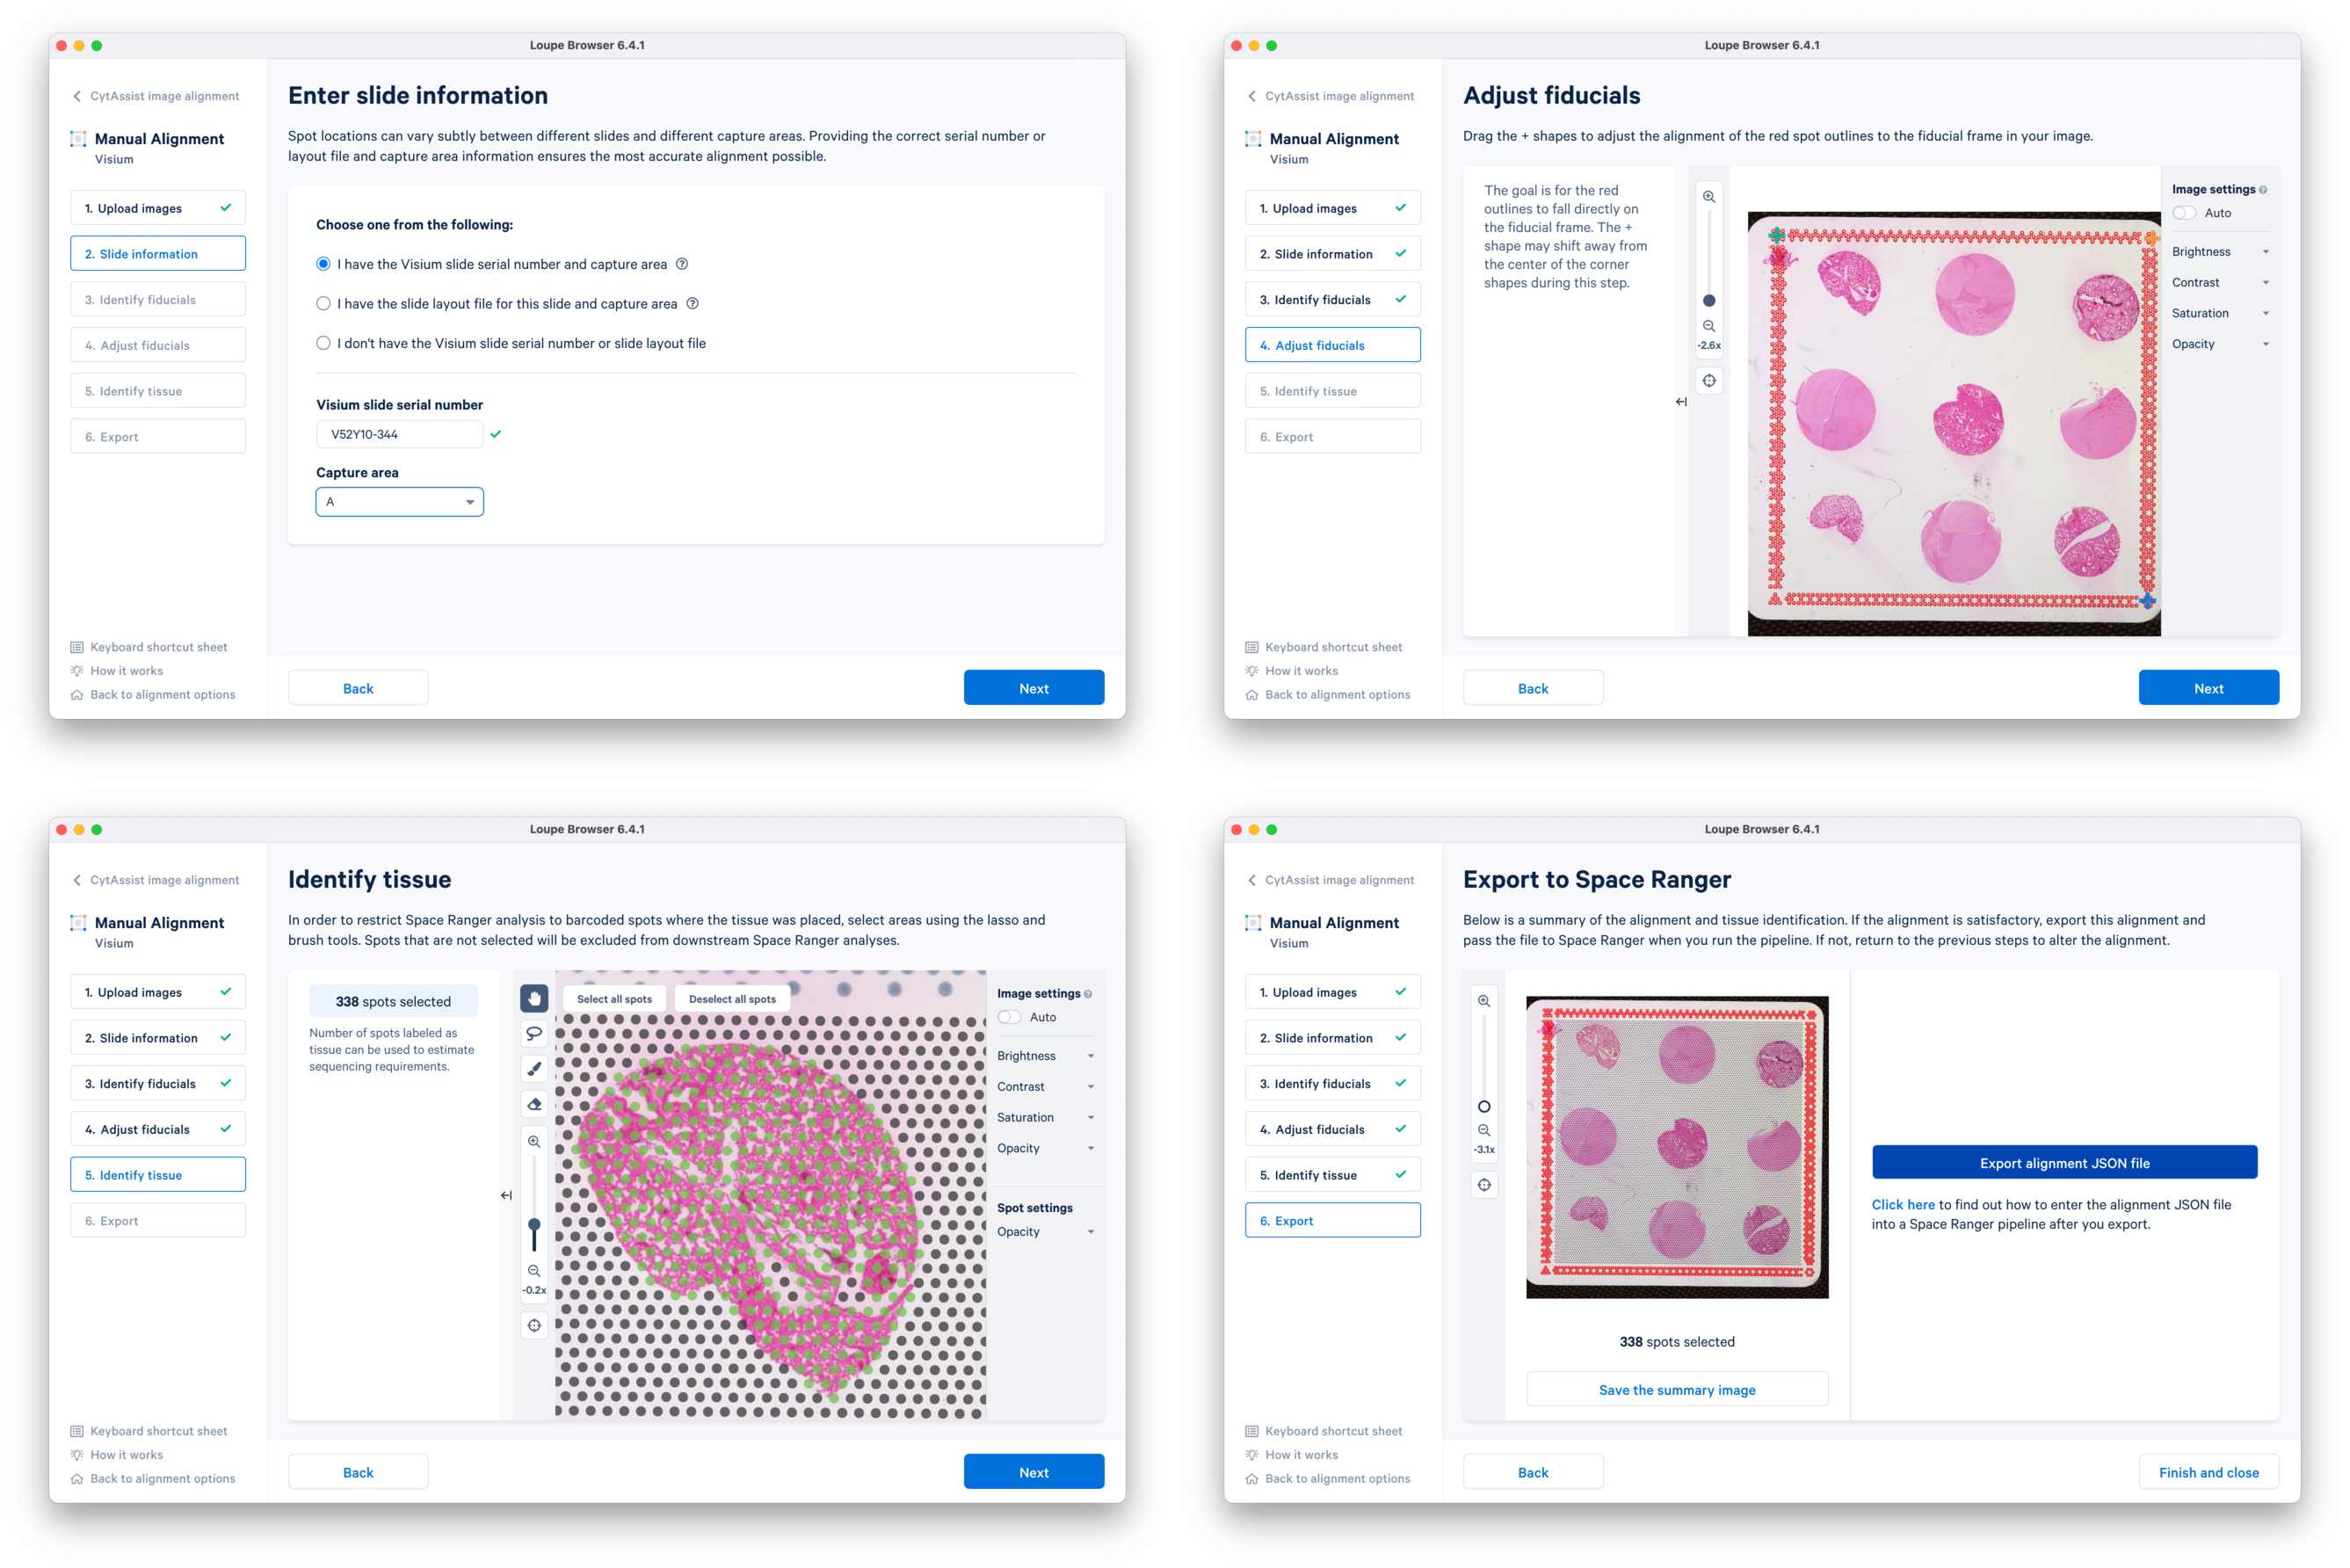
c. Since the alignment files were generated a different machine (macOS or Windows), the files need to be copied into the spaceranger_tutorial folder in the compute environment where spaceranger is installed. The code in red indicates user-specific inputs.
# Create alignment folder in spaceranger_tutorial folder
mkdir alignment

# Copy alignment JSON files to alignment folder
## This command is run on the local machine
scp /PATH/TO/LOCAL FOLDER/*.json username@example:/PATH/TO/spaceranger_tutorial/alignment
After successful copy, the working directory is updated to include the new folder with the alignment files.
spaceranger_tutorial
├── alignment
│   ├── CytAssist_FFPE_Mouse_TMA_3x3_2mm_Brain_Rep1.json
│   ├── CytAssist_FFPE_Mouse_TMA_3x3_2mm_Brain_Rep2.json
│   ├── CytAssist_FFPE_Mouse_TMA_3x3_2mm_Brain_Rep3.json
│   ├── CytAssist_FFPE_Mouse_TMA_3x3_2mm_Brain_Rep4.json
│   ├── CytAssist_FFPE_Mouse_TMA_3x3_2mm_Lung_Rep1.json
│   ├── CytAssist_FFPE_Mouse_TMA_3x3_2mm_Lung_Rep2.json
│   ├── CytAssist_FFPE_Mouse_TMA_3x3_2mm_Lung_Rep3.json
│   ├── CytAssist_FFPE_Mouse_TMA_3x3_2mm_Lung_Rep4.json
│   └── CytAssist_FFPE_Mouse_TMA_3x3_2mm_Lung_Rep5.json
├── datasets
│   ├── CytAssist_11mm_FFPE_Mouse_TMA_3x3_2mm_fastqs
│   ├── CytAssist_FFPE_Mouse_TMA_3x3_2mm_cytaimage.tif
│   └── CytAssist_FFPE_Mouse_TMA_3x3_2mm_microscope.tif
├── refdata-gex-mm10-2020-A
├── Visium_Mouse_Transcriptome_Probe_Set_v1.0_mm10-2020-A.csv
└── spaceranger-2.0.1
We will run the pipeline in our working directory spaceranger_tutorial assuming the same directory structure as shown in the previous step. The input folder paths below reflect this choice.
In case you have a different setup, amend the paths accordingly before running the pipeline to avoid any errors. The easiest method to customize would be to copy the code below in any text editor of your choice (e.g. notepad++), edit and paste it back to the terminal. The example code is set up for the tissue core corresponding to mouse brain replicate one. Refer to the Command-line argument reference section on the CytAssist Spatial Gene Expression page for more details.
spaceranger count --id="CytAssist_FFPE_Mouse_TMA_3x3_2mm_Brain_Rep1" \
                    --description="Gene expression library of Mouse Brain (CytAssist FFPE) using the Mouse Whole Transcriptome Probe Set of 9 Samples with 2mm Spacing - Brain Replicate 1" \
                    --transcriptome=refdata-gex-mm10-2020-A \
                    --probe-set=Visium_Mouse_Transcriptome_Probe_Set_v1.0_mm10-2020-A.csv \
                    --fastqs=datasets/CytAssist_11mm_FFPE_Mouse_TMA_3x3_2mm_fastqs \
                    --cytaimage=datasets/CytAssist_FFPE_Mouse_TMA_3x3_2mm_cytaimage.tif \
                    --image=datasets/CytAssist_FFPE_Mouse_TMA_3x3_2mm_microscope.tif \
                    --loupe-alignment=alignment/CytAssist_FFPE_Mouse_TMA_3x3_2mm_Brain_Rep1.json \
                    --slide=V52Y10-344 \
                    --area=A \
                    --localcores=16 \
                    --localmem=128
For compute platforms connected to the internet, spaceranger uses the value of the --slide argument to download automatically the slide layout file in gpr format.
spaceranger count --id="CytAssist_FFPE_Mouse_TMA_3x3_2mm_Brain_Rep1" \
                    --description="Gene expression library of Mouse Brain (CytAssist FFPE) using the Mouse Whole Transcriptome Probe Set of 9 Samples with 2mm Spacing - Brain Replicate 1" \
                    --transcriptome=refdata-gex-mm10-2020-A \
                    --probe-set=Visium_Mouse_Transcriptome_Probe_Set_v1.0_mm10-2020-A.csv \
                    --fastqs=datasets/CytAssist_11mm_FFPE_Mouse_TMA_3x3_2mm_fastqs \
                    --cytaimage=datasets/CytAssist_FFPE_Mouse_TMA_3x3_2mm_cytaimage.tif \
                    --image=datasets/CytAssist_FFPE_Mouse_TMA_3x3_2mm_microscope.tif \
                    --loupe-alignment=alignment/CytAssist_FFPE_Mouse_TMA_3x3_2mm_Brain_Rep1.json \
                    --slide=V52Y10-344 \
                    --slidefile=V52Y10-344.gpr \
                    --area=A \
                    --localcores=16 \
                    --localmem=128
In absence of internet connectivity to the compute platform, you can download this specific slide layout file in gpr format and provide it to spaceranger using the --slidefile argument.
The tissue core level outputs for each spaceranger count run are identical to that generated for all tissue core sections.
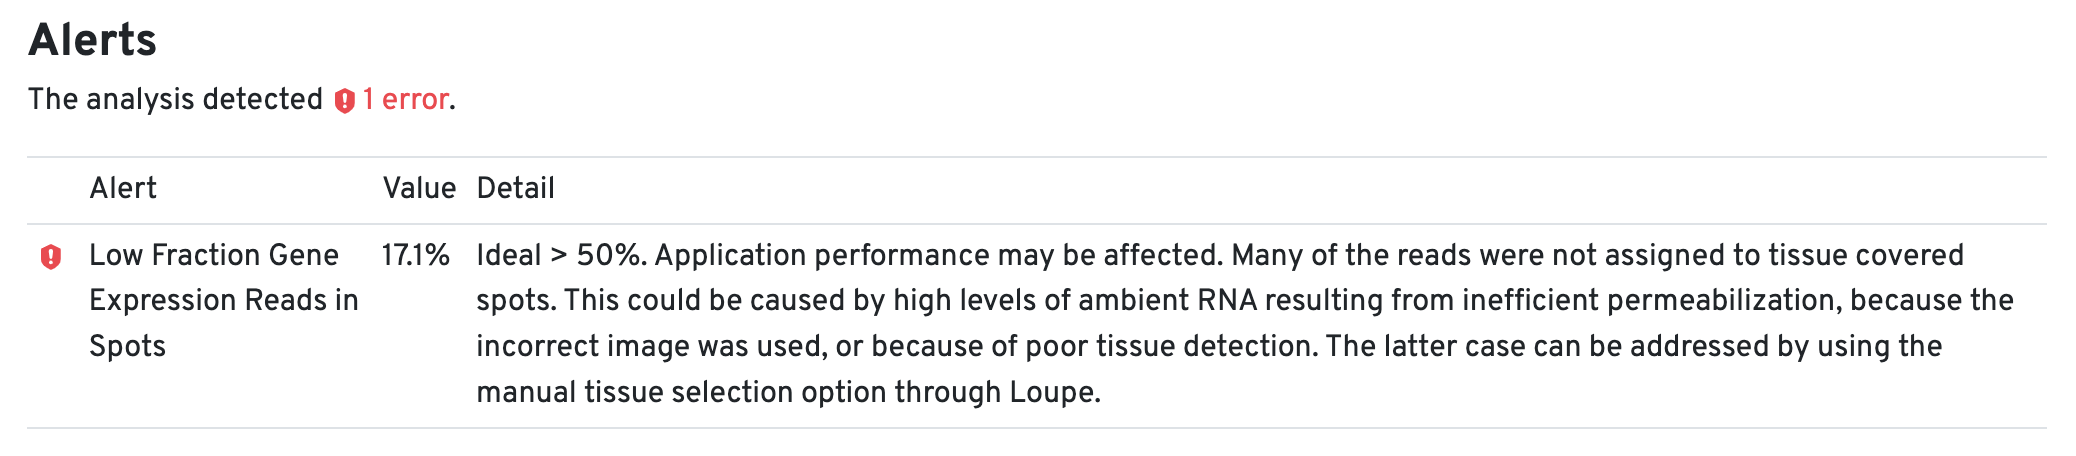
An alert for the Low Fraction Gene Expression Reads in Spots in the web summary file for each tissue core is expected due to the small tissue size.
|
Subsequently, all nine tissue cores are aggregated using spaceranger aggr to obtain a single matrix with sample-specific labeled barcodes useful for downstream analysis.
a. You need to create an aggregation CSV that lists the paths to all the individual tissue core molecule_info.h5, cloupe.cloupe files, and to the spatial folder. You can either make the CSV file in a text editor, or create it in Excel and export to CSV.
Remember to save the aggregate CSV within the working directory i.e. spaceranger_tutorial in this tutorial.
|
When you save it as a CSV, the result would look similar to that shown below. The code in red indicates user-specific inputs.
library_id,molecule_h5,cloupe_file,spatial_folder
Brain_Rep1,/path/to/CytAssist_FFPE_Mouse_TMA_3x3_2mm_Brain_Rep1/outs/molecule_info.h5,/path/to/CytAssist_FFPE_Mouse_TMA_3x3_2mm_Brain_Rep1/outs/cloupe.cloupe,/path/to/CytAssist_FFPE_Mouse_TMA_3x3_2mm_Brain_Rep1/outs/spatial
Brain_Rep2,/path/to/CytAssist_FFPE_Mouse_TMA_3x3_2mm_Brain_Rep2/outs/molecule_info.h5,/path/to/CytAssist_FFPE_Mouse_TMA_3x3_2mm_Brain_Rep2/outs/cloupe.cloupe,/path/to/CytAssist_FFPE_Mouse_TMA_3x3_2mm_Brain_Rep2/outs/spatial
Brain_Rep3,/path/to/CytAssist_FFPE_Mouse_TMA_3x3_2mm_Brain_Rep3/outs/molecule_info.h5,/path/to/CytAssist_FFPE_Mouse_TMA_3x3_2mm_Brain_Rep3/outs/cloupe.cloupe,/path/to/CytAssist_FFPE_Mouse_TMA_3x3_2mm_Brain_Rep3/outs/spatial
Brain_Rep4,/path/to/CytAssist_FFPE_Mouse_TMA_3x3_2mm_Brain_Rep4/outs/molecule_info.h5,/path/to/CytAssist_FFPE_Mouse_TMA_3x3_2mm_Brain_Rep4/outs/cloupe.cloupe,/path/to/CytAssist_FFPE_Mouse_TMA_3x3_2mm_Brain_Rep4/outs/spatial
Lung_Rep1,/path/to/CytAssist_FFPE_Mouse_TMA_3x3_2mm_Lung_Rep1/outs/molecule_info.h5,/path/to/CytAssist_FFPE_Mouse_TMA_3x3_2mm_Lung_Rep1/outs/cloupe.cloupe,/path/to/CytAssist_FFPE_Mouse_TMA_3x3_2mm_Lung_Rep1/outs/spatial
Lung_Rep2,/path/to/CytAssist_FFPE_Mouse_TMA_3x3_2mm_Lung_Rep2/outs/molecule_info.h5,/path/to/CytAssist_FFPE_Mouse_TMA_3x3_2mm_Lung_Rep2/outs/cloupe.cloupe,/path/to/CytAssist_FFPE_Mouse_TMA_3x3_2mm_Lung_Rep2/outs/spatial
Lung_Rep3,/path/to/CytAssist_FFPE_Mouse_TMA_3x3_2mm_Lung_Rep3/outs/molecule_info.h5,/path/to/CytAssist_FFPE_Mouse_TMA_3x3_2mm_Lung_Rep3/outs/cloupe.cloupe,/path/to/CytAssist_FFPE_Mouse_TMA_3x3_2mm_Lung_Rep3/outs/spatial
Lung_Rep4,/path/to/CytAssist_FFPE_Mouse_TMA_3x3_2mm_Lung_Rep4/outs/molecule_info.h5,/path/to/CytAssist_FFPE_Mouse_TMA_3x3_2mm_Lung_Rep4/outs/cloupe.cloupe,/path/to/CytAssist_FFPE_Mouse_TMA_3x3_2mm_Lung_Rep4/outs/spatial
Lung_Rep5,/path/to/CytAssist_FFPE_Mouse_TMA_3x3_2mm_Lung_Rep5/outs/molecule_info.h5,/path/to/CytAssist_FFPE_Mouse_TMA_3x3_2mm_Lung_Rep5/outs/cloupe.cloupe,/path/to/CytAssist_FFPE_Mouse_TMA_3x3_2mm_Lung_Rep5/outs/spatial
b. Set up the code and run the spaceranger aggr. Since the tissue cores are all on the same slide and sequenced to the same depth, the option to depth normalize, and can be set to --normalize=none.
spaceranger aggr --id="Aggregate_CytAssist_FFPE_TMA_3x3_2mm" \
                --description="Aggregate of Mouse Brain and Lung TMA with 2mm Spacing (CytAssist FFPE)" \
                --csv=Aggregate_CytAssist_FFPE_TMA_Mouse_Brain_Lung.csv \
                --normalize=none \
                --localcores=16 \
                --localmem=128