Cell Ranger6.4, printed on 04/06/2025
Goal: To identify genes that distinguish between the healthy controls and acute myeloid leukemia (AML) sample.
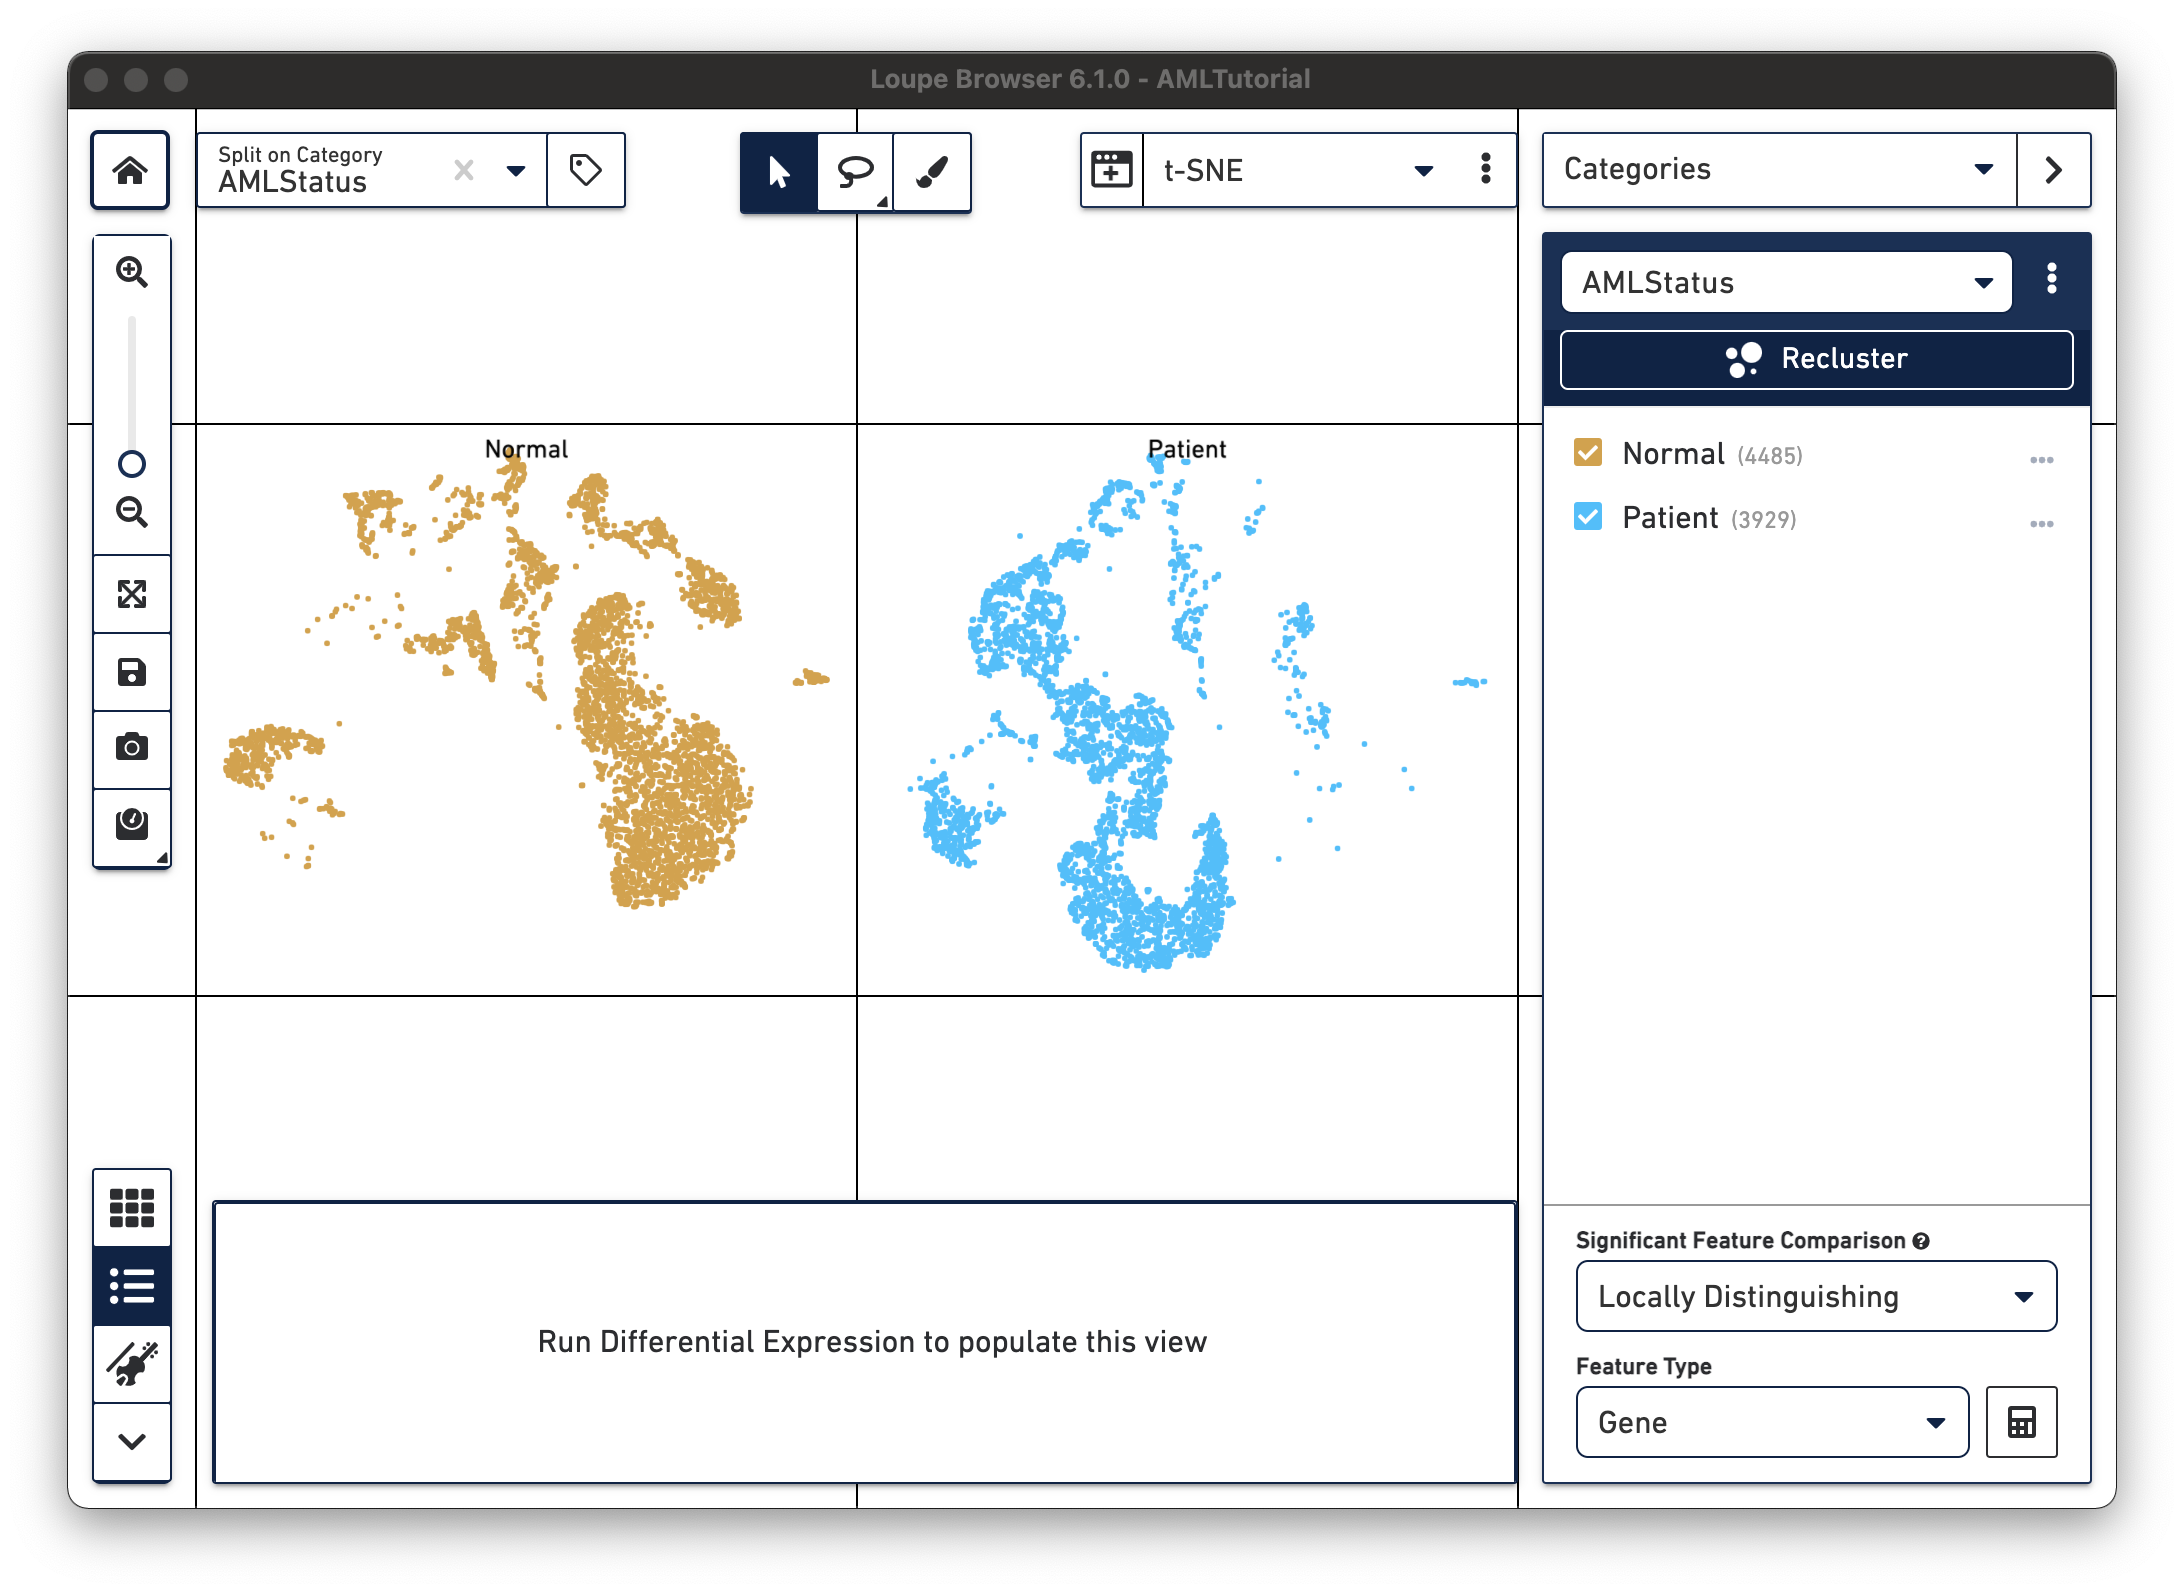
Switch into Categories mode in the Mode Selector. Click on the Category Selector at the top of the Mode Panel and select 'AMLStatus'. You can see that the cells are divided into 'Normal' and 'Patient' groups. Note: the AMLStatus was derived from the spreadsheet passed to cellranger aggr, as described here.
Next, split these groups of cells to visualize them separately. Split View enables you to view individual clusters from a projection in adjacent windows. The split view control is at the top left of the screen ('Split on Category...'). Click on the drop-down, and select 'AMLStatus' at the bottom of the menu. It should be bold, to indicate that it is the currently selected category.
To exit Split View, click on the 'x' next to the currently selected category in the split view menu. You may also toggle labels by clicking on the label icon next to the split view dropdown.
Next, find any genes that uniquely characterize these two groups. Loupe Browser uses the same statistical method as Cell Ranger to calculate differential gene expression.
Finding genes that uniquely characterize two groups is possible using the options at the bottom of the Categories mode panel. There are two options, Significant Feature Comparison and Feature Type. The AML Tutorial dataset only has gene features. We will choose between two comparison options:
For the Normal vs. Patient category, these are equivalent. However, if you want to compare the two Normal samples against each other within the LibraryID category (excluding the Patient sample), then you will need to choose Locally Distinguishing. On the other hand, if you want to find out what's unique about a single cluster of cells, you'll need to select Globally Distinguishing.
Select Locally Distinguishing this time. Click on the calculator button in the bottom right to begin the calculation. Depending on the number of cores on your machine and the speed of your hard drive, this should take between 3 and 15 seconds. For optimal differential expression performance, use Loupe Browser 6.0 or later.
| The time to complete a Significant Features analysis depends on the number of cells in the dataset, the number of clusters being compared, and the speed of your CPU and hard drive. When using Loupe Browser 6.0 and later, the recommendation is to limit calculating significant features to datasets of 1 million cells or less. Although you are able to proceed with the calculation for larger datasets, the calculation may take over 10 minutes and you may encounter unexpected behavior, such as crashing Loupe Browser or slowing down your computer. |
Once complete, a new data table and heatmap will appear in the data panel:
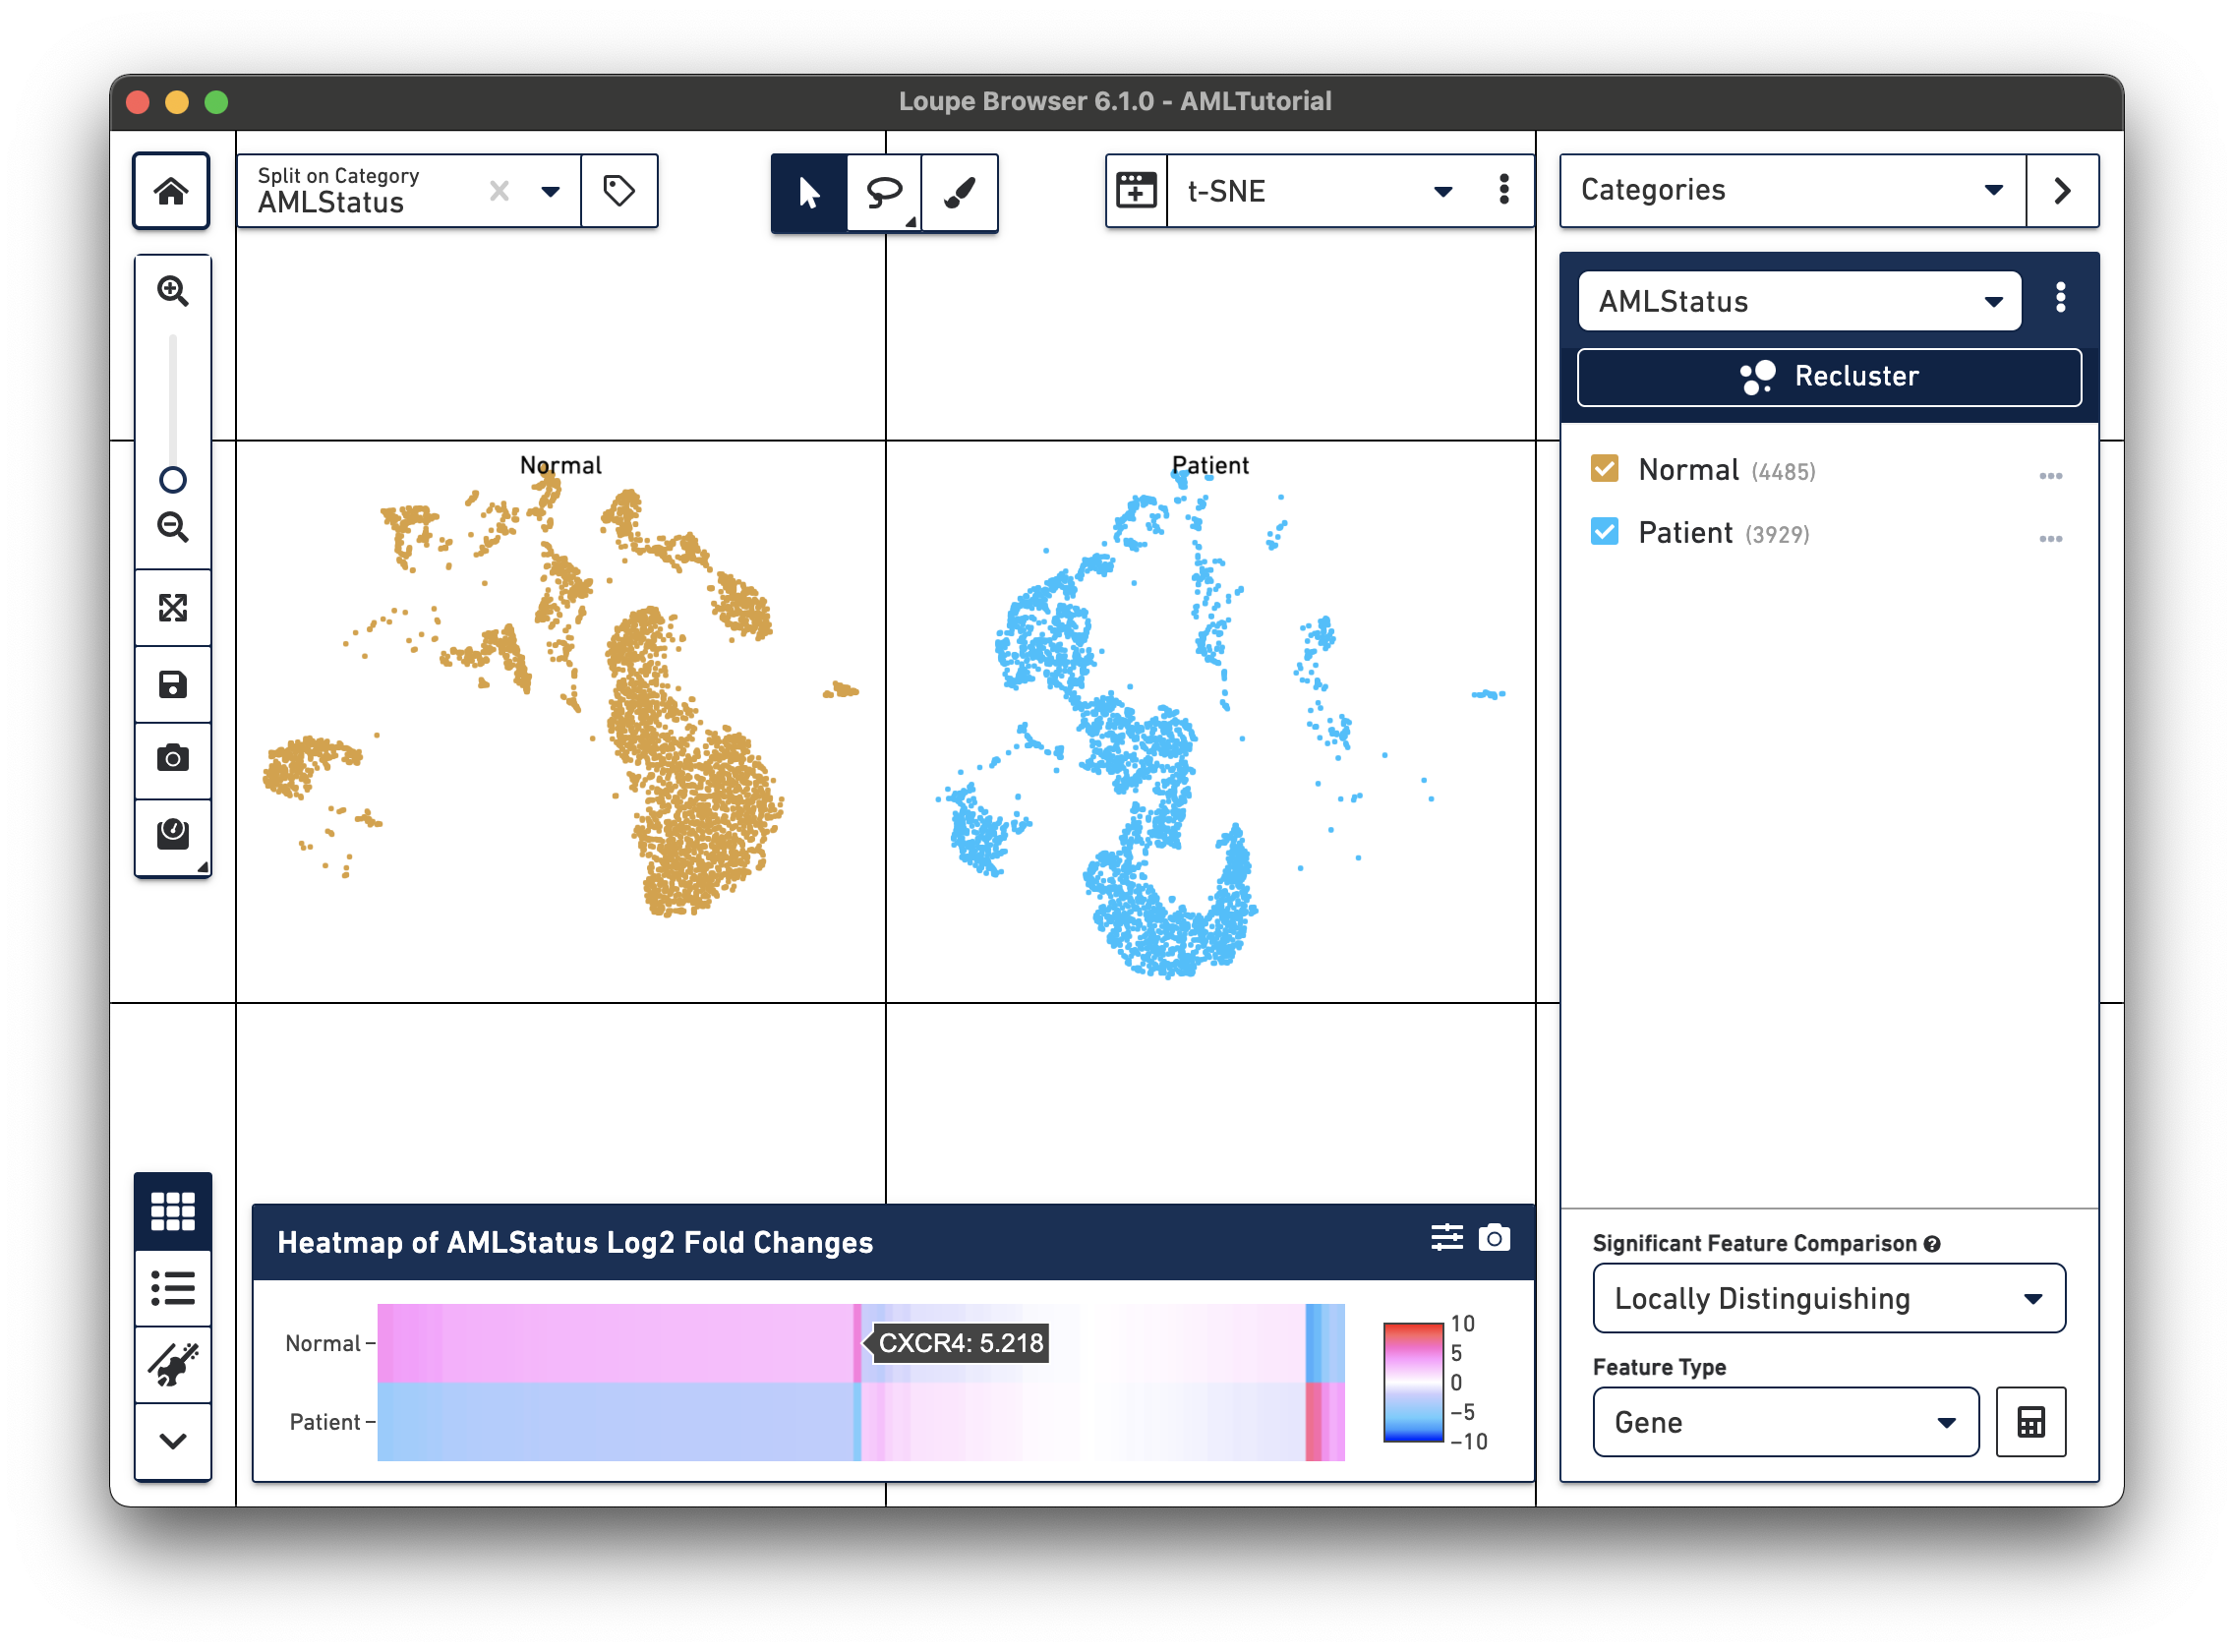
This heatmap displays the top up-regulated genes per cluster. Each column represents the level of expression of a significant feature, and each row represents a cluster. Grid cells are colored by a gene's log2 fold change in its cluster row, compared to the other clusters. Hovering over the columns will show the names of the features represented in each column.
By clicking on the Feature Table icon to the left of the heatmap, you'll be able to see significant gene information in a tabular view. For each cluster, you can view the most significantly up-regulated genes per cluster by p-value, or click the Options button above the Feature Table to filter by more options.
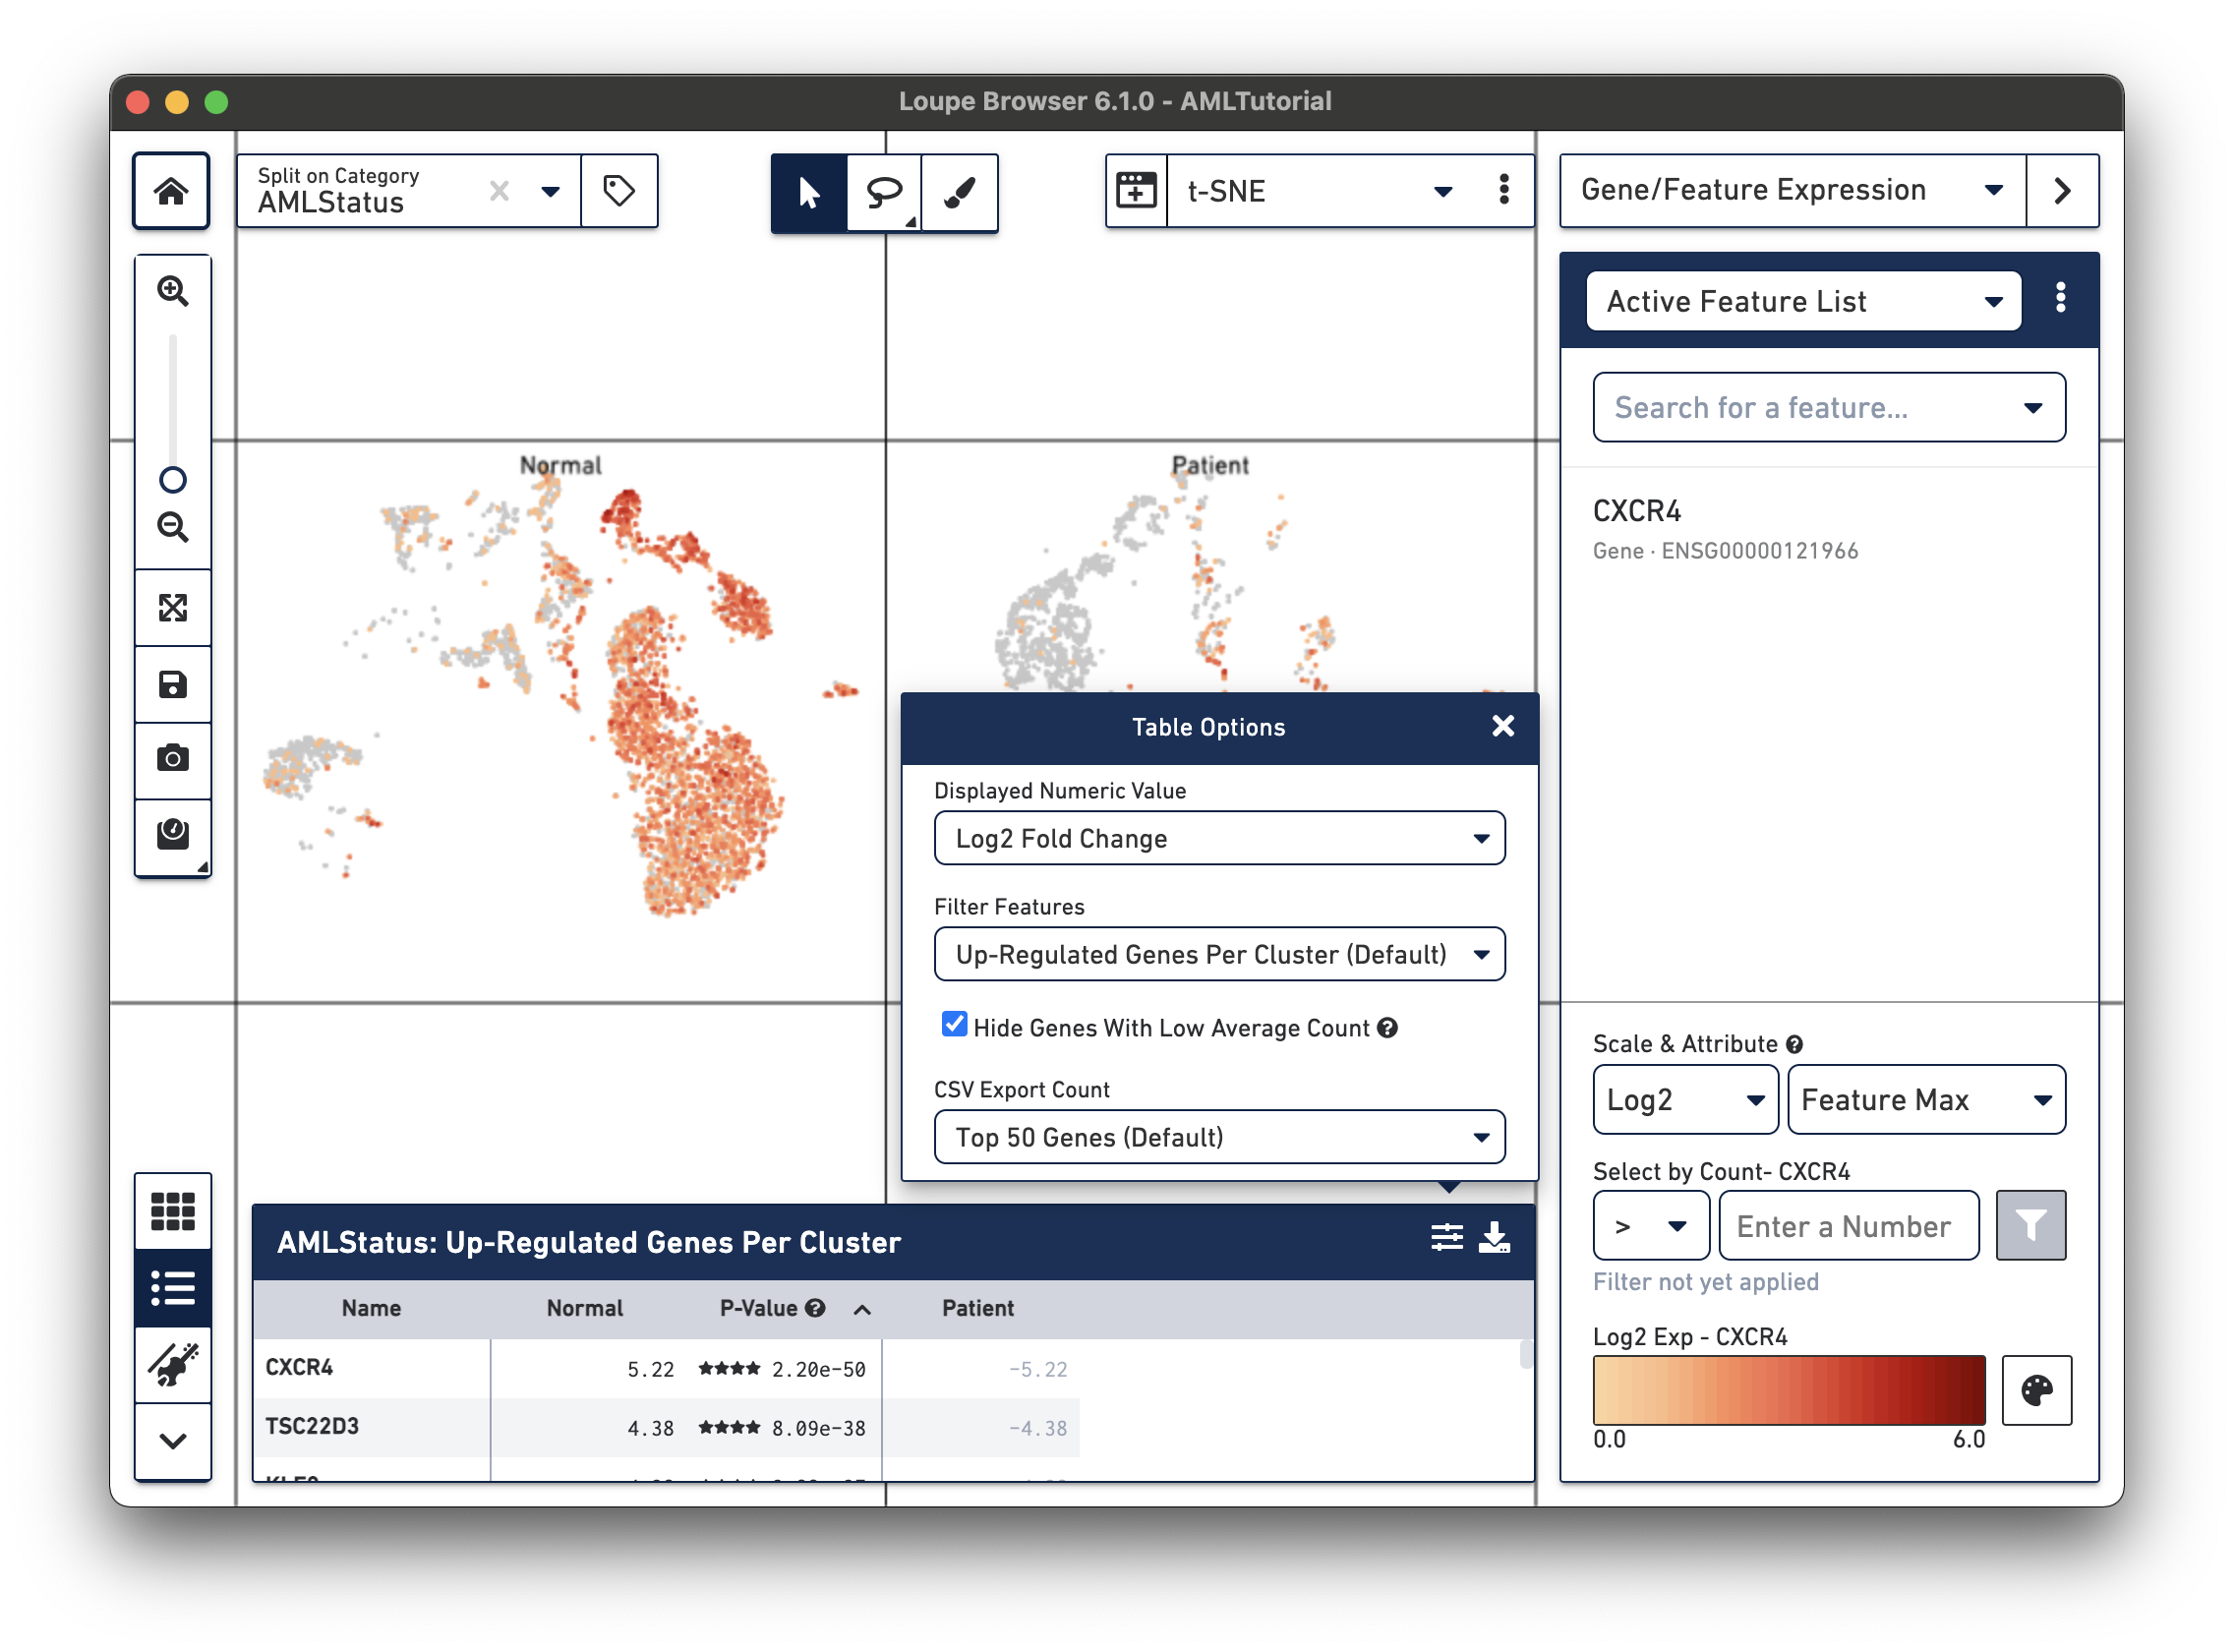
Clicking on a column in the heatmap will show the expression level for that gene across the entire dataset. Within the Feature Table, clicking on a feature name will allow you to add it to a feature list, and the Set As Active Feature option will show the expression level of that feature across the dataset.
The AML cells are more highly expressed in markers associated with the proliferation and differentiation of red blood cells, such as HBA1 and HBG. The normal cells have higher levels of expression in a variety of T and B cell markers.
These findings are consistent with the results in the Nature Communications publication, "Zheng et al, Massively parallel digital transcriptional profiling of single cells", which used these samples, among others.
Next, we will use the Feature Expression view to help us quickly identify cell types.