Cell Ranger4.0, printed on 04/03/2025
Goal: To locate known cell types within the dataset.
Identifying cell types from known markers is straightforward and fast in Loupe Cell Browser. We'll do this two ways, first through gene search and then by importing gene lists.
Since we're looking at a blood cell sample, let's hunt for B cells. Two reliable markers for B cells are CD79a and CD79b. Switch to Gene/Feature Expression mode in the sidebar and start typing in the Feature Search box. This will trigger a search against all the genes encoded in the reference used in the Cell Ranger run, or against any features specified in a Feature Barcode Reference file.
| One common problem is if you aligned some datasets against the GRCh38 reference, and other datasets against the hg19 reference, some gene names will be different from dataset to dataset. Keep that in mind when searching for genes. |
Press Tab or Enter to add the gene to the Active Feature List, and display expression levels for that gene across the dataset.
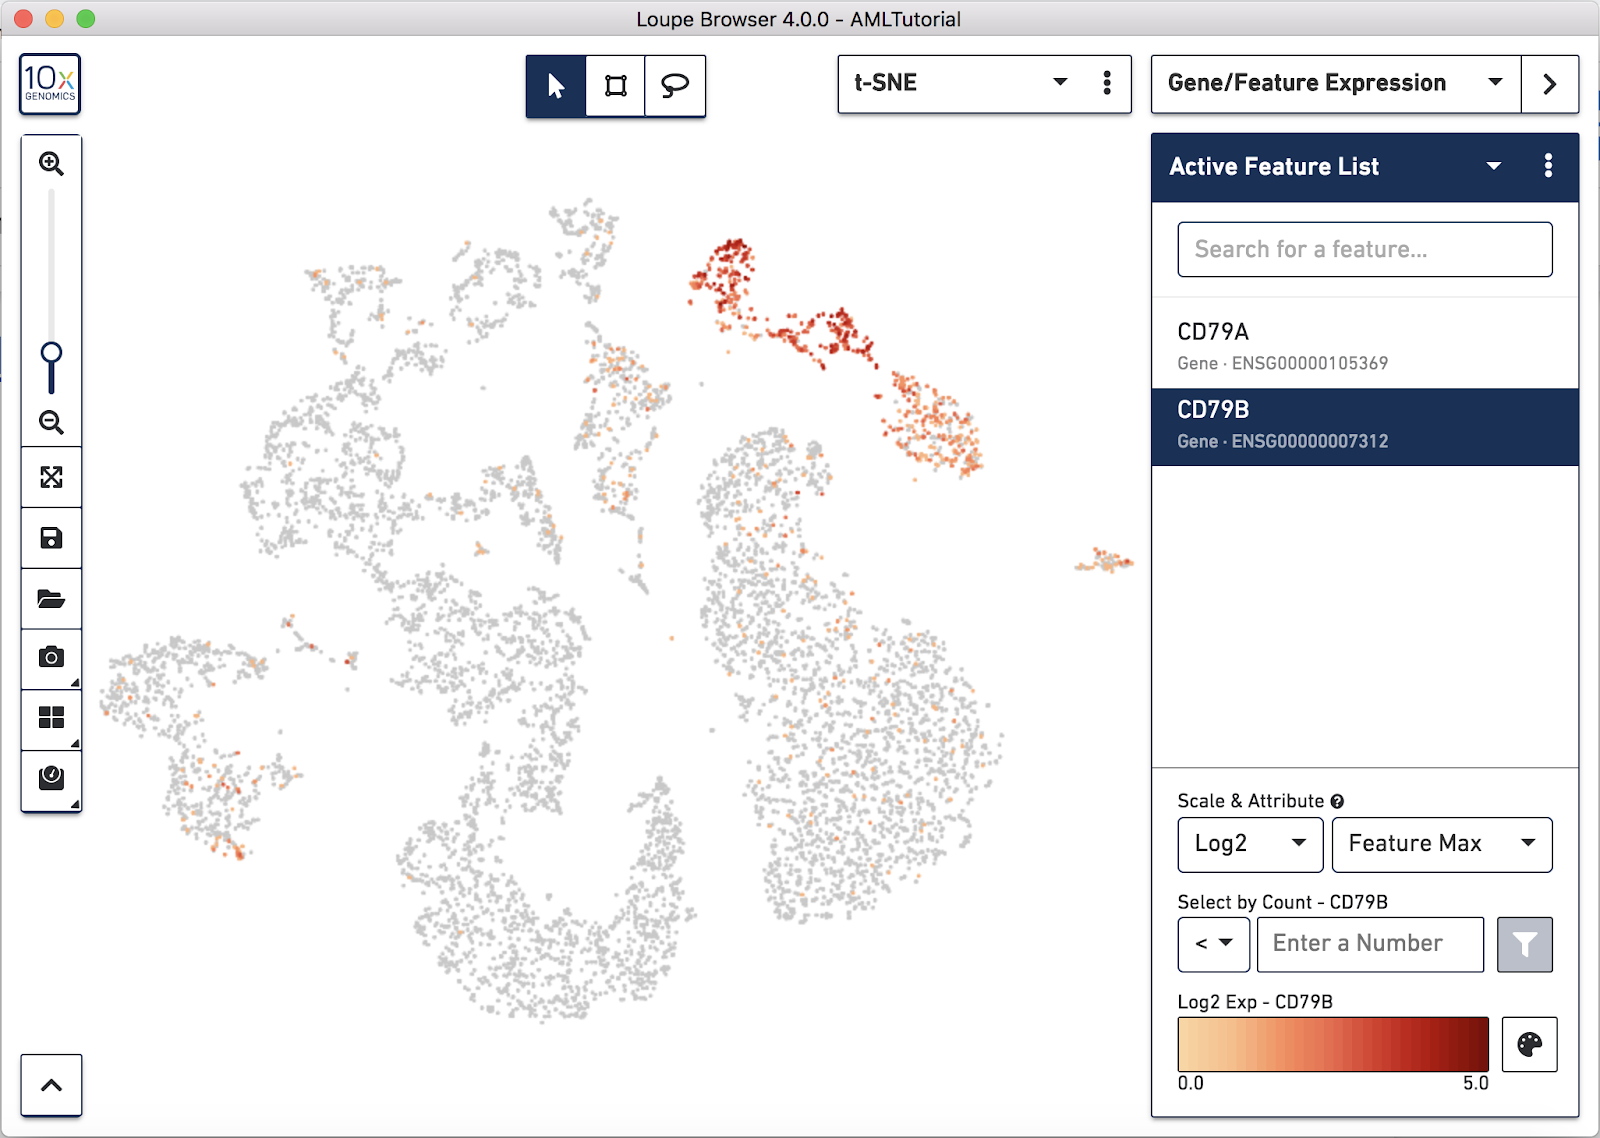
Right away, you should see that the genes expressing B cell markers are neatly clustered into one of the t-SNE clusters. It is clear that distinct region of cells represents B cells.
As you add multiple features to a list, the coloring will represent a combination of expression levels among all features in the list. With CD79A and CD79B in the list and 'Feature Max' as the selected attribute, the coloring of the plot represents the maximum transcript count between CD79A and CD79B in each cell. Selecting a single feature within a list shows the expression level for that single feature. Finally, hovering over a feature will reveal an info and a trash icon for a gene; clicking the info icon will load the Ensembl reference page for that gene in a web browser (if applicable), and clicking the trash icon will remove that feature from the current list.
In Loupe Cell Browser 3.1 or later, or Loupe Browser 4.0 or later, you are able to select alternate colorscales and adjust the endpoints of the colorscale range. To access these features, click on the palette button to the right of the colorscale.
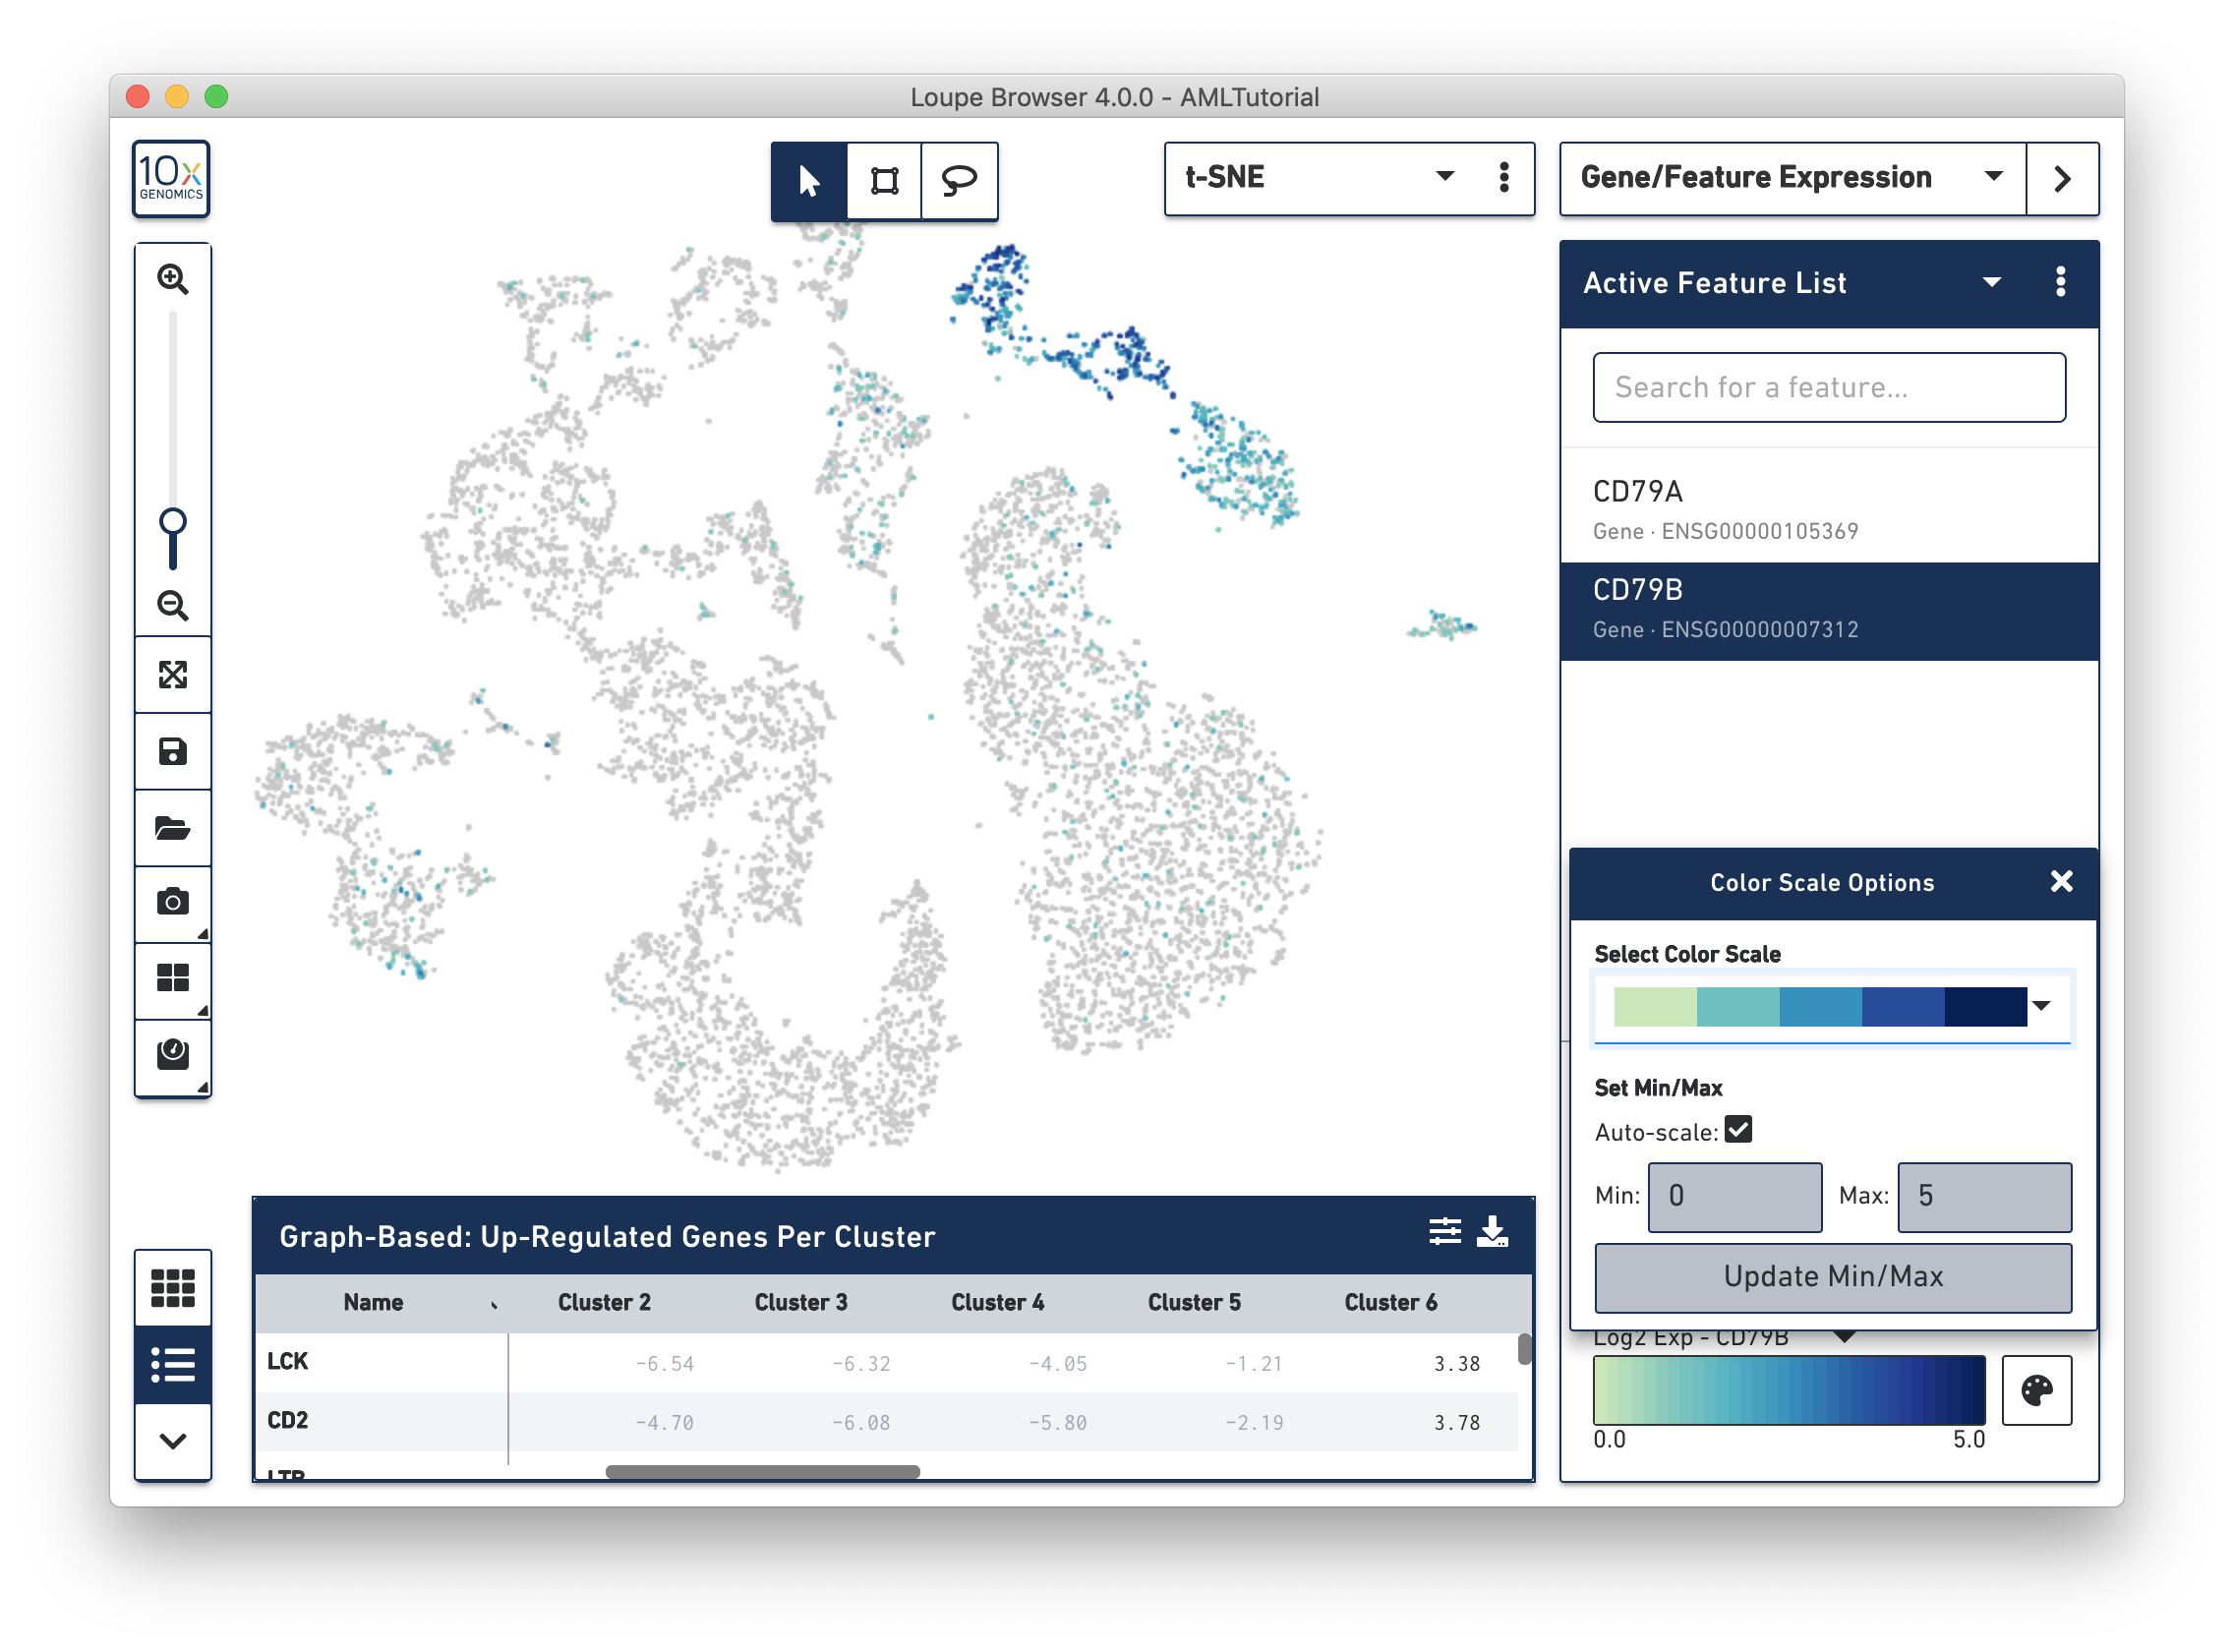
In this popup, you can choose from one of the colorscales in the colorscale dropdown. You can also choose to manually set the min and max of the colorscale by unchecking the "Auto-scale" checkbox, typing in a value, and clicking the "Update Min/Max" button. When setting manual min and max values, barcodes with values outside the range (less than the minimum or greater than the maximum) will be colored gray.
Another way to find cell subtypes is to import a CSV file which contains markers for cell types of interest. You can download one such file here: AMLBloodCell.csv. After downloading, click on the three dots to the right of the current feature list, and select 'Import Lists' from the dropdown menu. Select the file you just downloaded. After import, you should now be able to select from one of five sets of markers by selecting from the feature list selector.
Finally, we're going to use this list and manual selection tools to explore substructure.