Cell Ranger4.0, printed on 04/03/2025
Starting with Cell Ranger 3.0, it is possible to calculate gene expression alongside additional analytes using Feature Barcode technology. This allows users to see additional measurements per cell, such as the quantity of surface marker proteins, or CRISPR guide RNAs, or TCR-antigen specificity, while still having access to a cell's gene expression or immune profile. Loupe Browser has a number of features that facilitate feature barcode analysis.
To see an example of the integrated analysis of gene expression and cell surface marker expression (labeled with TotalSeq™-B Feature Barcode antibodies), download the files from the link below:
This dataset comes from cells from a dissociated extranodal marginal zone B Cell tumor (MALT: Mucosa-Associated Lymphoid Tissue), labeled with a panel of 17-TotalSeq™-B antibodies.
The .cloupe file below shows a conventional gene expression t-SNE plot:
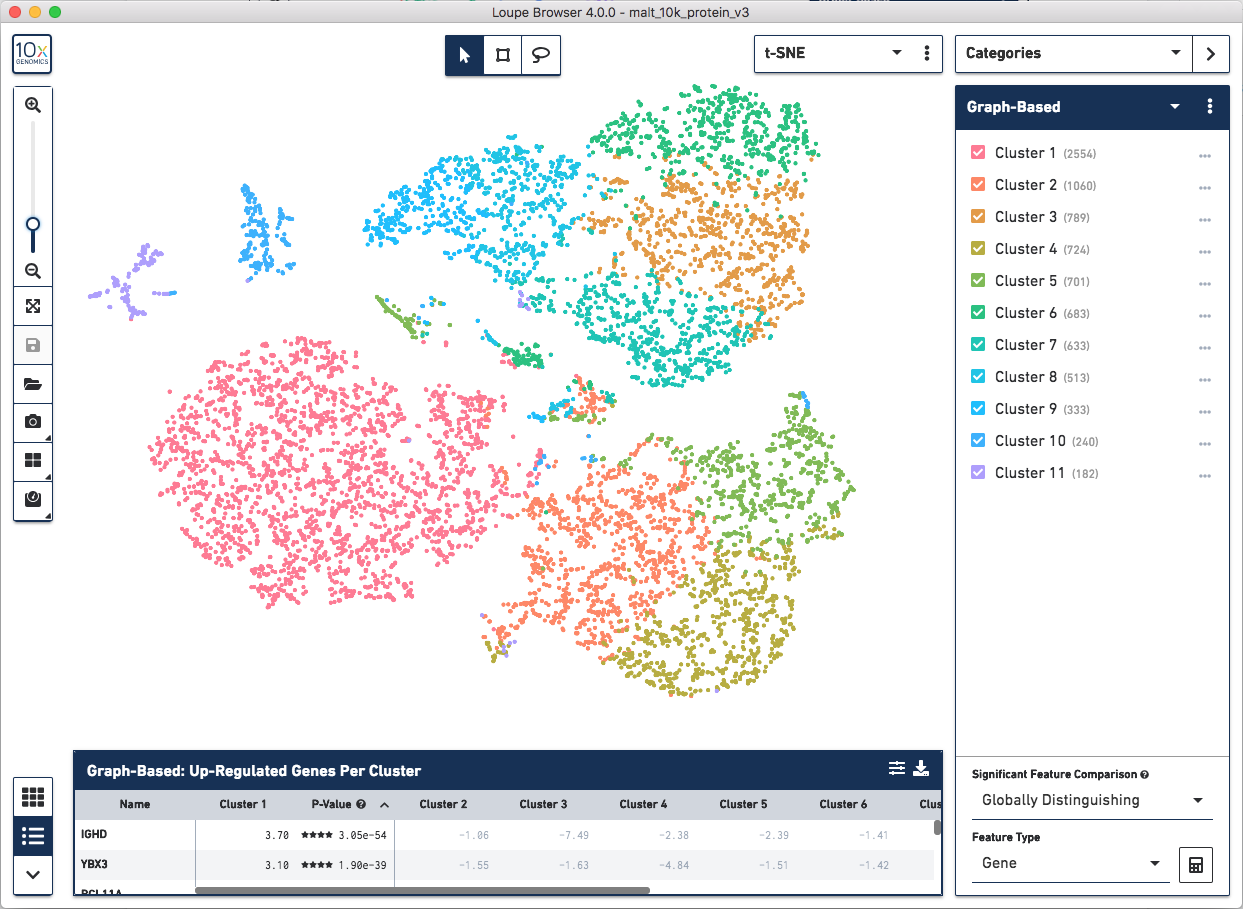
This is expected, as there is underlying gene expression data. However, it is
also possible to observe surface marker expression. Switching to Gene/Feature
Expression mode and searching for any feature with a TotalSeqB suffix will
display the cell surface marker expression across the dataset. In the image
below, we see the concentration of CD3+ cells in the plot:
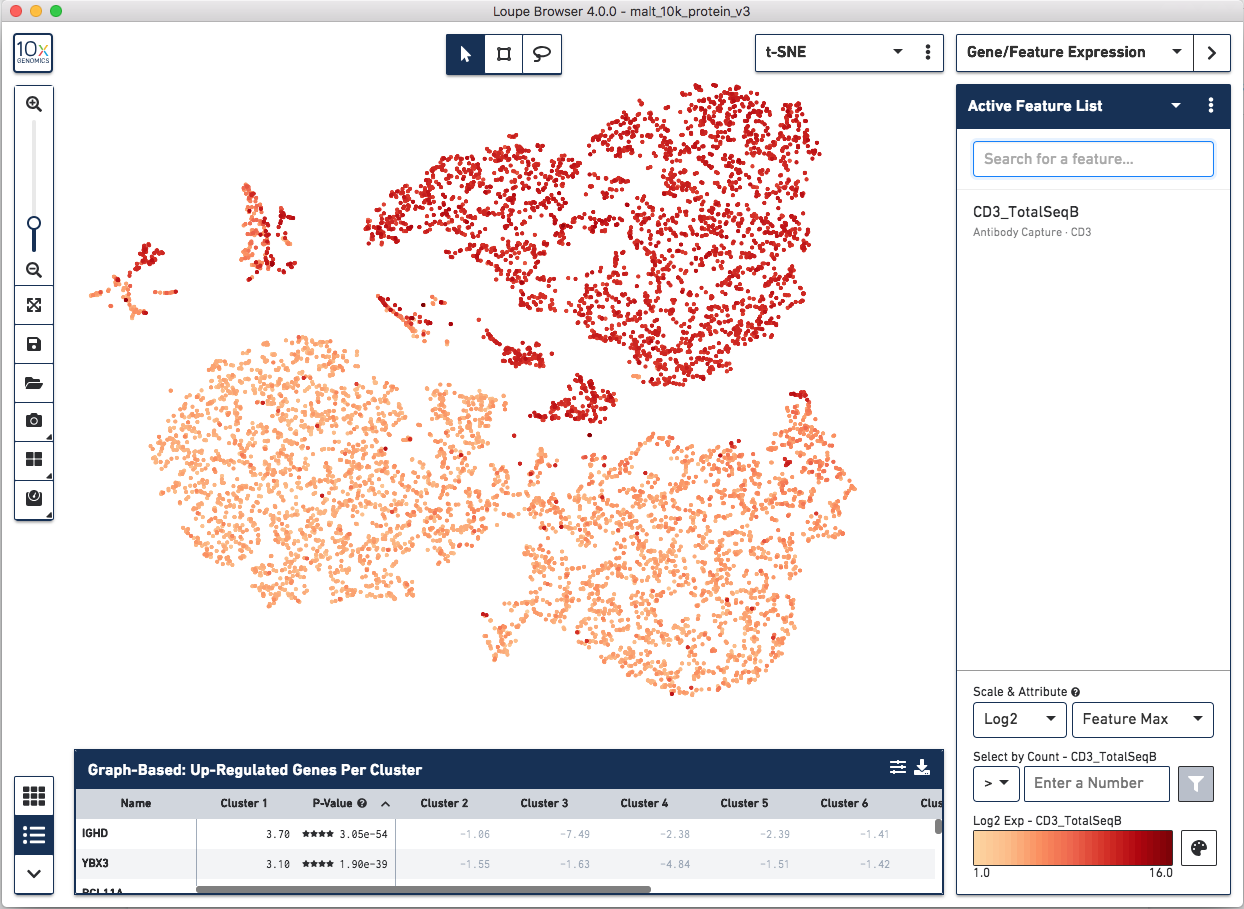
Notice that there are low levels of surface marker expression even in the CD3-negative clusters; surface marker expression counts typically have a wider dynamic range than gene expression, and there are fewer zeros. However, it is reassuring to know that the clustering and visual projection, which is based on gene expression features, has concordance with the surface marker count distribution. Looking at the distribution of CD3D and CD3E gene counts should confirm this.
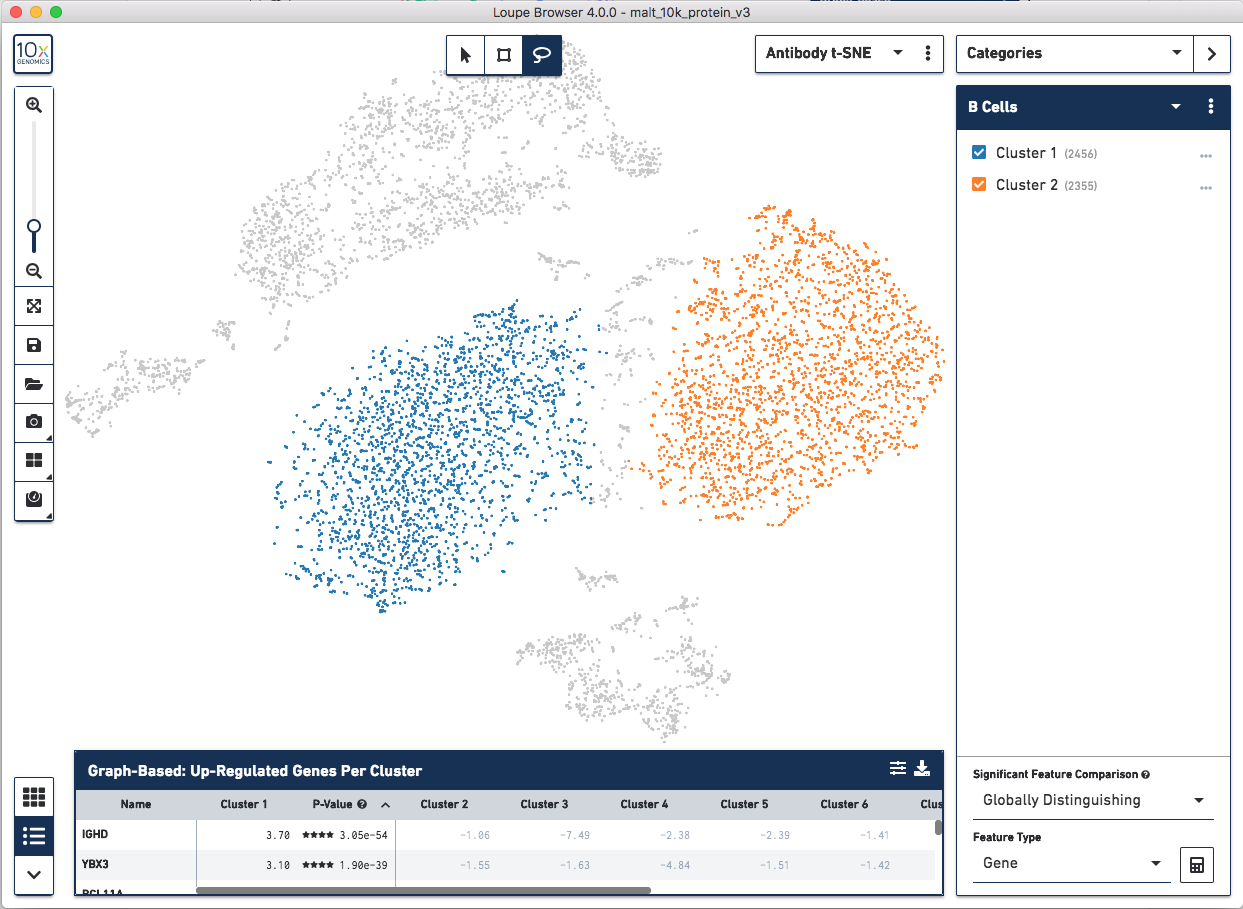
If a dataset was processed with Feature Barcode technology, the Cell Ranger pipeline will generate additional t-SNE plots alongside gene expression t-SNE plots, derived from Feature Barcode counts of like type. This might make it easier to distinguish subpopulations based on differences in surface marker or CRISPR guide RNA expression, or TCR-antigen specificity. Since the MALT dataset includes 17 cell surface markers, Cell Ranger computes a projection for the 17 cell surface marker rows in the feature-barcode matrix. This alternate projection can be viewed by selecting Antibody t-SNE from the projection selector:
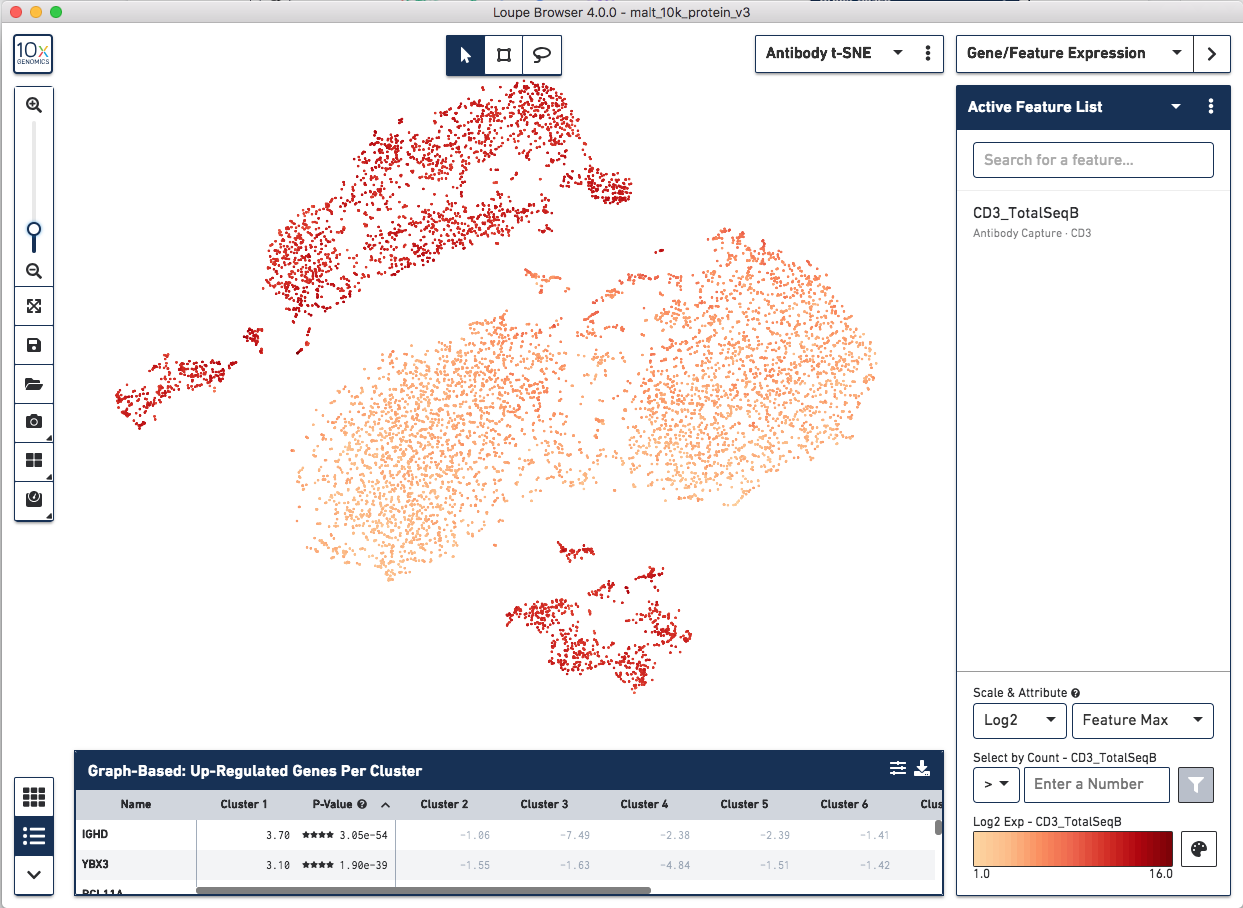
Here, the CD3+ cells are divided into two main clusters in the t-SNE projection. A quick check of other surface markers will show that the top cluster are primarily CD4+ helper T cells, and the bottom are CD8+ cytotoxic T cells. In this manner, it is possible to classify cell types by characteristic surface marker expression.
It should be noted that t-SNE plots that come from datasets with low numbers of Feature Barcodes, or where many cells have no corresponding Feature Barcode expression, may look different from the gene expression based t-SNE plot. In this situation, the Cell Ranger t-SNE algorithm, run with the same parameters as for the gene-barcode matrix, can generate visual artifacts. For CRISPR experiments with an appreciable number of protospacers, the CRISPR t-SNE plot will likely be the easiest way to isolate sets of cells with a particular protospacer.
The structure of the t-SNE cluster plot can be used to determine cell types in this case, but it may be more useful and precise to more quantitatively categorize cell types, as is typically done in flow cytometry. Loupe Browser's Feature Plot plots cell barcodes by the expression of one or two features, which makes it easy to threshold cell populations by expression, particularly for features with high dynamic range, such as cell surface markers.
Selecting Feature Plot in the projection dropdown will switch the axes. This
will switch the axes from t-SNE axes to feature axes. The initial condition will
be to plot barcode index on both axes. Both the feature to plot and the scale
(linear or log) of the axis can be changed using the selectors above the Y axis
and on the right side of the X axis. Change the Y axis to plot the
CD3_TotalSeqB surface marker expression, and click the button next to the
feature selector to select a log scale. Representative graph below:
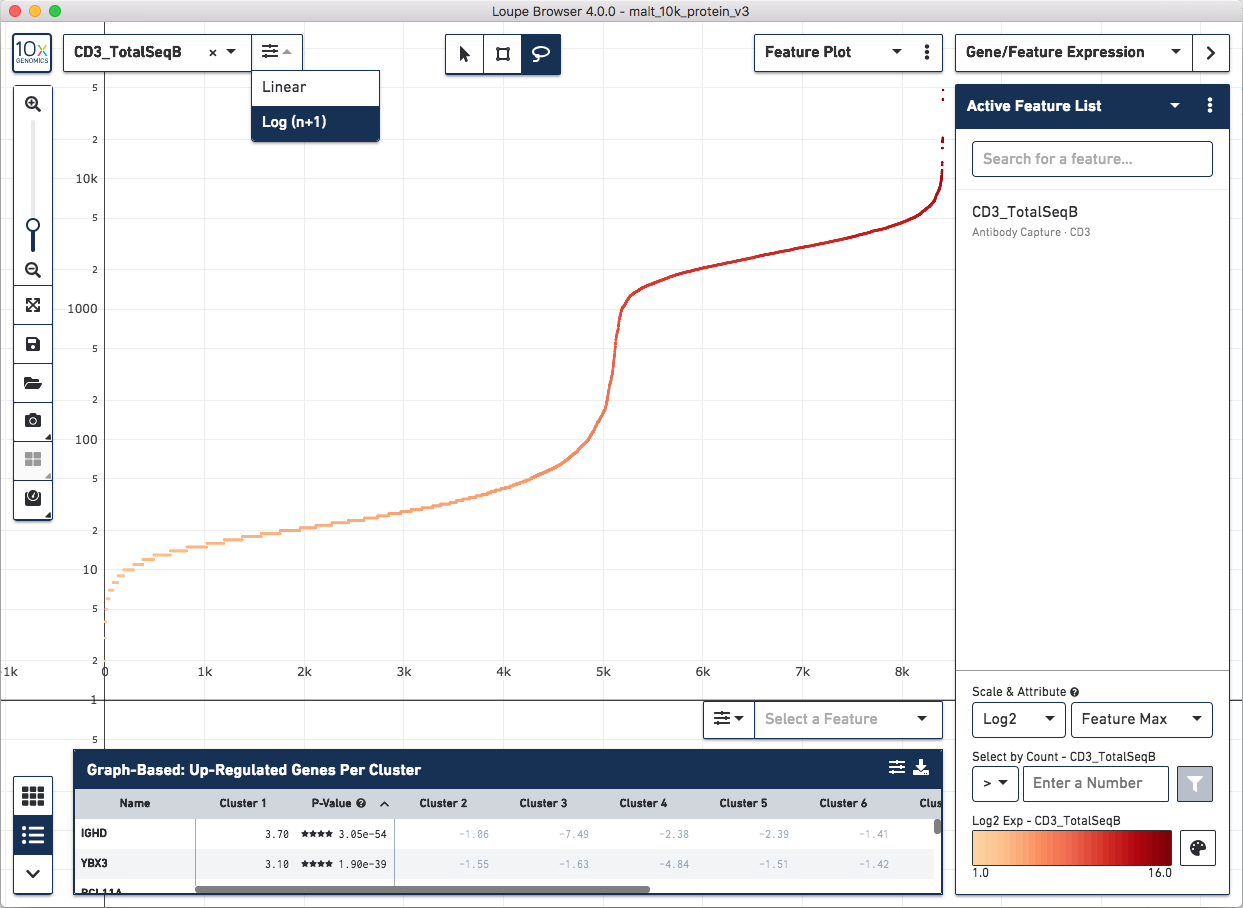
Several inflection points are seen in the curve. Around the 5000th cell on the X axis, the counts per cell increase; this is a representative threshold for CD3+ cells.
Another feature may be plotted on the X axis by choosing the CD4_TotalSeqB
antibody feature and log scale for the X axis (as well as coloring by CD8a
surface marker). Representative graph below:
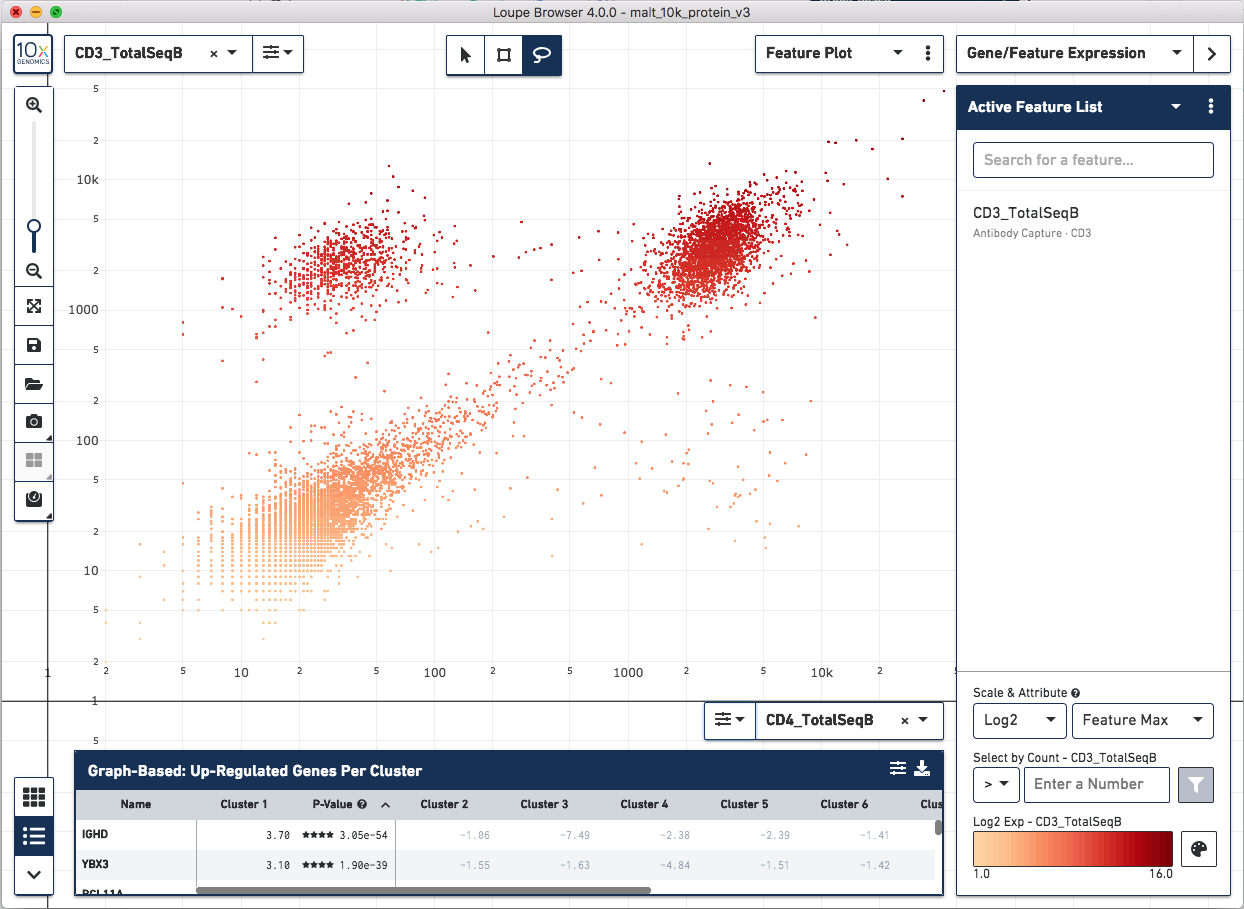
The lasso or rectangular selection tools from the toolbar can then be used to create new clusters of cells for any of these subpopulations in the graph: CD3/CD4+, CD3-/CD4-, or CD3/CD4+.
The feature plot is also useful for isolating true positive populations against negative control markers, in both cell surface marker and TCR-Antigen specificity applications, or identifying and excluding possible doublets from existing clusters.
Finally, just as it is possible to determine differential gene expression between clusters, Loupe Cell Browser 3.0 and higher can also determine differential cell surface marker expression between clusters. In the antibody t-SNE plot, recall that the central cluster of B Cells looks like it is made of two distinct clusters. Use the lasso plot to create two different subclusters within the B Cell cluster:
Are there any cell surface markers that are different between the two subclusters? To find out, with Categories mode selected, choose Locally Distinguishing from the Significant Feature Comparison dropdown, and Antibody Capture as the Feature Type. Clicking the calculator button will identify the cell surface markers that distinguish the two groups. For cell surface markers, it may be most useful to sort by log2 fold change, as shown below.
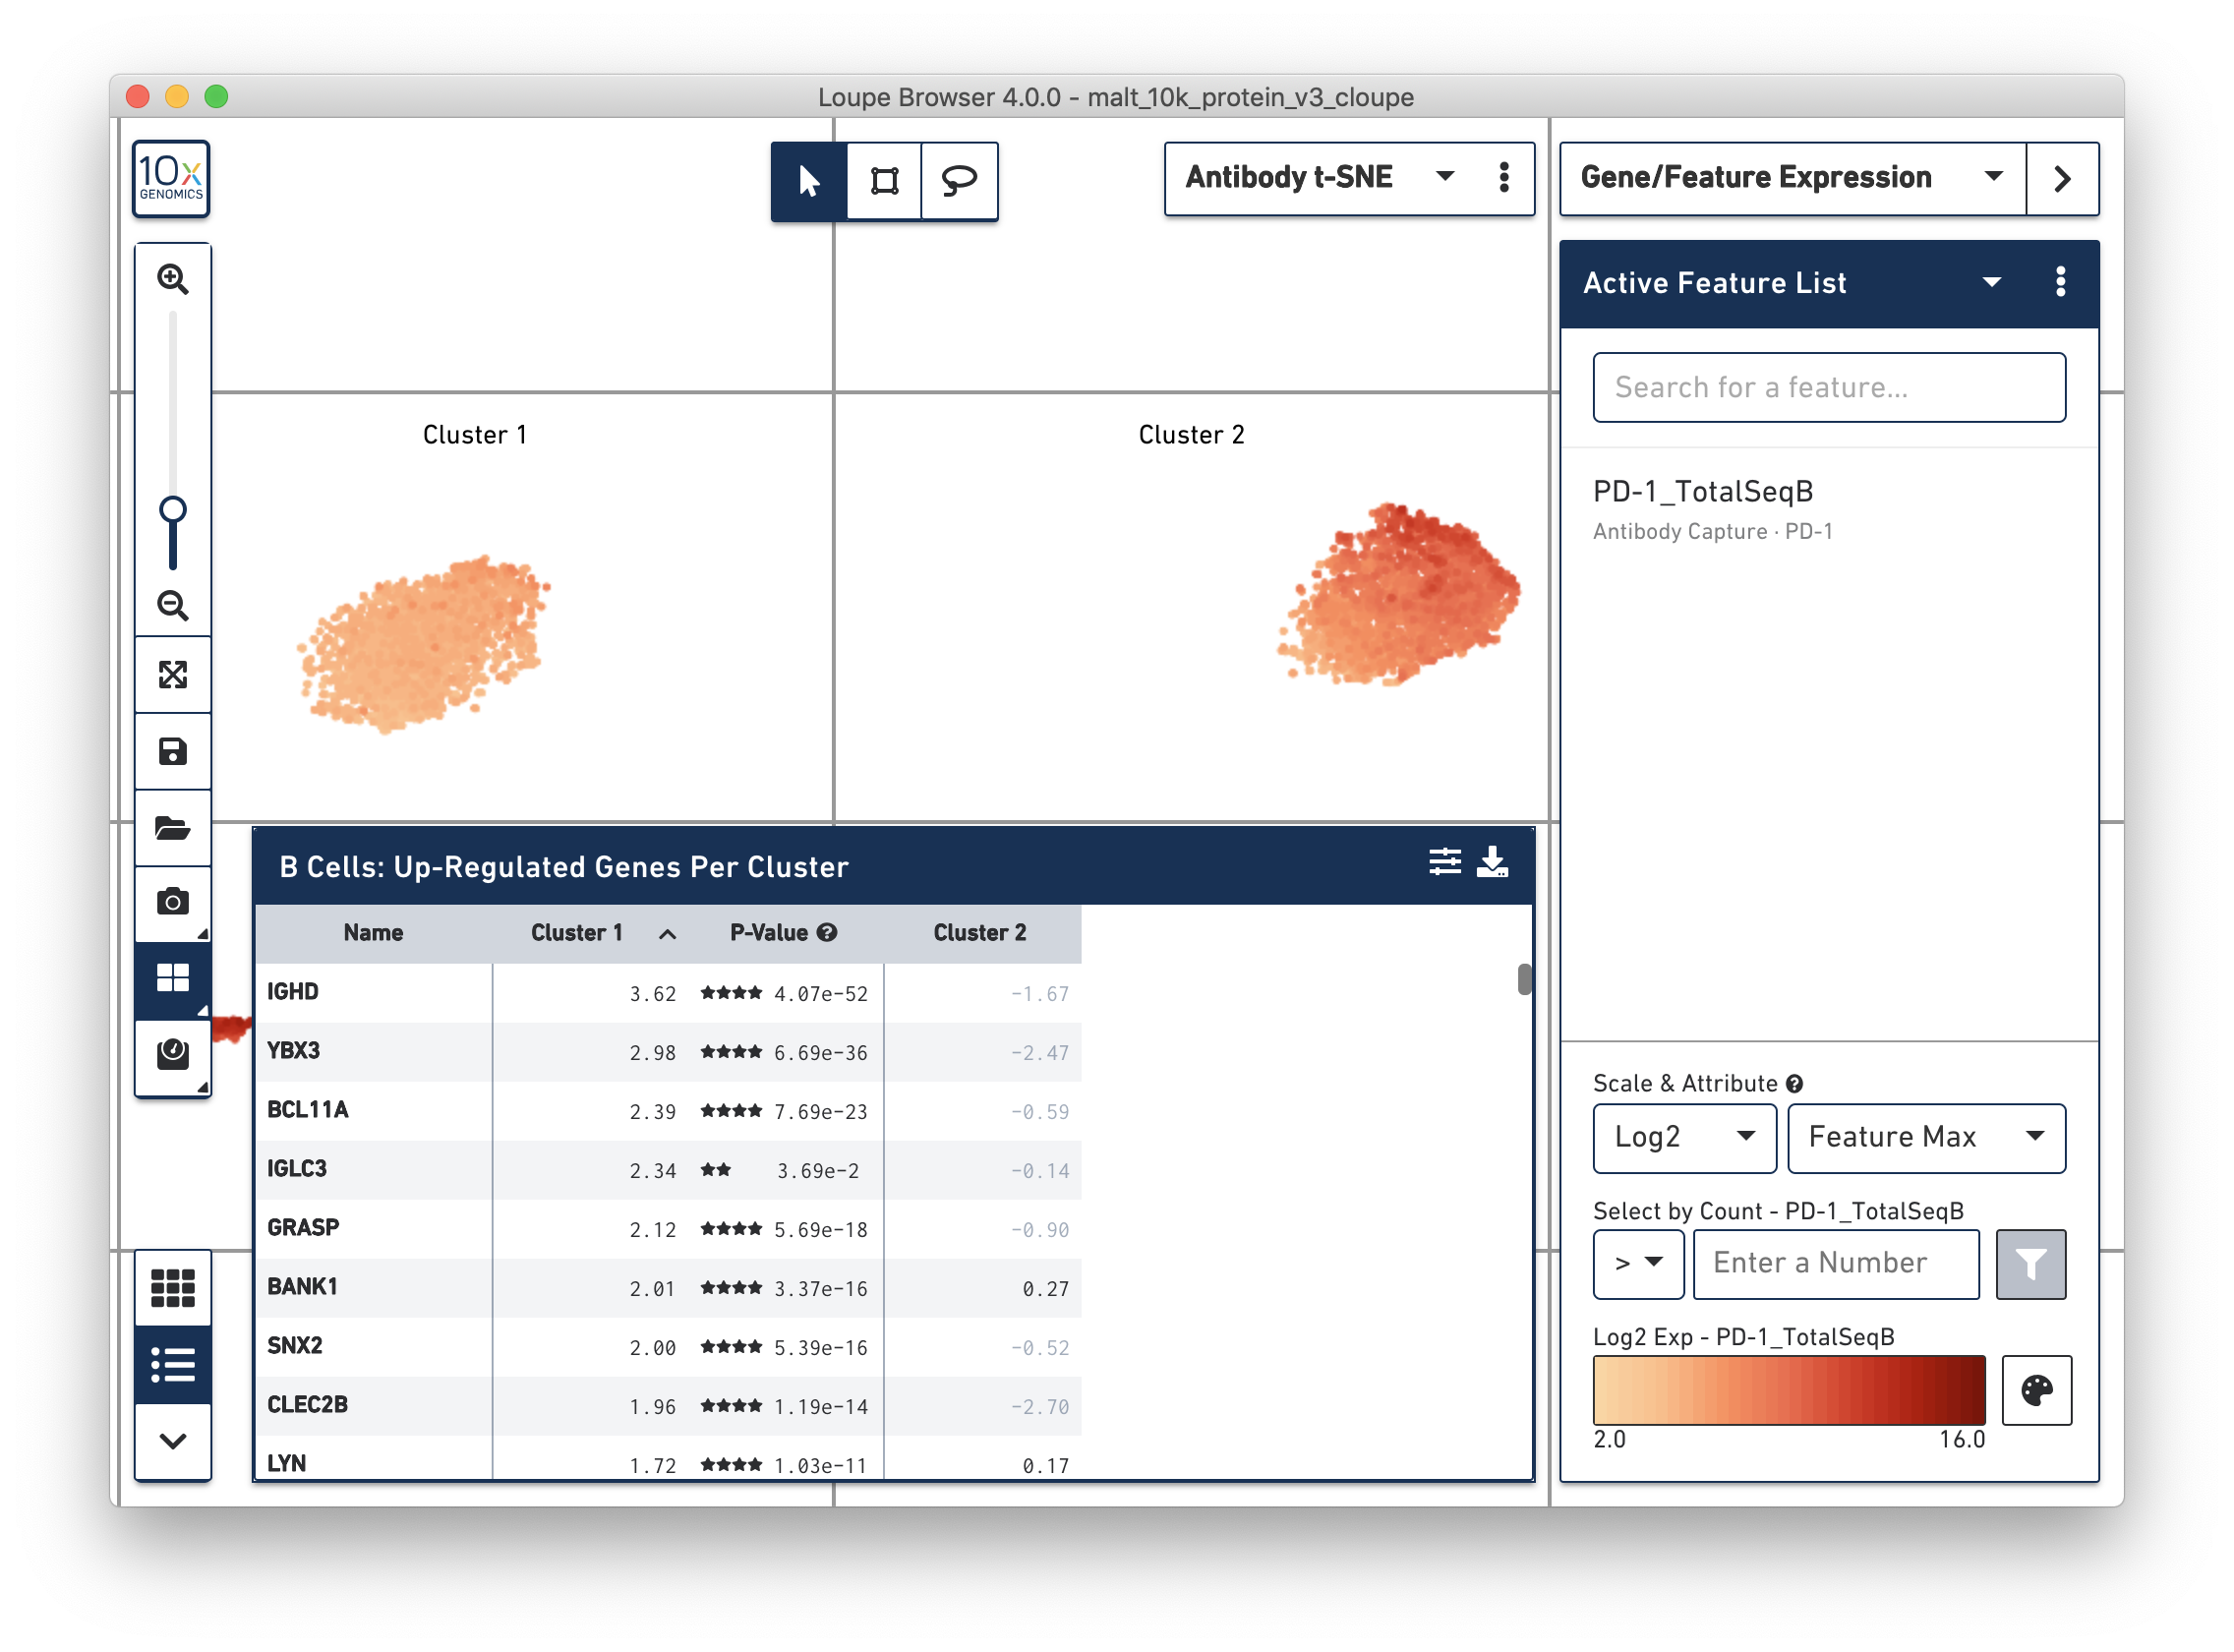
Sorting by Cluster 2 log2 fold change, clicking on PD-1_TotalSeqB in the
feature table, and choosing "Set as Active Feature" from the ensuing menu will
yield the plot above. It looks like the PD-1 cell surface marker is higher in
Cluster 2 than in Cluster 1; the level is about 10 times as high in Cluster 2
than in Cluster 1. There are also significant differences in gene expression
between the two clusters (particularly in chain type), even though the visual
differences in this plot are derived from cell surface marker expression.
Using differential expression for Feature Barcodeing will also be useful in TCR-Antigen applications, where it is possible to can identify antigens preferentially bound to a set of cells with the same V(D)J clonotype.