Cell Ranger7.1, printed on 04/06/2025
| After June 30, 2023, new Cell Ranger releases will no longer support Targeted Gene Expression analysis. |
The 10x Genomics Custom Panel Designer can be used to design custom panels targeting annotated human or mouse genes and exogenous sequences. This tutorial demonstrates how to design a custom mouse gene panel and how to use 10x-developed computational tools to evaluate your panel and perform Targeted Gene Expression data analysis.
This tutorial covers the following aspects of the custom panel design, evaluation, and data analysis:
This tutorial uses a dataset from a mouse splenocyte sample. The spleen is a rich source of many different immune cell types, with large numbers of B and T cells, as well as smaller populations of monocytes, macrophages, natural killer cells, and granulocytes. Since each of these cell types express well-characterized gene signatures, a targeted panel can be used to characterize samples more efficiently compared to a whole transcriptome sequencing approach. While this particular sample came from a healthy mouse, the same panel can be used to profile immune responses to infection or inflammation in a larger study.
In this tutorial, we will design a custom mouse immunology panel, consisting of 308 genes that represent markers for major immune cell types and several genes annotated as involved in immunity and inflammatory responses. Download the gene list here. When compiling a gene list, we recommend reviewing this Technical Note on best practices for custom panel design.
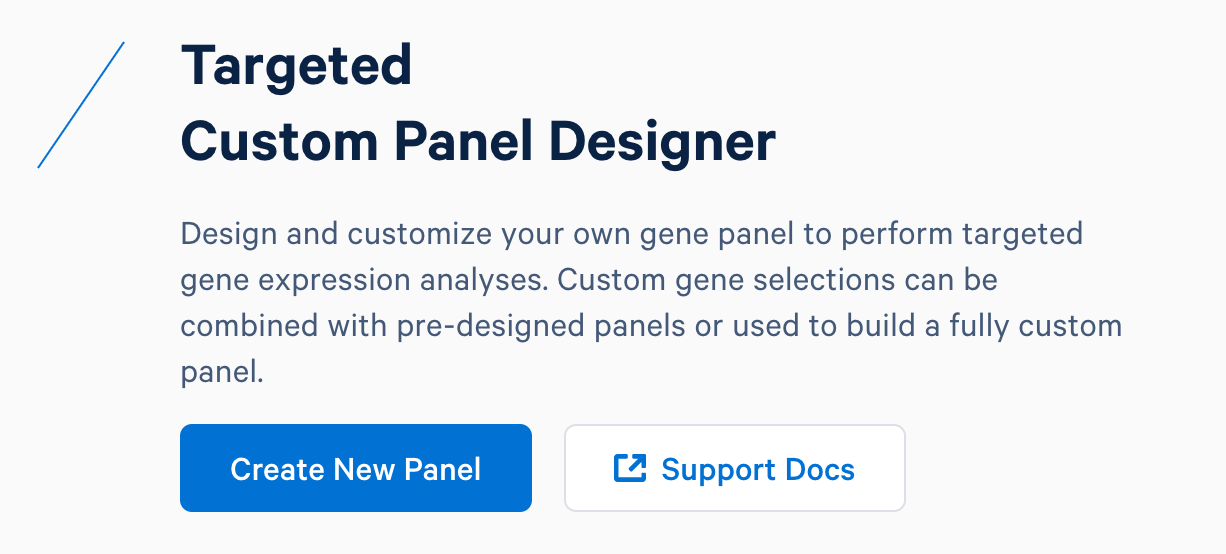
First, design baits for these genes using the 10x Genomics Custom Panel Designer. After registering for an account and logging in, select ‘Create New Panel’.
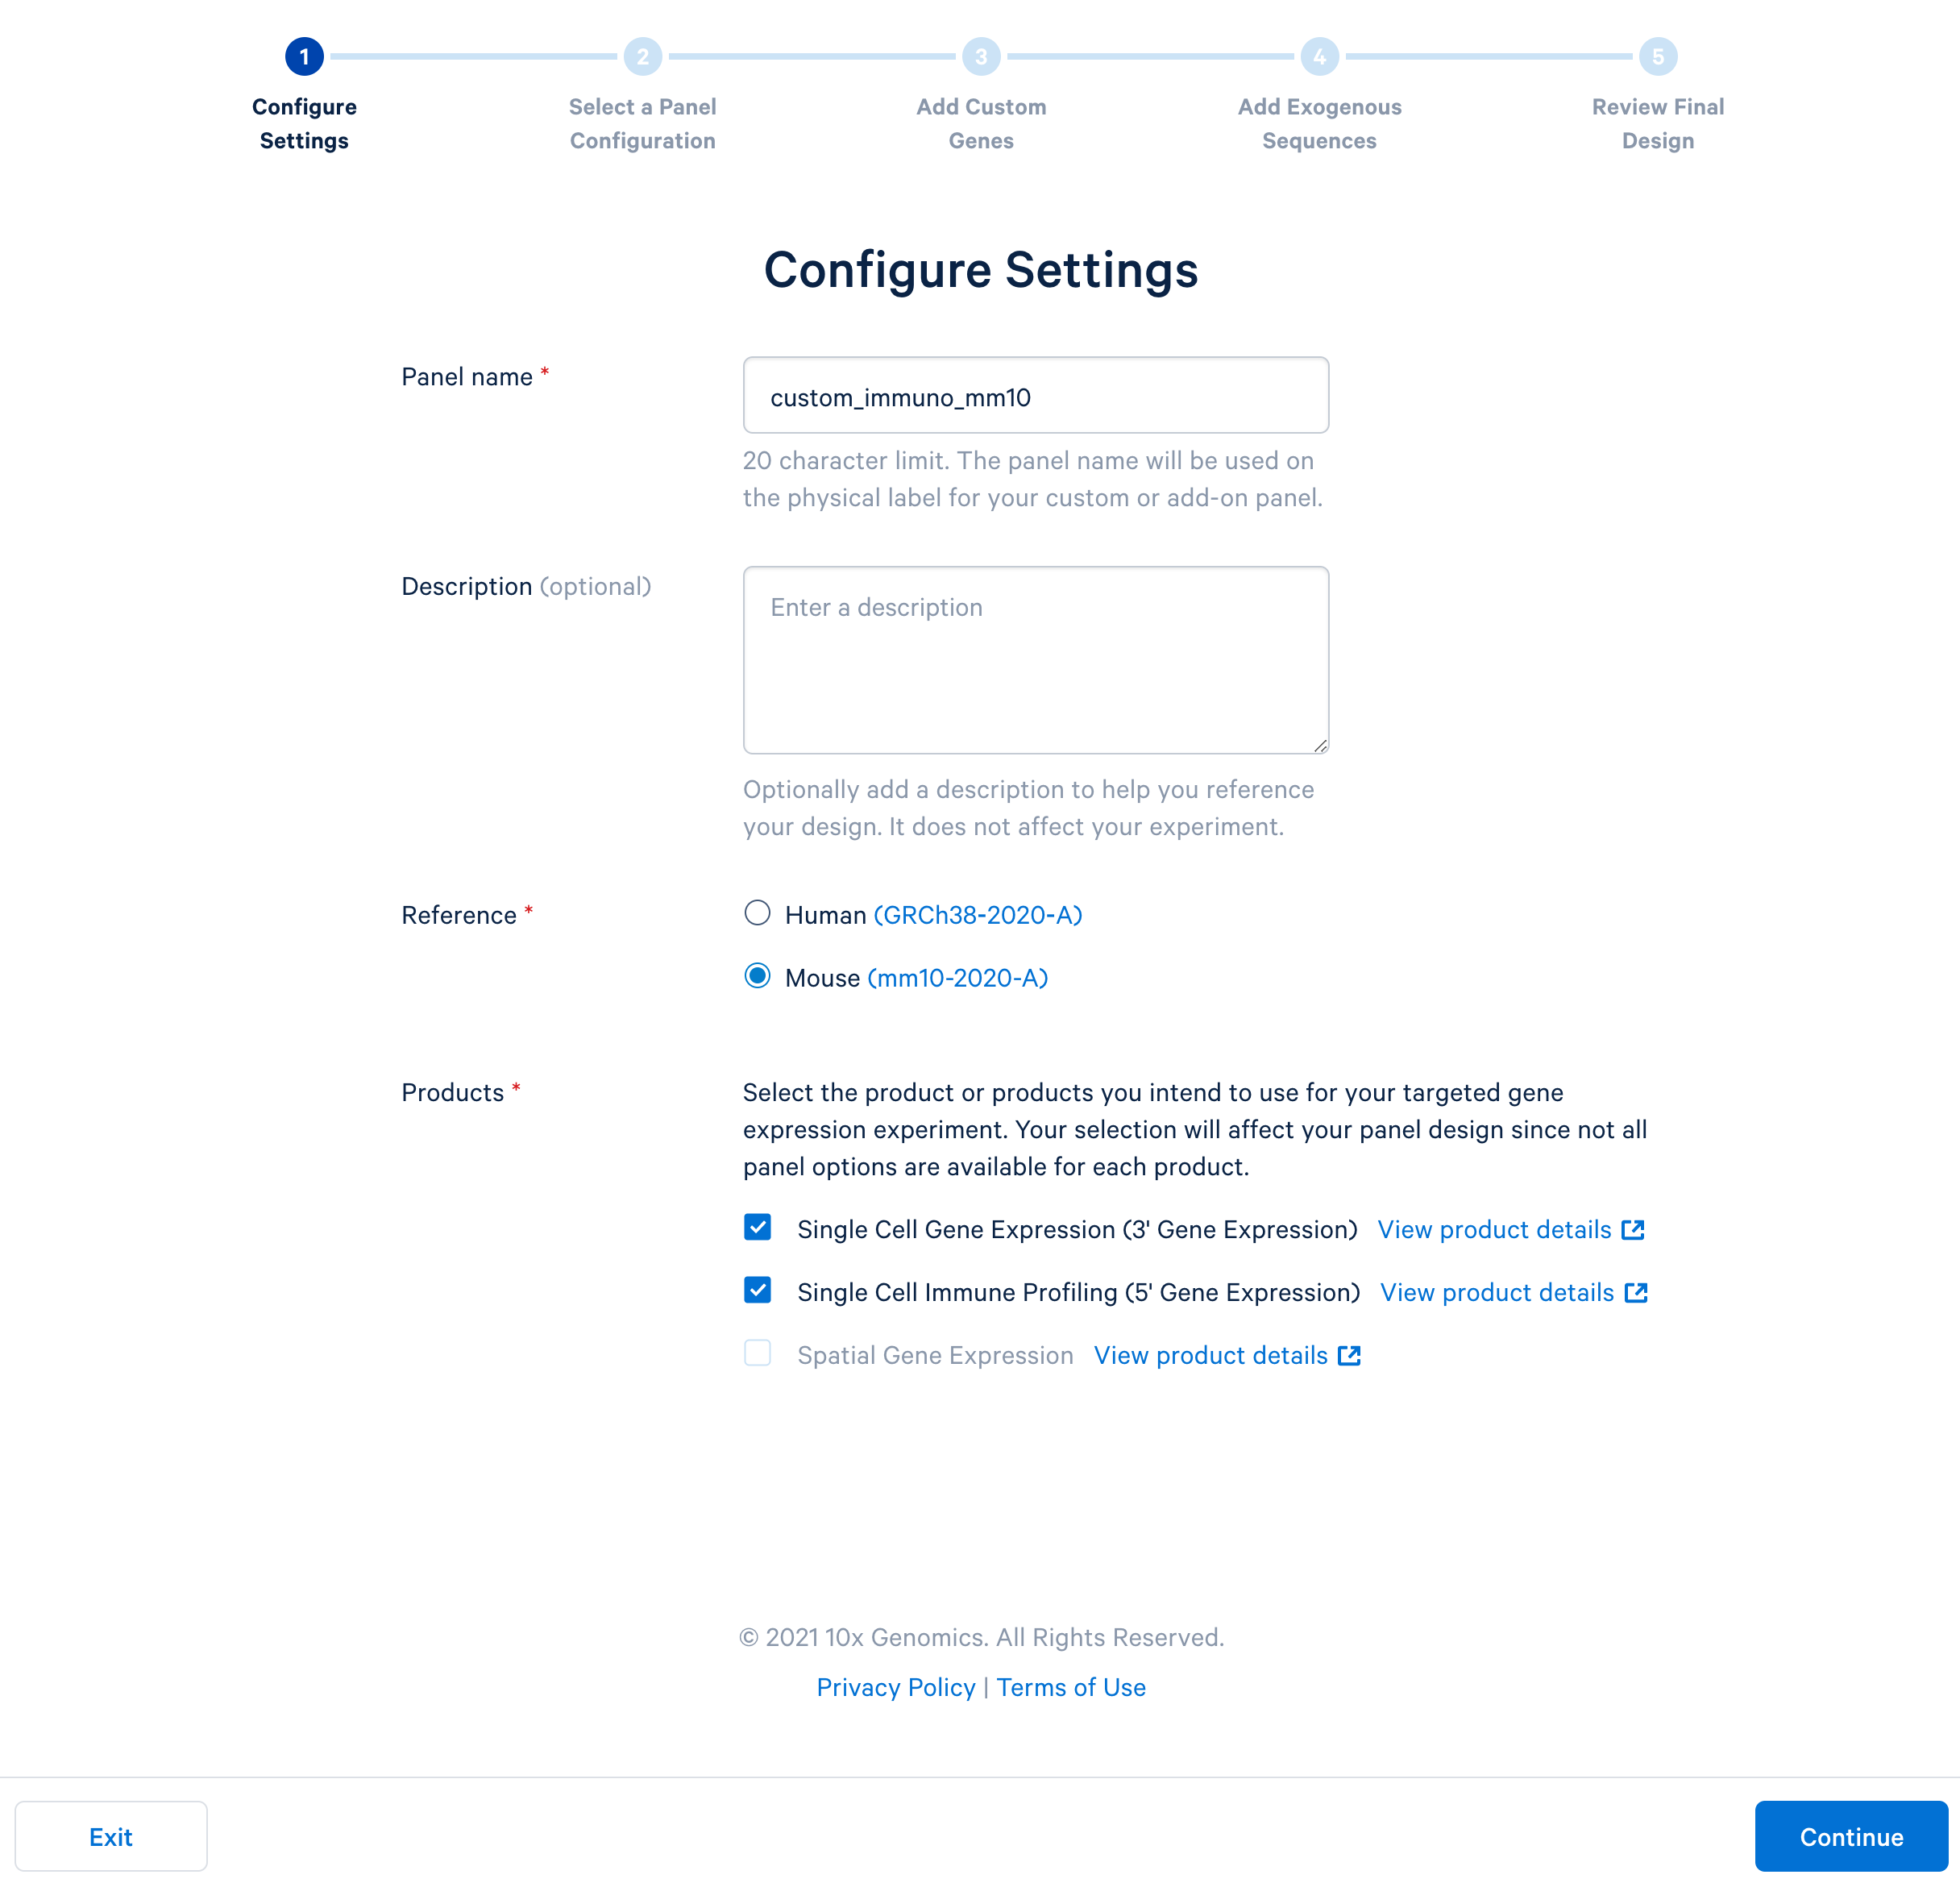
Name the custom panel as ‘custom_immuno_mm10’, and select ‘mouse (GRCm38-2020-A)’. For mouse panels, 10x Genomics supports ‘Single Cell Gene Expression’ and ‘Single Cell Immune Profiling’. These two products use the same bait design algorithm, therefore selecting either or both of them will produce the same results.
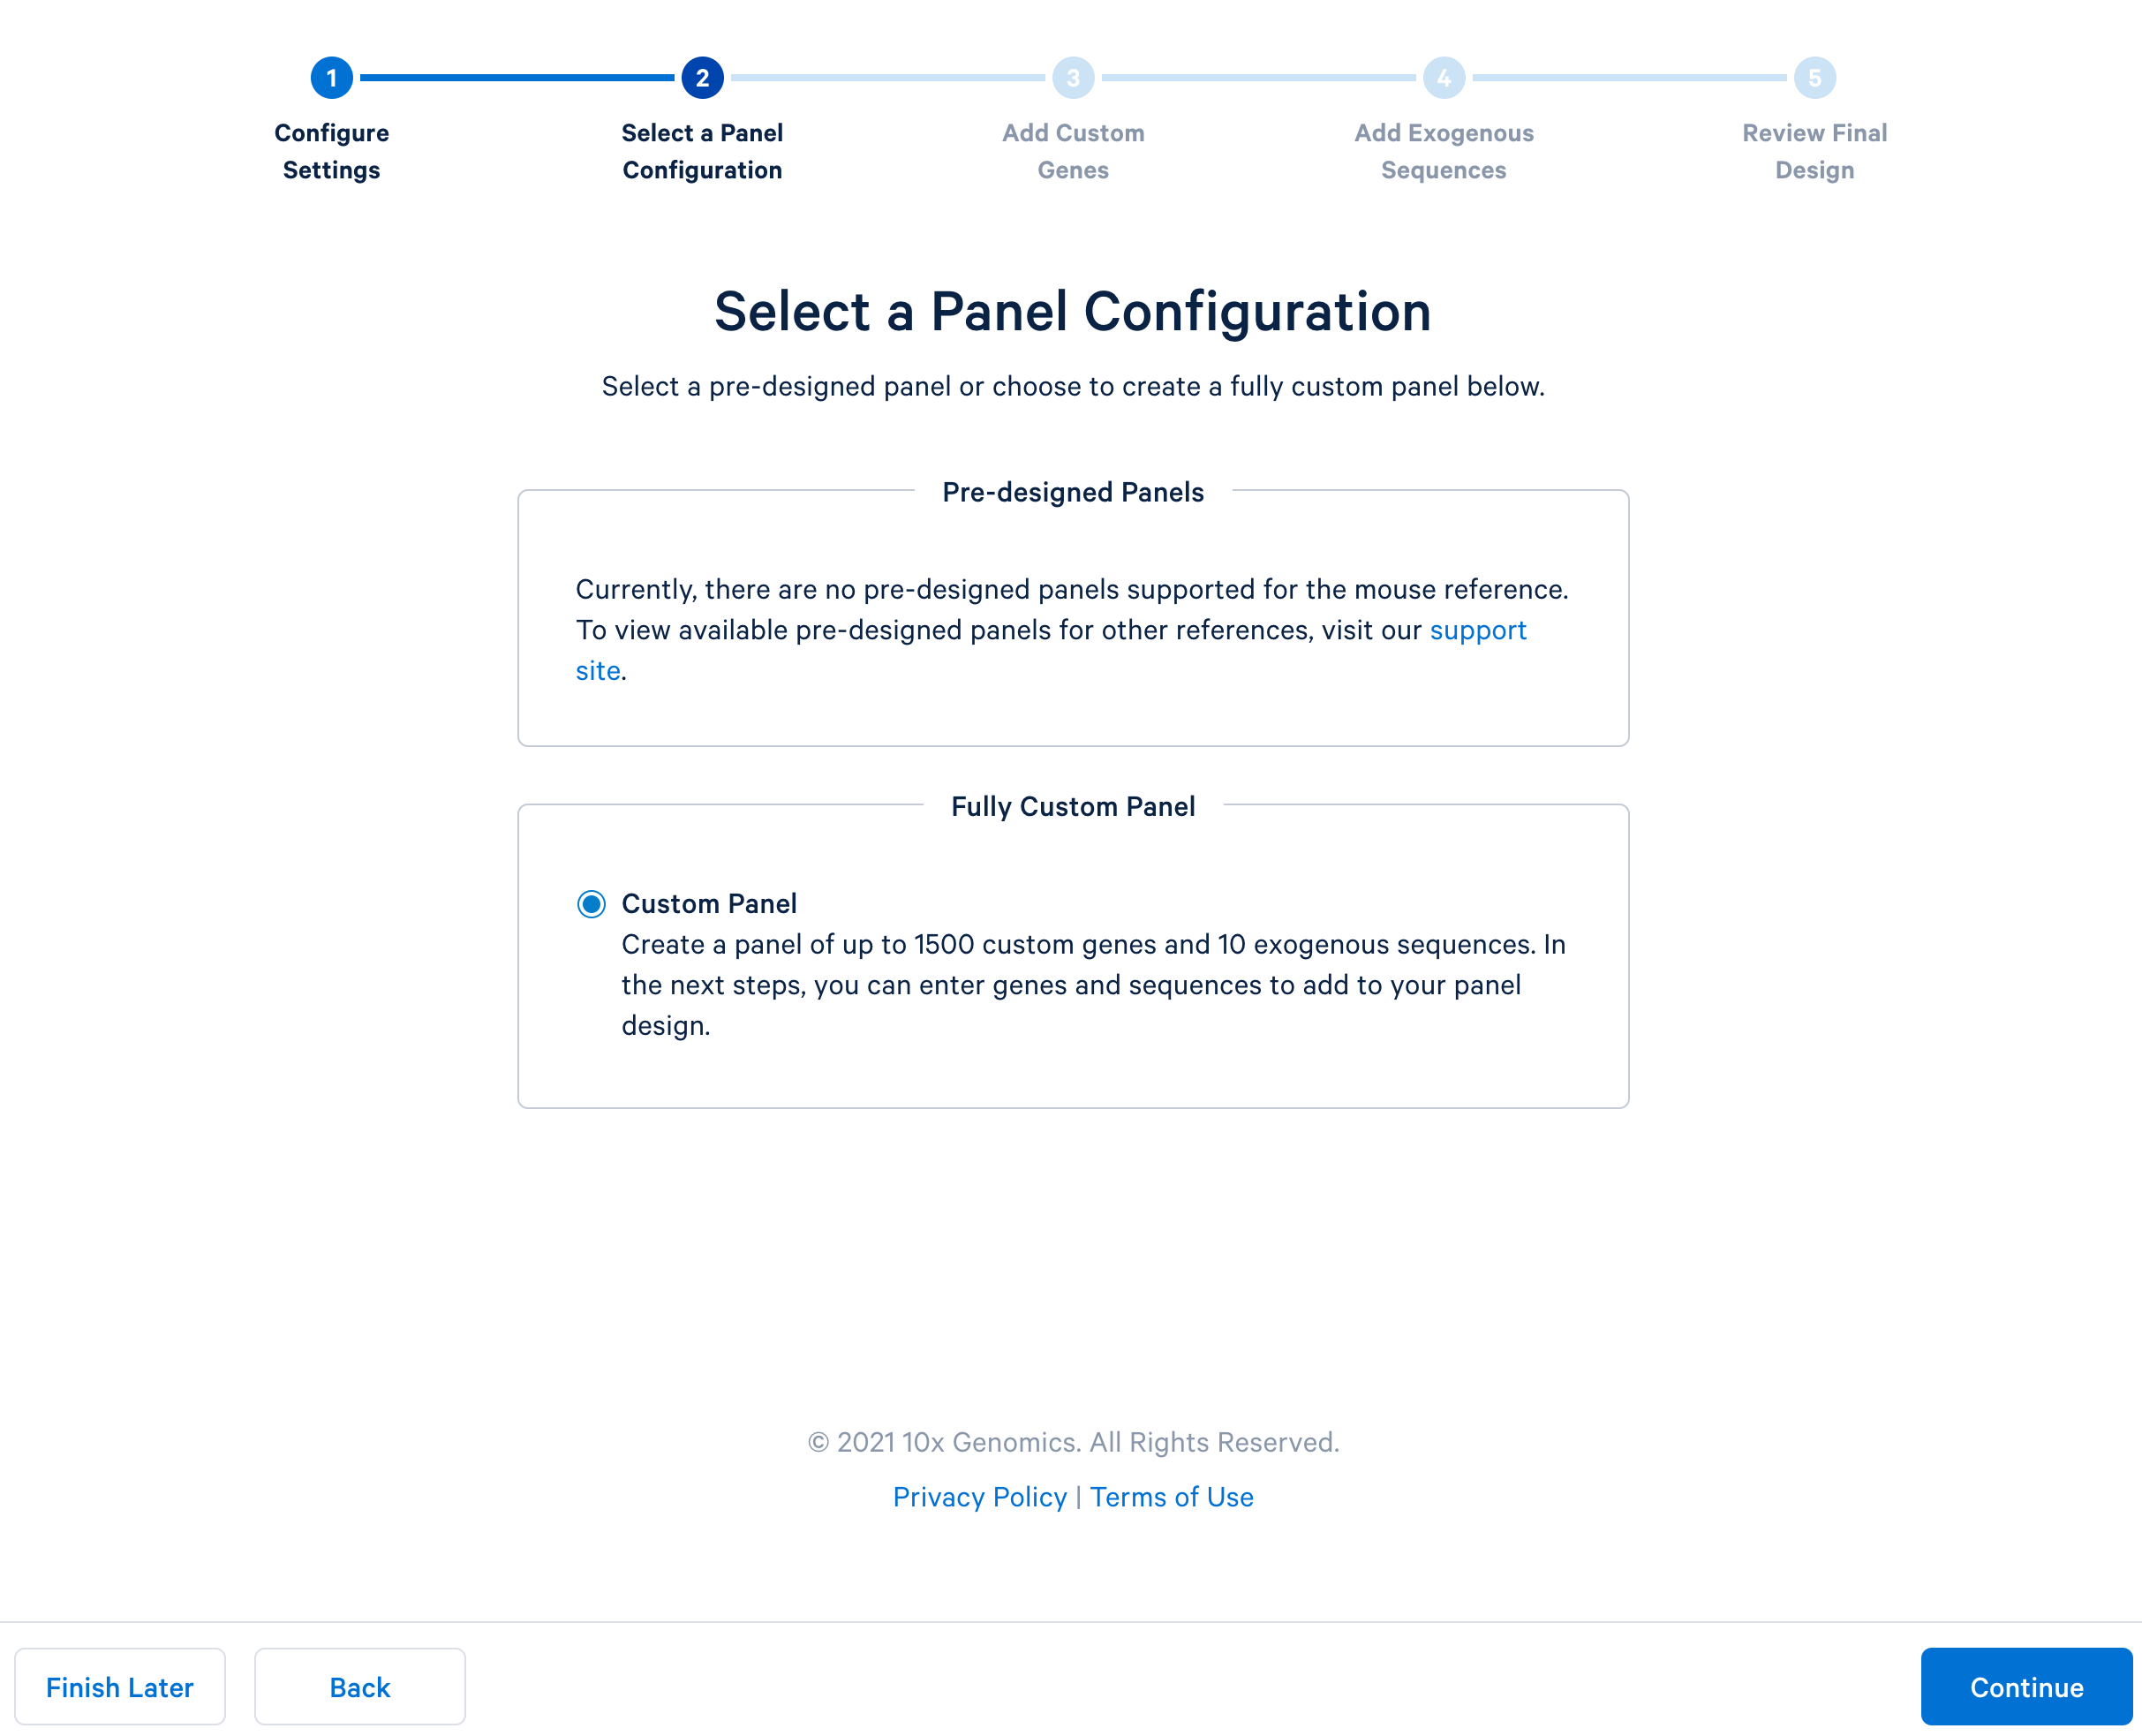
After completing the setting, continue to the configuration. For mouse panels, 10x Genomics only supports fully custom panels.
Next, continue to ‘Add Custom Genes’. You can enter a list of genes of interest, up to 1,500 genes in a single panel. This tutorial uses this list of 308 immune genes.
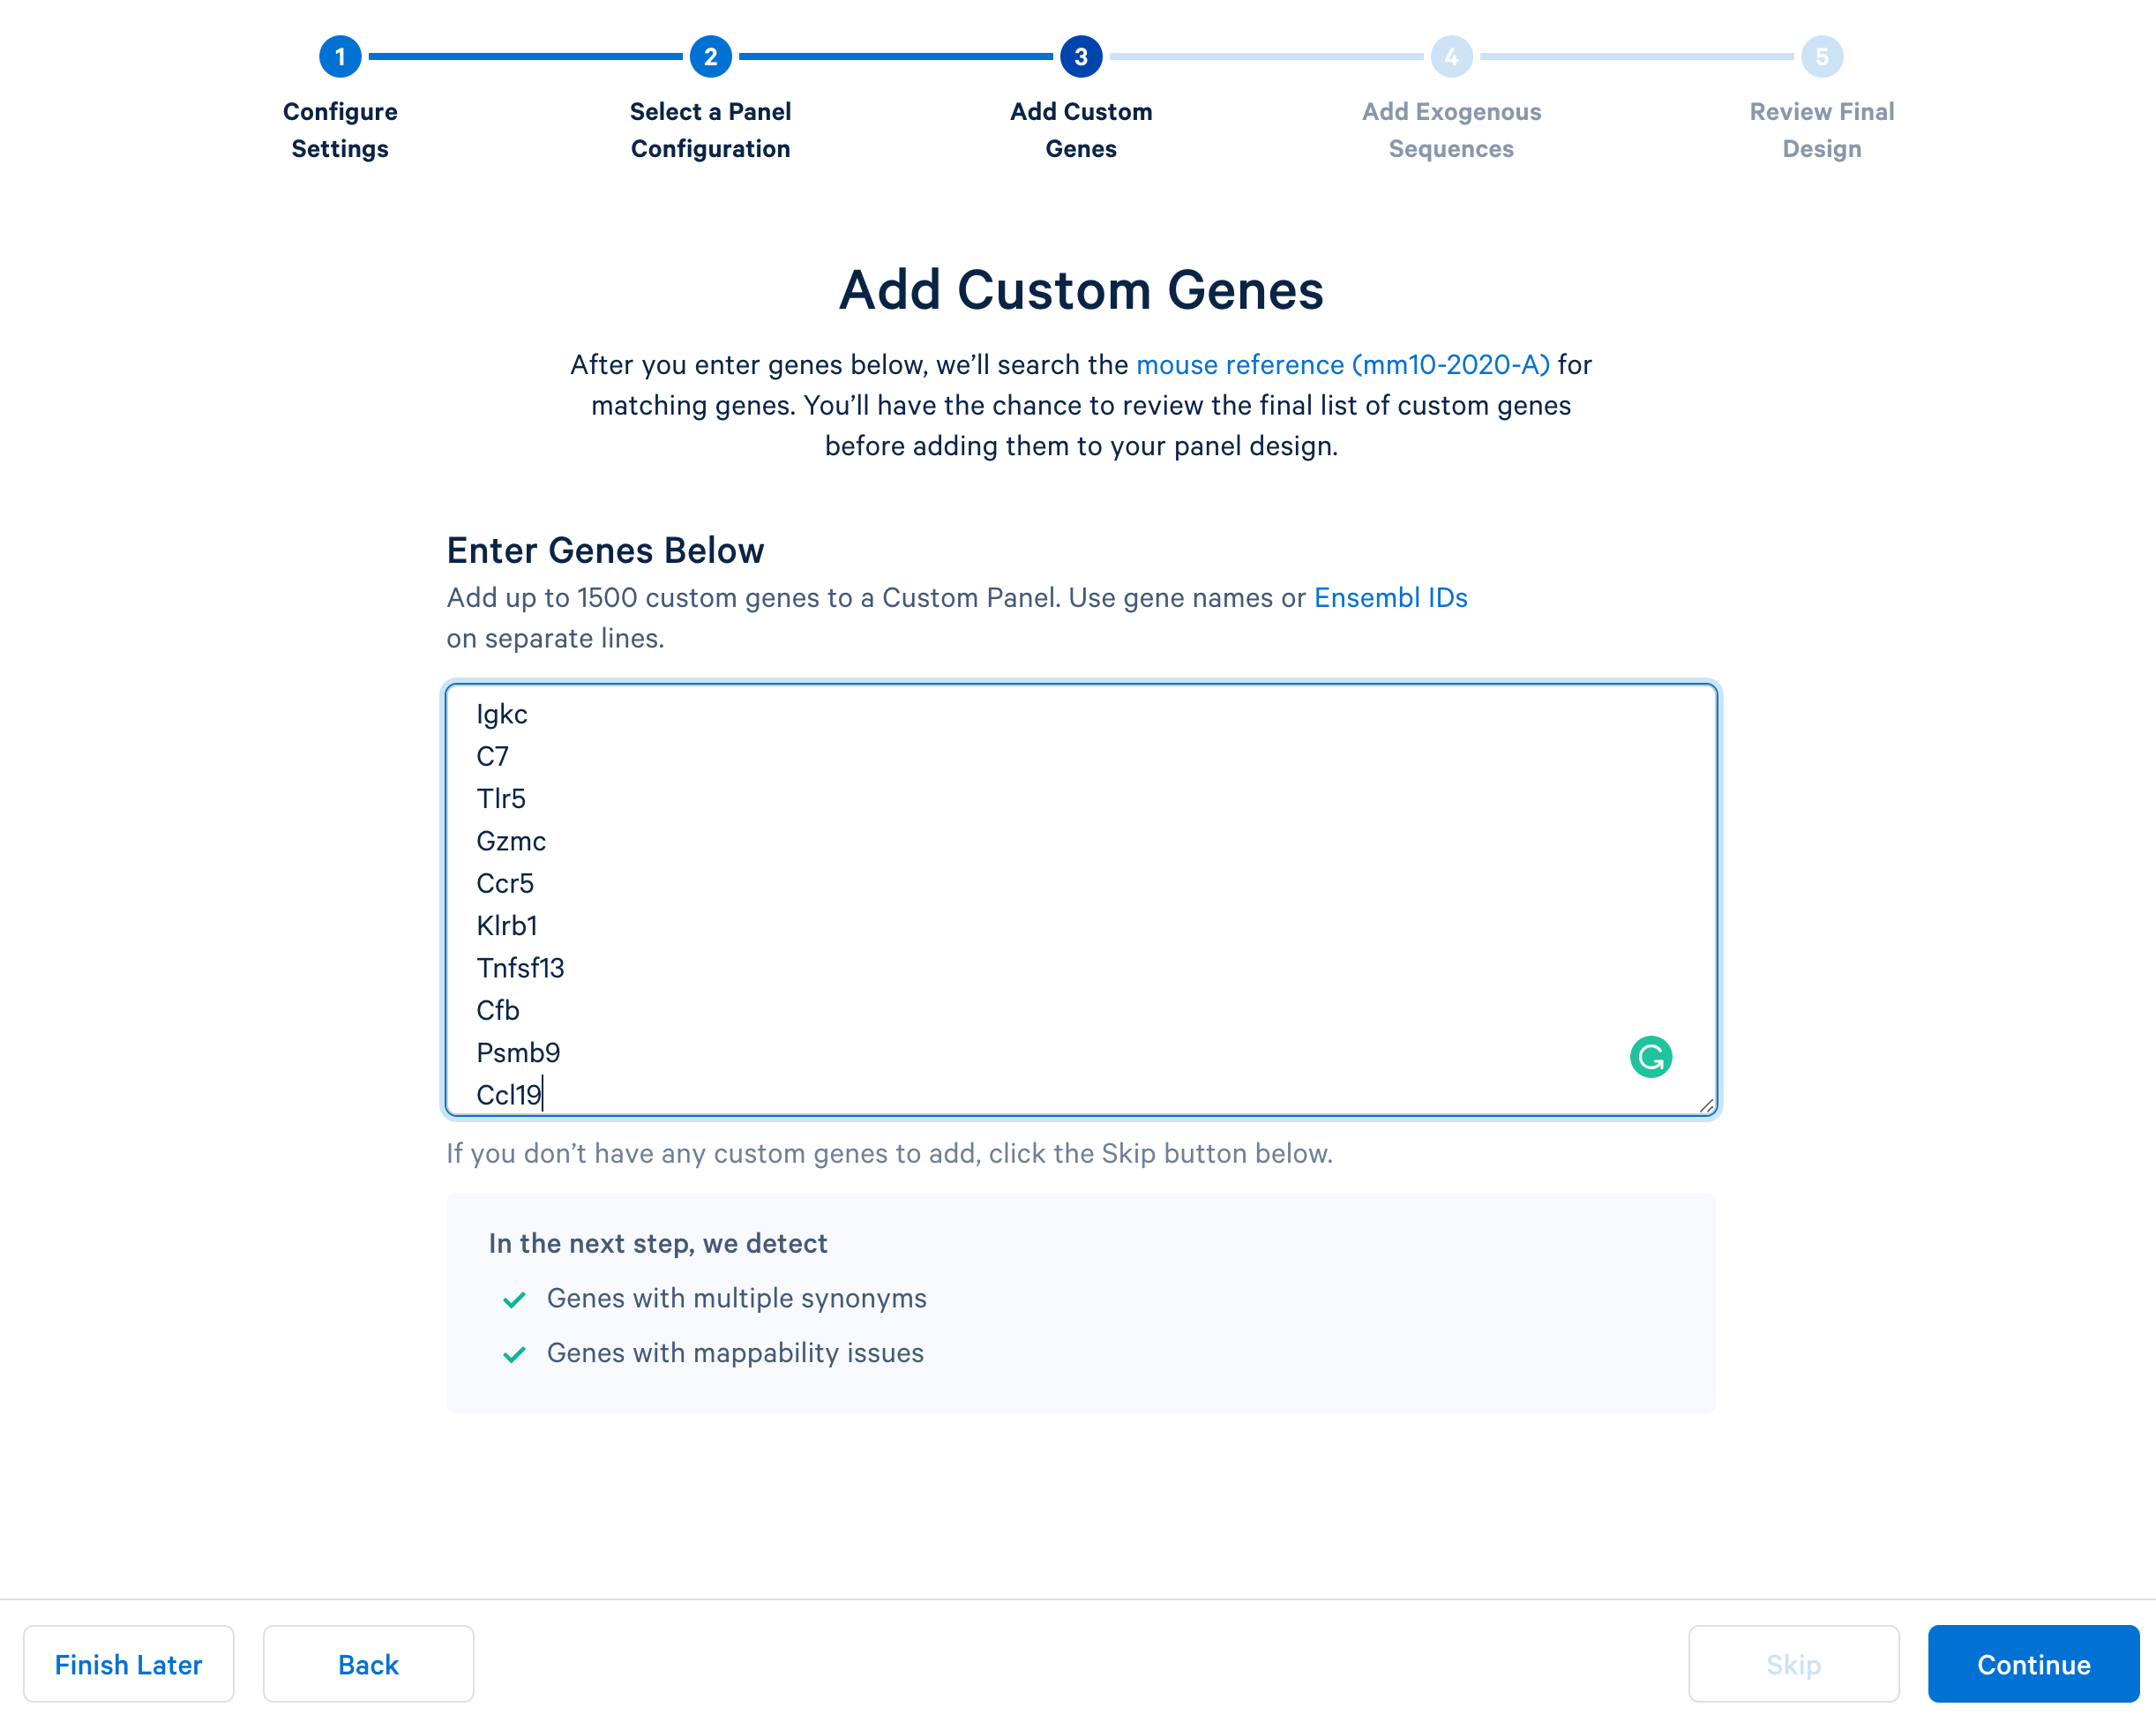
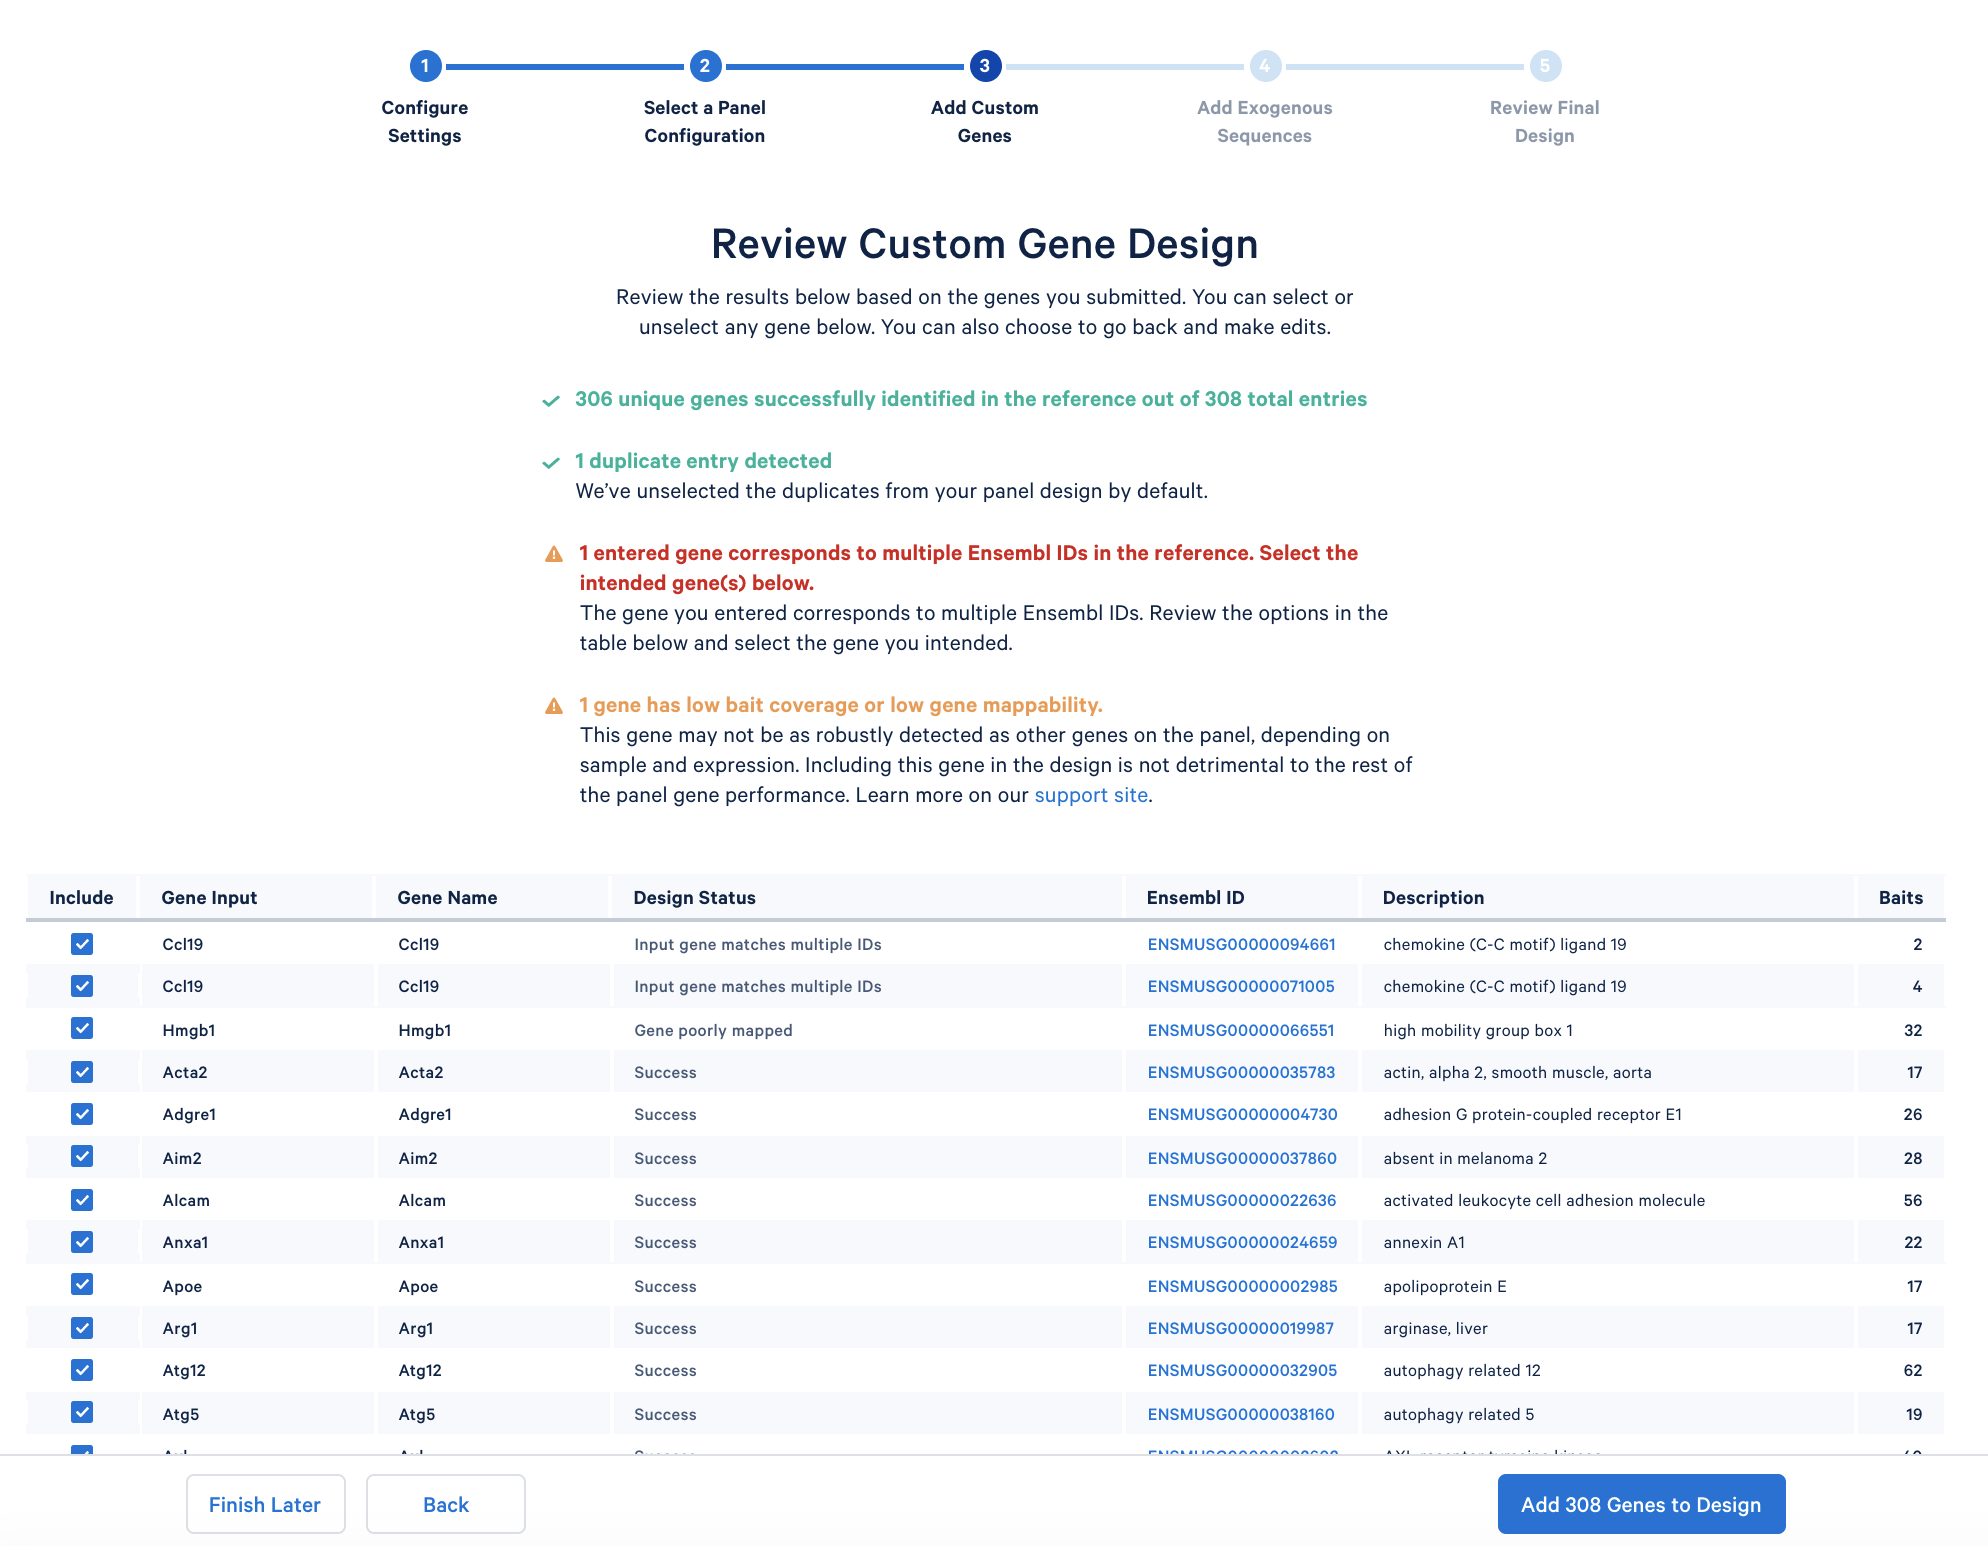
After copying and pasting the list of genes into the window, click “Continue” to review the custom gene design. 10x Genomics has designed baits (see the details of the bait design algorithm) for all mouse genes in the GRCm38-2020-A reference. The designer parses out the pre-designed baits for the list of input genes. The designer will also report errors or warnings if a particular gene name cannot be found in the reference, matches another gene in the given list, or has potential mapping issues.
In the tutorial, the immunology gene list triggers two warnings:
Optionally, add exogenous sequences (such as reporter genes or viral transcripts) to your custom panel design. For simplicity, this tutorial skips this step.
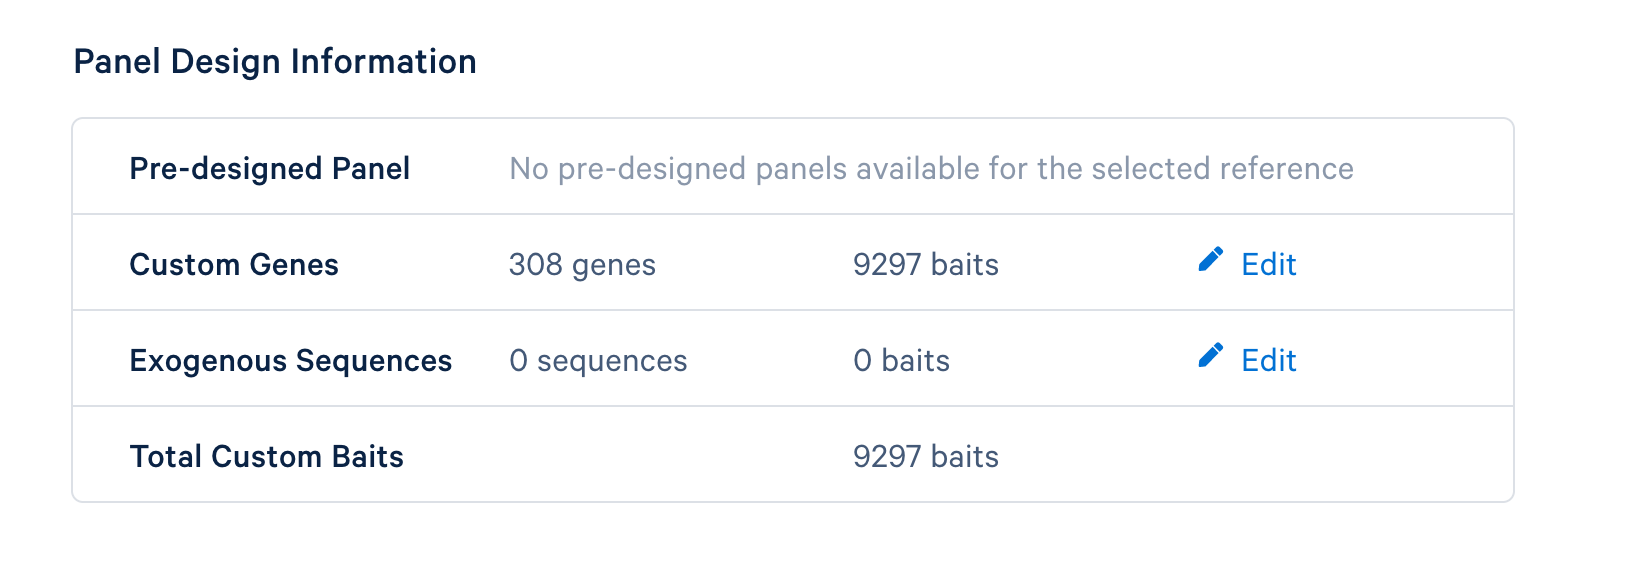
The last step is to review the final design. If everything looks satisfactory, click the ‘Finish and Generate Design Files’ to complete the panel design.
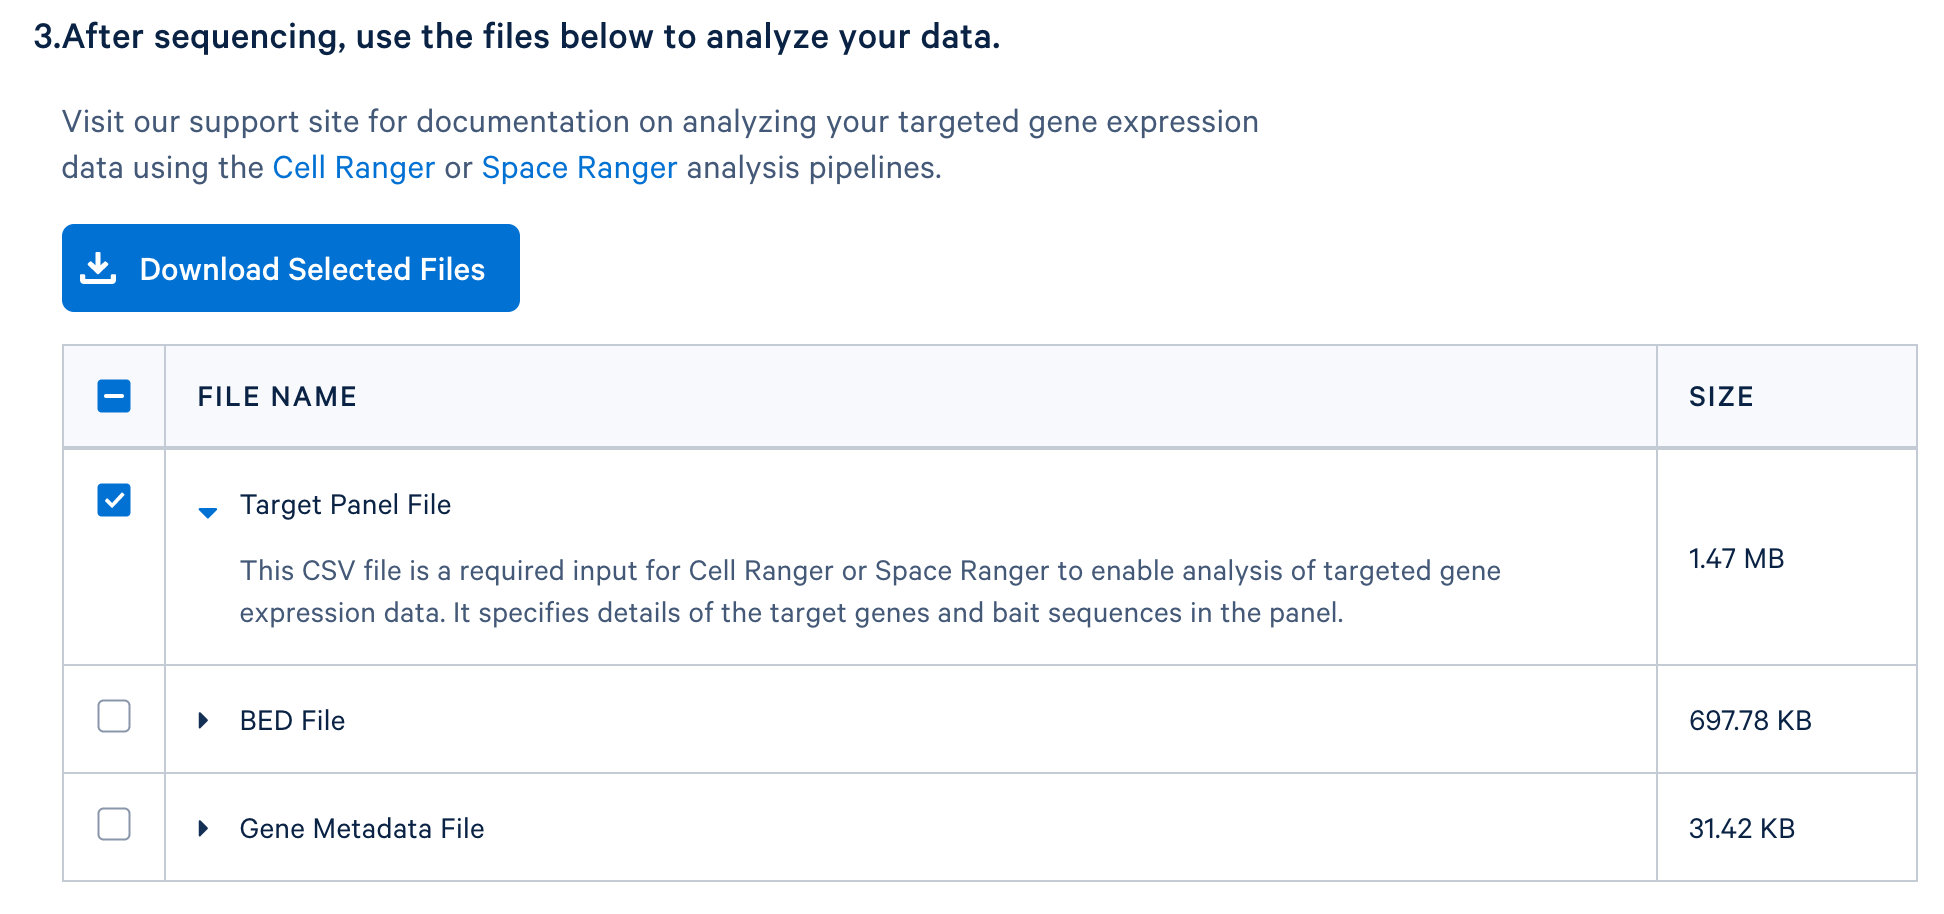
After completing the design, you will be directed to a page with instructions on how to order baits and links to relevant files to download. The target panel CSV file (screenshot below) can be downloaded and used in the later steps of this tutorial.
If you have a whole transcriptome analysis (WTA) dataset from a similar sample, you can use it to evaluate your panel design before ordering it. This computational test can help to assess if the designed panel contains sufficient genes for optimal assay performance and for capturing major cell types of interests. Perform this test by using the WTA FASTQ files to run cellranger count with the --target-panel option, which will force Cell Ranger to run a targeted gene expression analysis.
For this tutorial, the WTA FASTQ files can be downloaded here. In addition to the FASTQ files, the pre-built mouse reference and target panel CSV, generated during the earlier step of this tutorial, are required to run the analysis. After specifying the path to the FASTQ, reference, and target panel CSV file, run cellranger count (version 4.0 and later):
cd ./wta-test/
cellranger count --id=wta-test \
                 --target-panel=/path/to/custom_immuno_mm10.target_panel.csv \
                 --transcriptome=/path/to/refdata-gex-mm10-2020-A \
                 --fastqs=/path/to/wta-fastqs \
                 --localcores=8 --localmem=64
In the resulting web summary, you may see some warnings indicating metrics that are lower than expected. For example, ‘Reads Mapped Confidently to Targeted Transcriptome’ is only 3.1%. This is due to using WTA data as input, where, as expected, many reads will map to genes that were not in the panel. 10x Genomics recommends that the panel genes account for at least 0.1% of the WTA reads for optimal performance. If it is lower than 0.1%, assay performance (including the ability to accurately cluster cells) may be sub-optimal. In that case, it is recommended to add more genes to the panel.
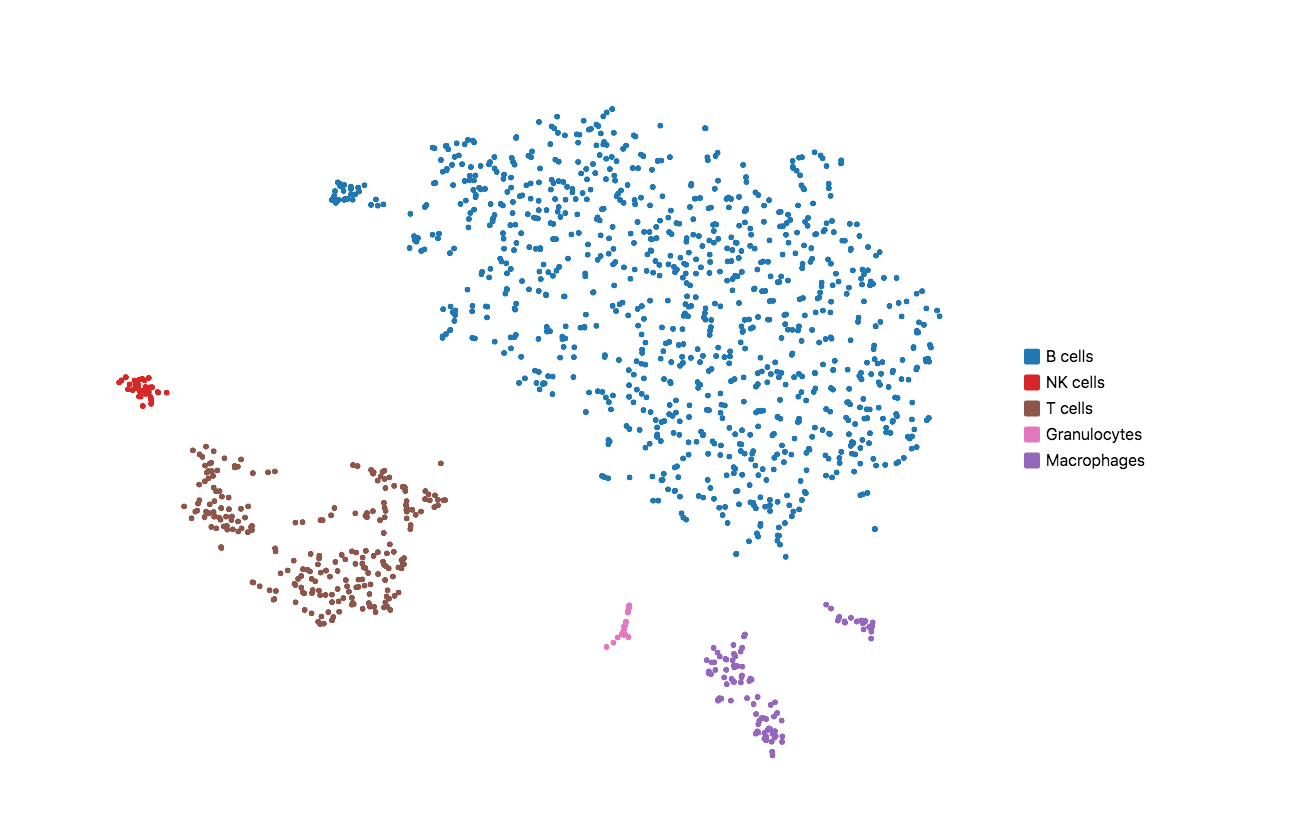
When running Cell Ranger with targeted panels, only targeted genes are included in the secondary analysis (dimensionality reduction, clustering, and visualization). Therefore, t-SNE/UMAP projections and top differentially expressed genes by cluster could be useful to evaluate if the designed panel is able to recapitulate the cell types of interest. Load the cloupe.cloupe file into the Loupe Browser to visualize the data and annotate cell types. Using some well-known immune cell markers (T cells: Cd3d/e; B cells: Cd79a/b; NK cells: Cd3g=0 & Nkg7 > 0; Macrophages: Ifitm3, Cd68; Granulocytes: S100a8, S100a9), one can find all the major cell types in mouse splenocyte. This indicates that the list of genes is sufficient to capture the cell types we are interested in.
If the t-SNE/UMAP and clustering results do not provide enough granularity, you may repeat the design steps to add more representative genes for the cell types you are interested in. Please keep in mind that this computational test requires variable sequencing depth of the WTA data depending on the sample type. For instance, if the WTA was sequenced too shallow for a sample that has minor differential gene expression across the underlying populations, the clustering and dimensional reduction results could be compromised.
After evaluating the panel computationally, you are ready to order the panel and perform the Targeted Gene Expression assay. Please refer to the Targeted Gene Expression - Single Cell User Guide for experimental guidance.
Sequencing depth requirements for Targeted Gene Expression libraries vary based on the complexity and gene expression profile of the sample, as well as the panel size and content. Before sequencing your targeted library, if you have a corresponding WTA dataset, you can use the cellranger targeted-depth pipeline to compute the fraction of reads mapped to targeted genes from the panel. This tool also provides sequencing depth recommendations designed to take advantage of the efficiency enabled by targeting, while sequencing deeply enough to match the sensitivity of the WTA dataset.
In order to run the targeted-depth pipeline you need the molecule_info.h5 file produced by cellranger count from a WTA sample and the target panel CSV file. The targeted panel CSV is the same file downloaded from the panel designer.
cellranger targeted-depth --molecule-h5=molecule_info.h5 \
                          --target-panel=/path/to/custom_immuno_mm10.target_panel.csv > depth_output.txt
The output contains recommended sequencing depths for a Targeted Gene Expression library enriched from the analyzed whole transcriptome library (or one from a similar sample). See more details on this page.
After performing the sample preparation and sequencing your library, run the targeted analysis with Cell Ranger. The overall workflow is the same as described here. When running cellranger count for targeted assay, it is necessary to specify the relevant Target Panel CSV file using the --target-panel parameter:
cd ./targeted/
cellranger count --id=targeted \
                 --target-panel=/path/to/custom_immuno_mm10.target_panel.csv \
                 --transcriptome=/path/to/refdata-gex-mm10-2020-A \
                 --fastqs=/path/to/targeted-fastqs \
                 --localcores=8 --localmem=64
After completing the analysis, review the web summary to assess the overall sample quality. Follow the suggestions in this Technical Note for evaluating sample quality. Information about targeted-specific metrics and plots can be found on this page.
If you have sequenced both the targeted and ‘parent’ library (the starting input library from your targeted assay), you could use the targeted-compare pipeline to directly compare the two datasets. This pipeline can be used to assess targeting performance with greater accuracy than when only the targeted data are known. This comparative analysis provides quality control metrics to verify the extent to which targeted genes were enriched and the parent sample data were recovered.
If you have multiple targeted samples and would like to compare them and perform additional analysis, you could combine them using the cellranger aggr pipeline.
Finally, you could load the output cloupe file to visualize and further analyze the data in Loupe Browser.