Cell Ranger7.1, printed on 04/06/2025
The cellranger multi pipeline outputs an interactive
web_summary.html file that contains summary metrics and automated secondary
analysis results. If an issue was detected during the pipeline run, an alert
appears on this page (see also the
Cell Ranger troubleshooting documentation).
The web_summary.html file is also the starting point for quality control on
experiments run through cellranger multi, introduced in Cell Ranger
6.0.
The cellranger multi pipeline’s web summary has three views: Cells, Library, and Experimental Design:
 |
|
The Cells and Library views both have a Gene Expression tab, which displays tables and plots depending on the experimental design (single sample, multiplexed samples). There are also additional tabs and metrics associated with Feature Barcode analysis (Antibody, CRISPR, Multiplexing).
The Experimental Design view has the same layout for all assay types. Click the question mark ? symbol to read descriptions for each section and metric.
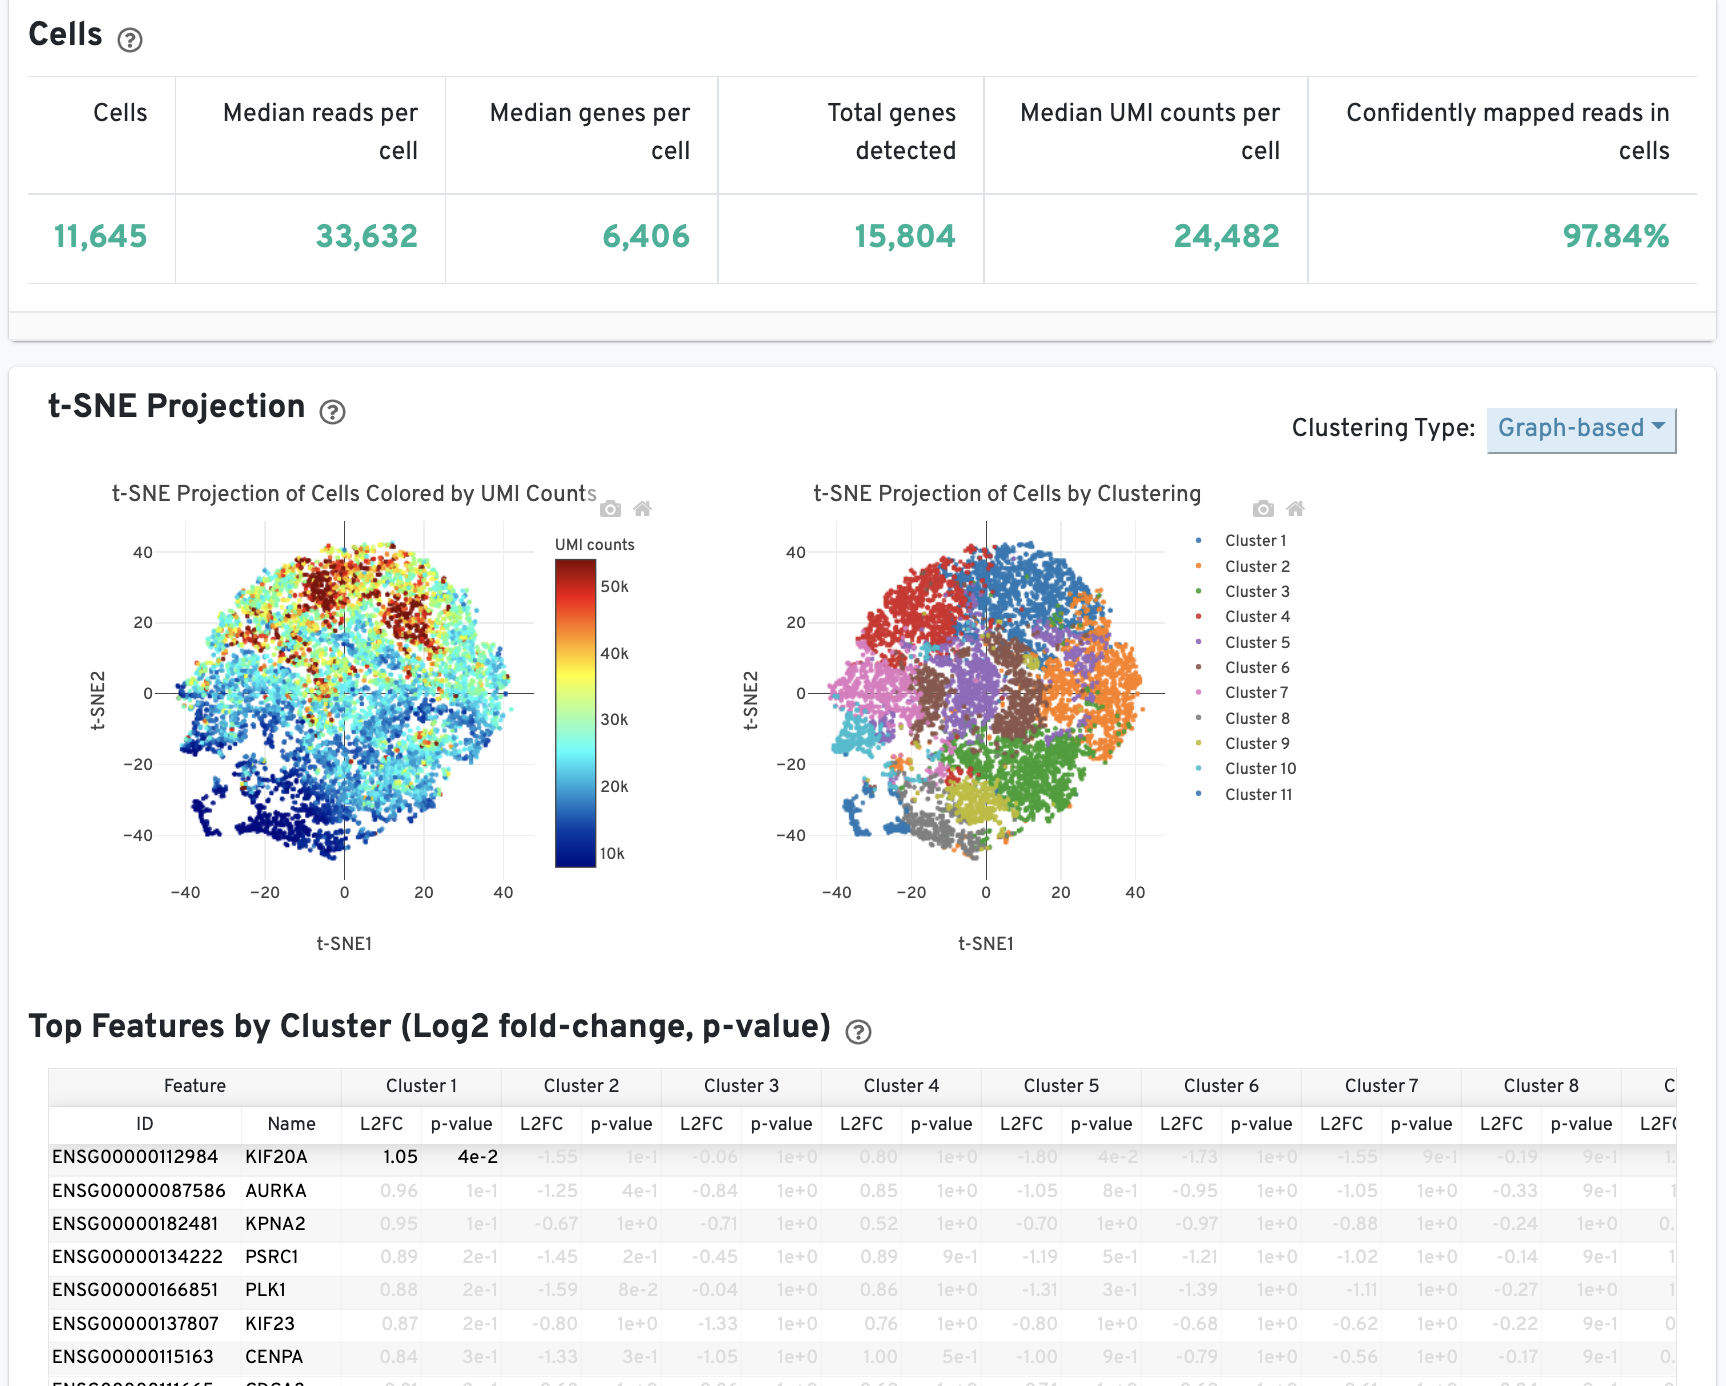
Below is the web summary layout for a single sample ("singleplex") Fixed RNA Profiling experiment. An example dataset is available for 10k human K562-r cells. The additional tab for the Antibody Capture results is shown in the Antibody tab section.
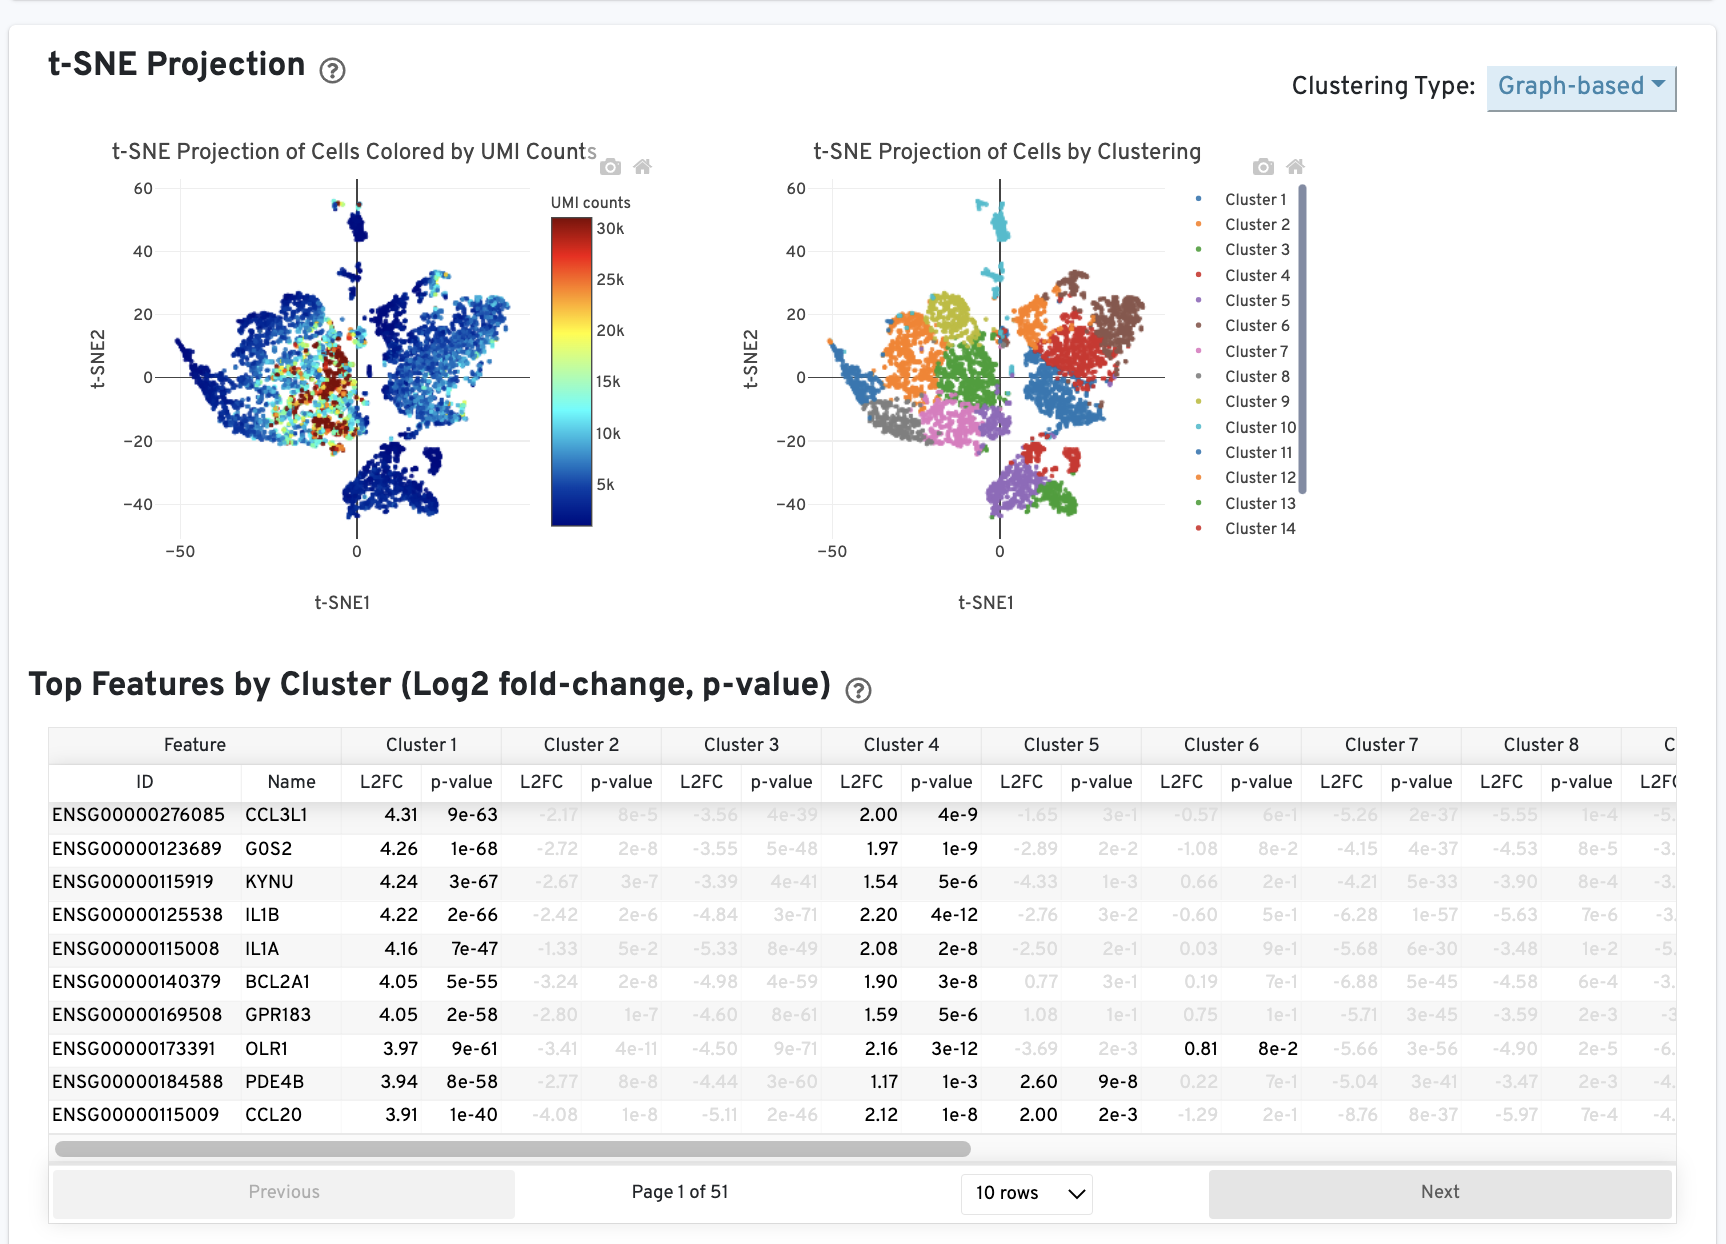
The Cells table contains the most important hero metrics for the sample. The t-SNE Projection section shows the data reduced to two dimensions, colored by UMI count or clustering (Graph-based by default). It is a good starting point to explore structure in the data. The Top Features by Cluster table shows the results of a differential gene expression analysis among clusters (Graph-based clusters by default). Click the question mark ? to read full descriptions for each one.
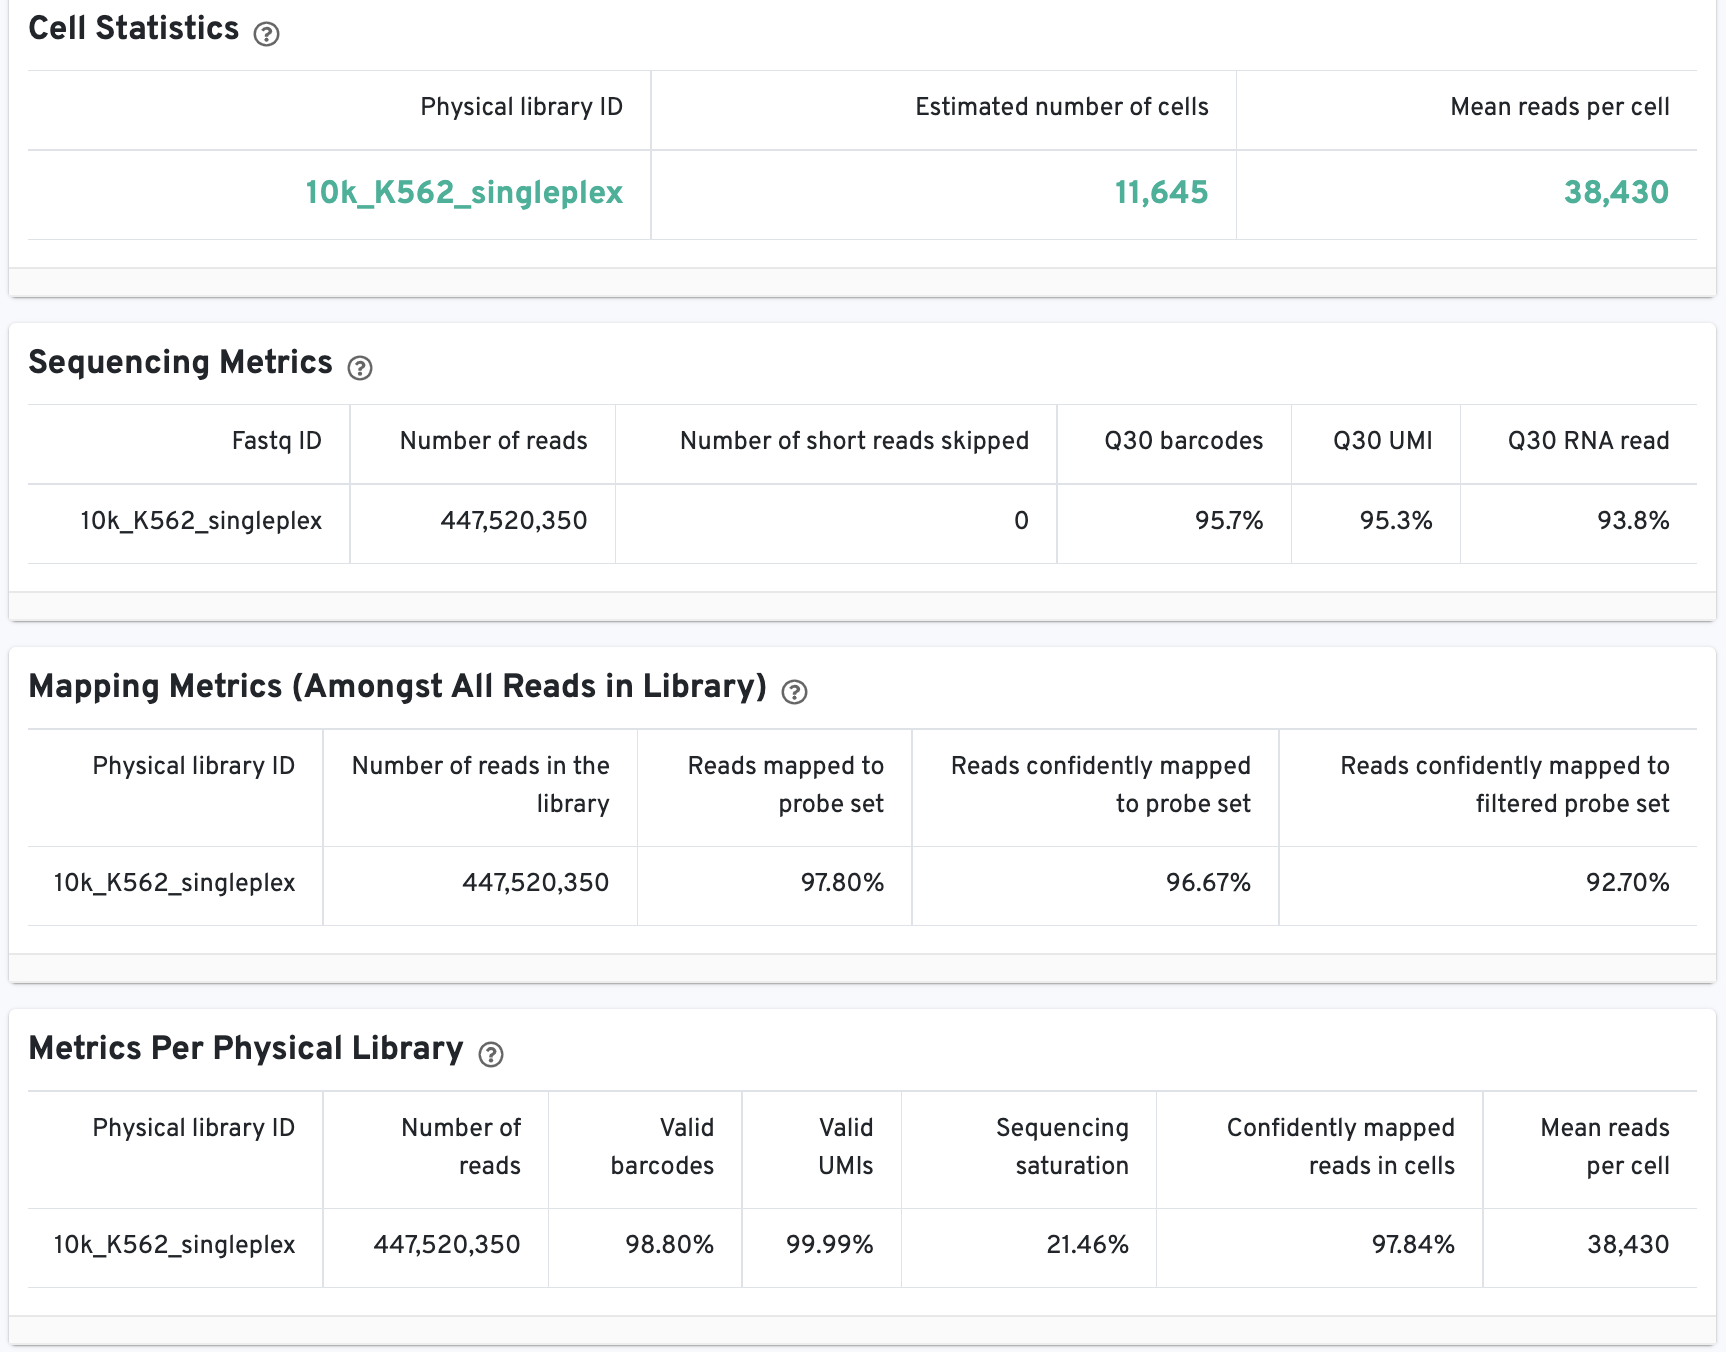
The Cell Statistics table displays the most important results of the experiment. Additional metrics are displayed below the hero metrics in the Sequencing Metrics, Mapping Metrics, and Metrics per Physical Library tables. Click the question mark ? to read full descriptions for each one.
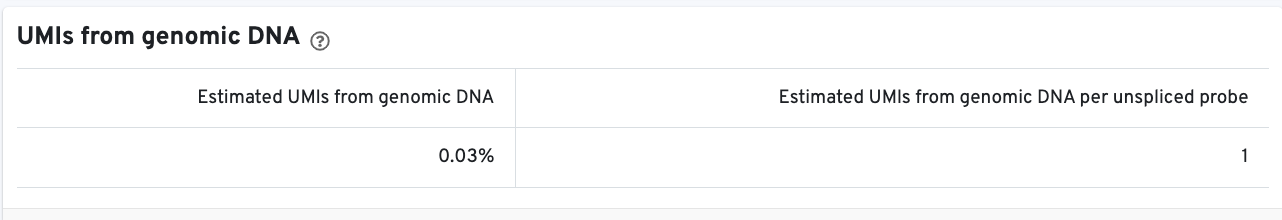
Starting in Cell Ranger v7.1, the web summary Library view for Fixed RNA Profiling datasets will report genomic DNA metrics.
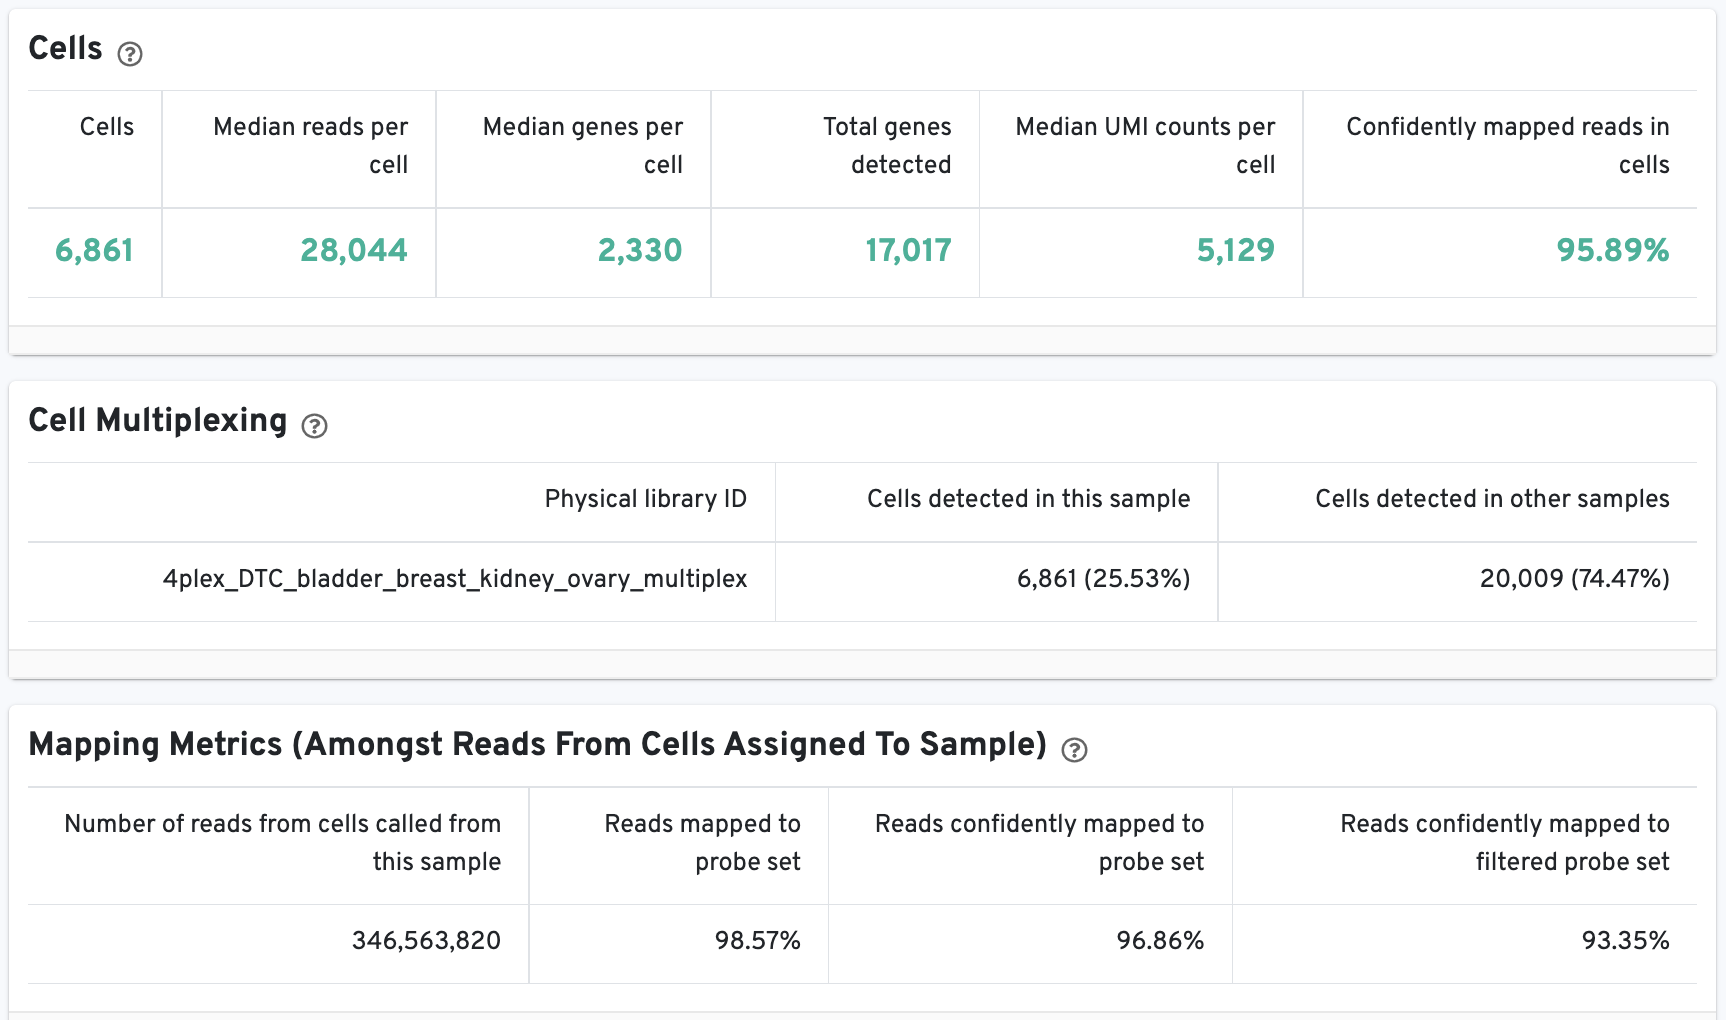
The web summary layout is similar for 3’ Cell Multiplexing and Fixed RNA Profiling for Multiplexed Samples (an example is available for 40k mixture of dissociated tumor cells from four donors).
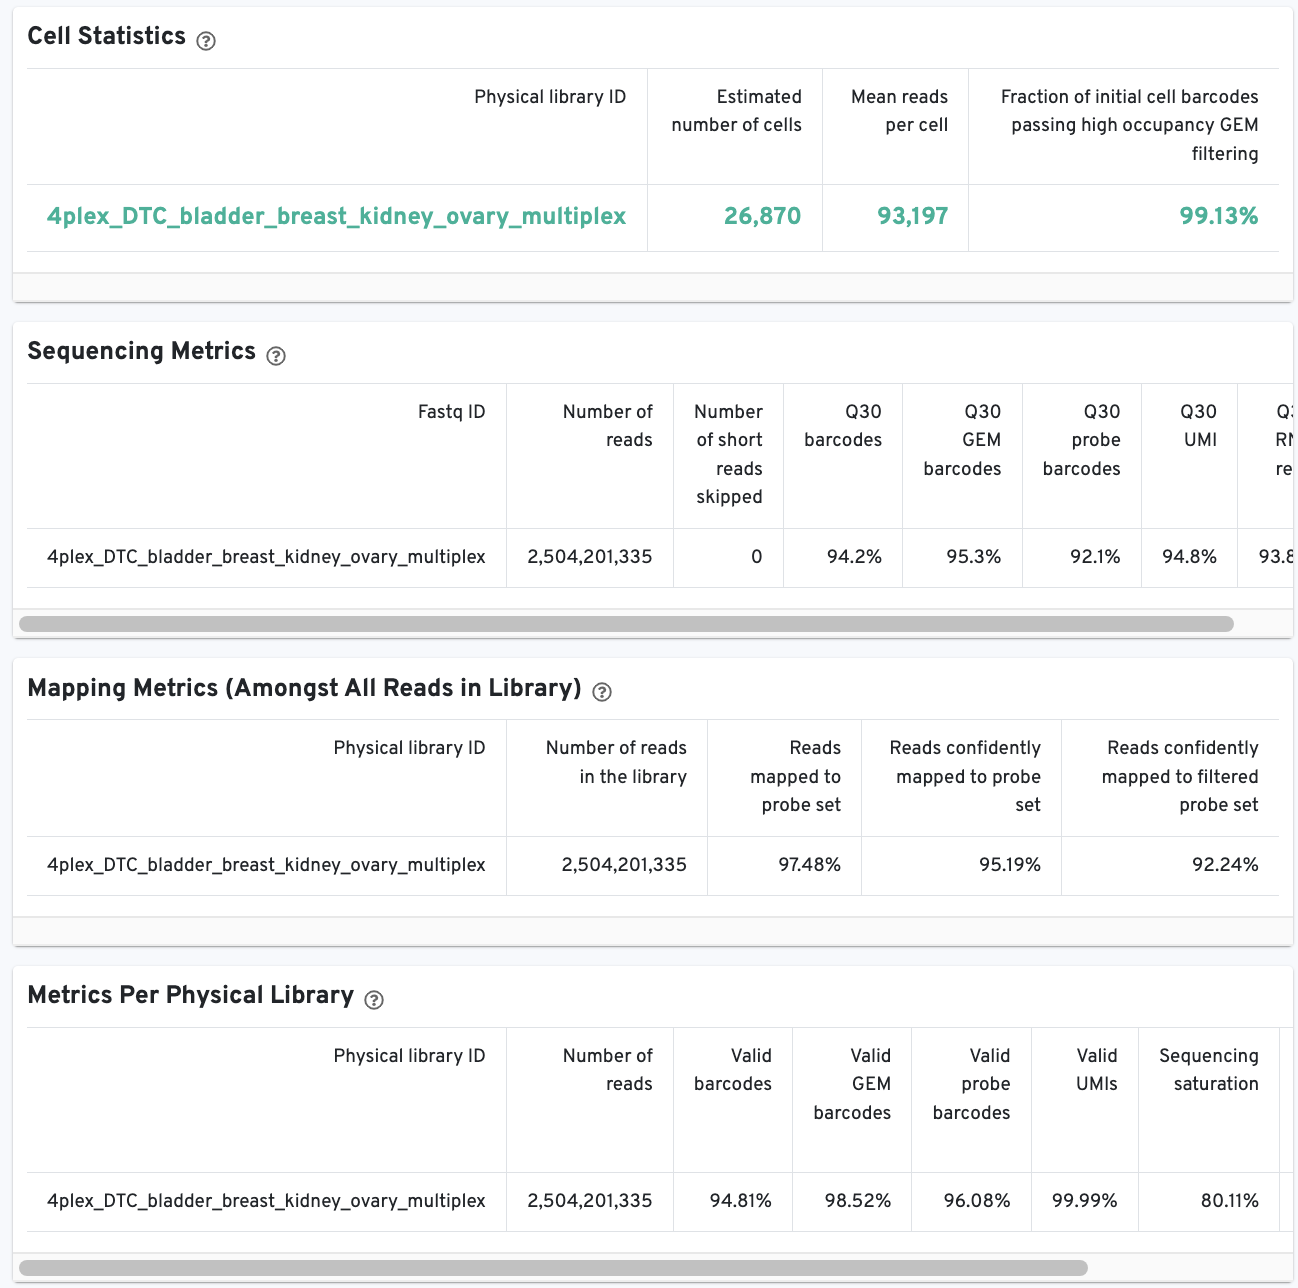
Starting in Cell Ranger v7.1, the web summary Cells and Library views for Fixed RNA Profiling datasets will report genomic DNA metrics.
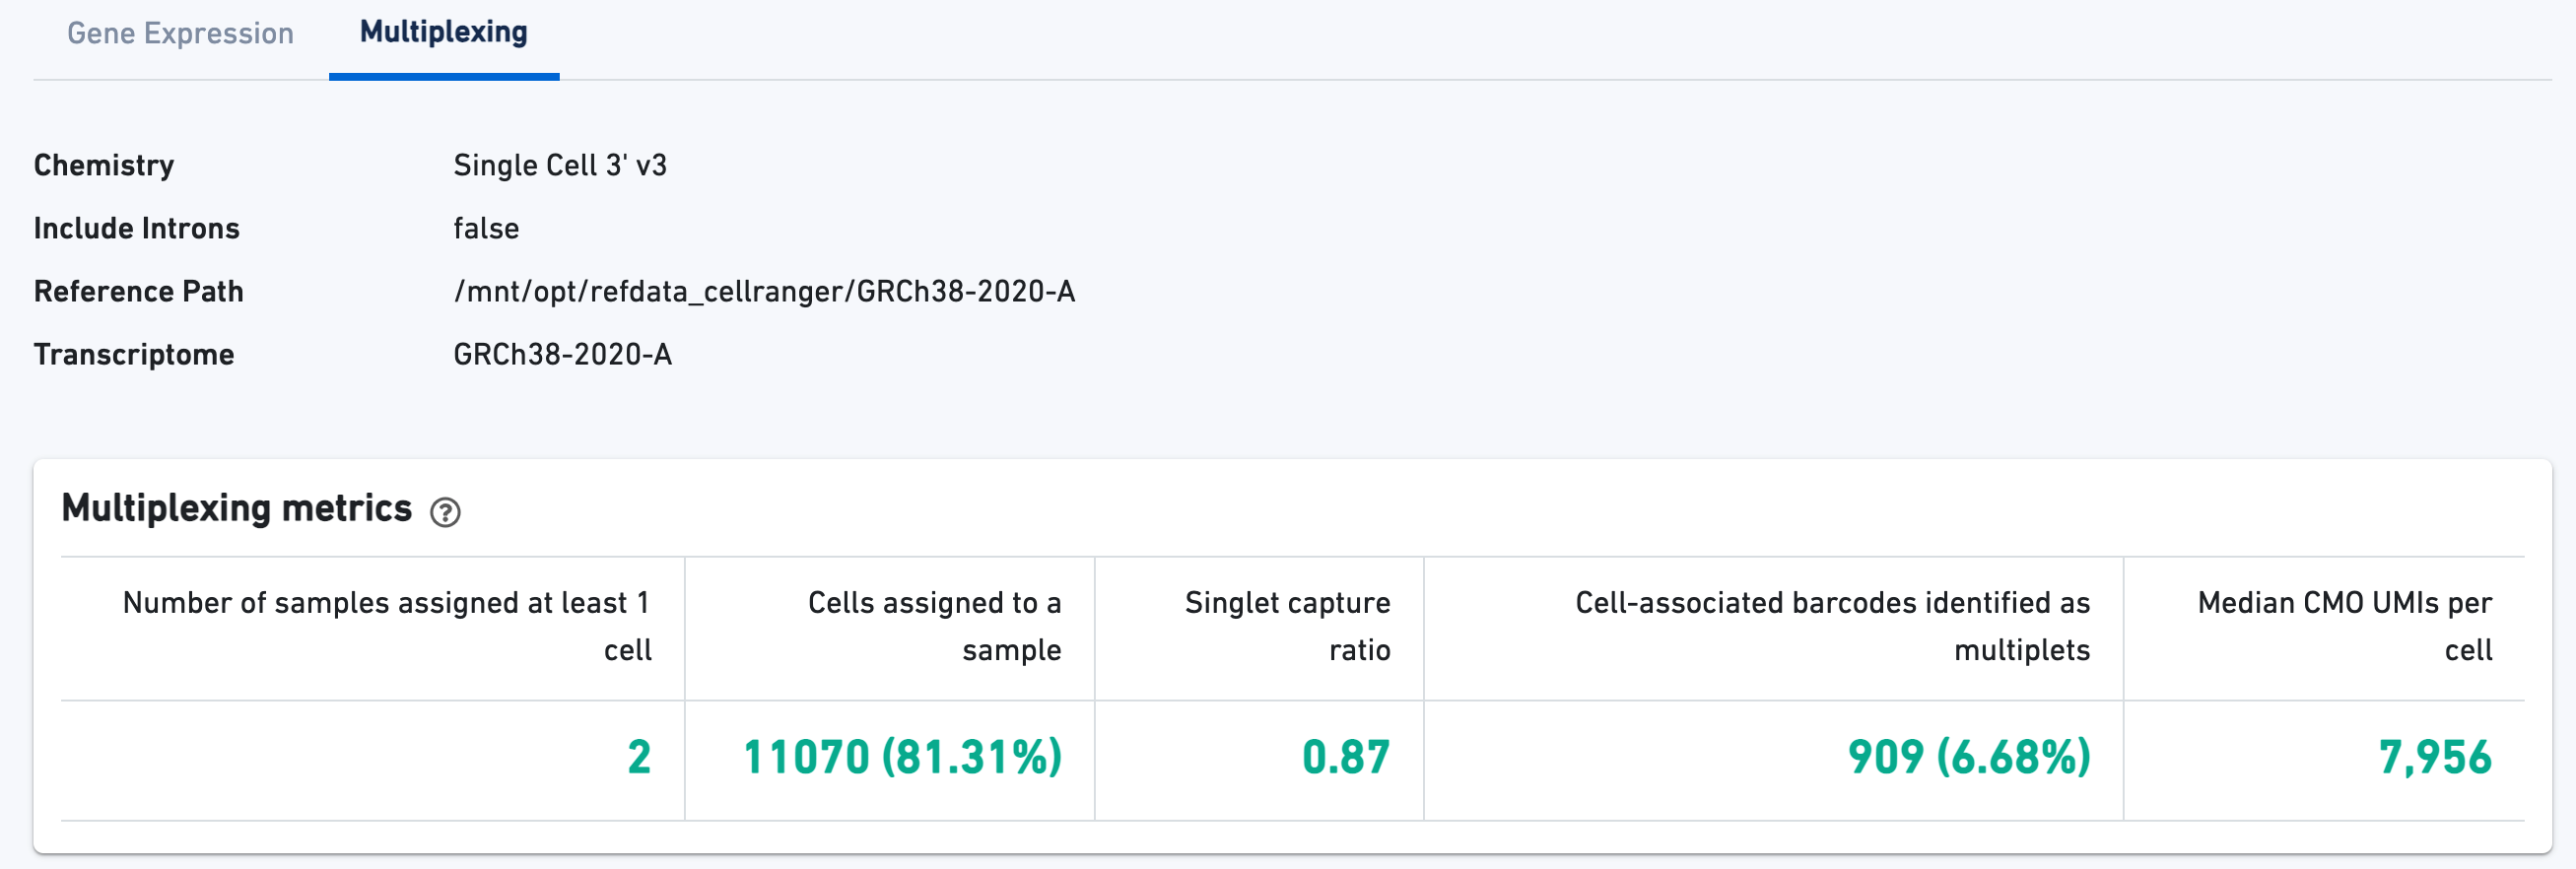
Starting with the Cell view, note key metadata, such as the reagent chemistry, transcriptome version, and reference path at the top of the summary.
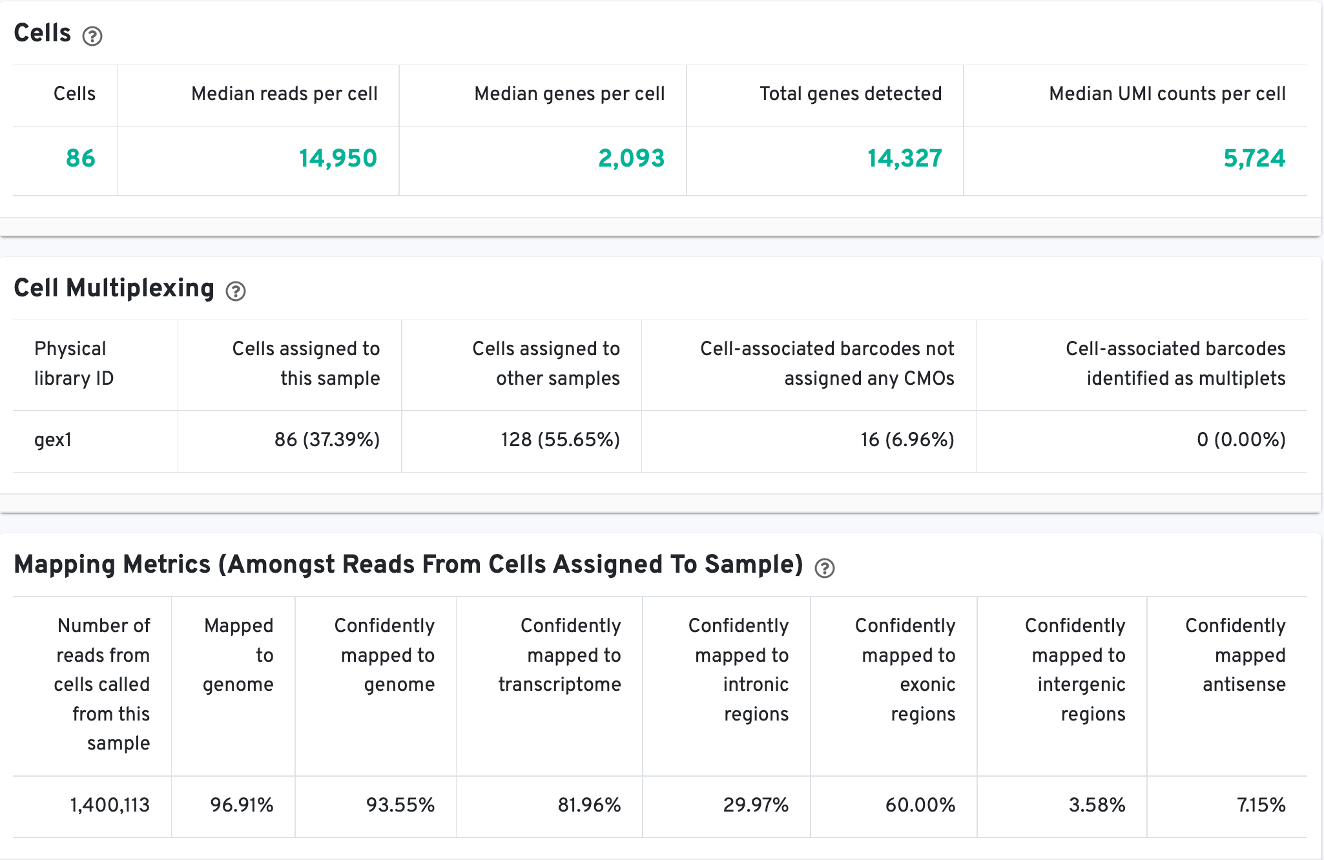
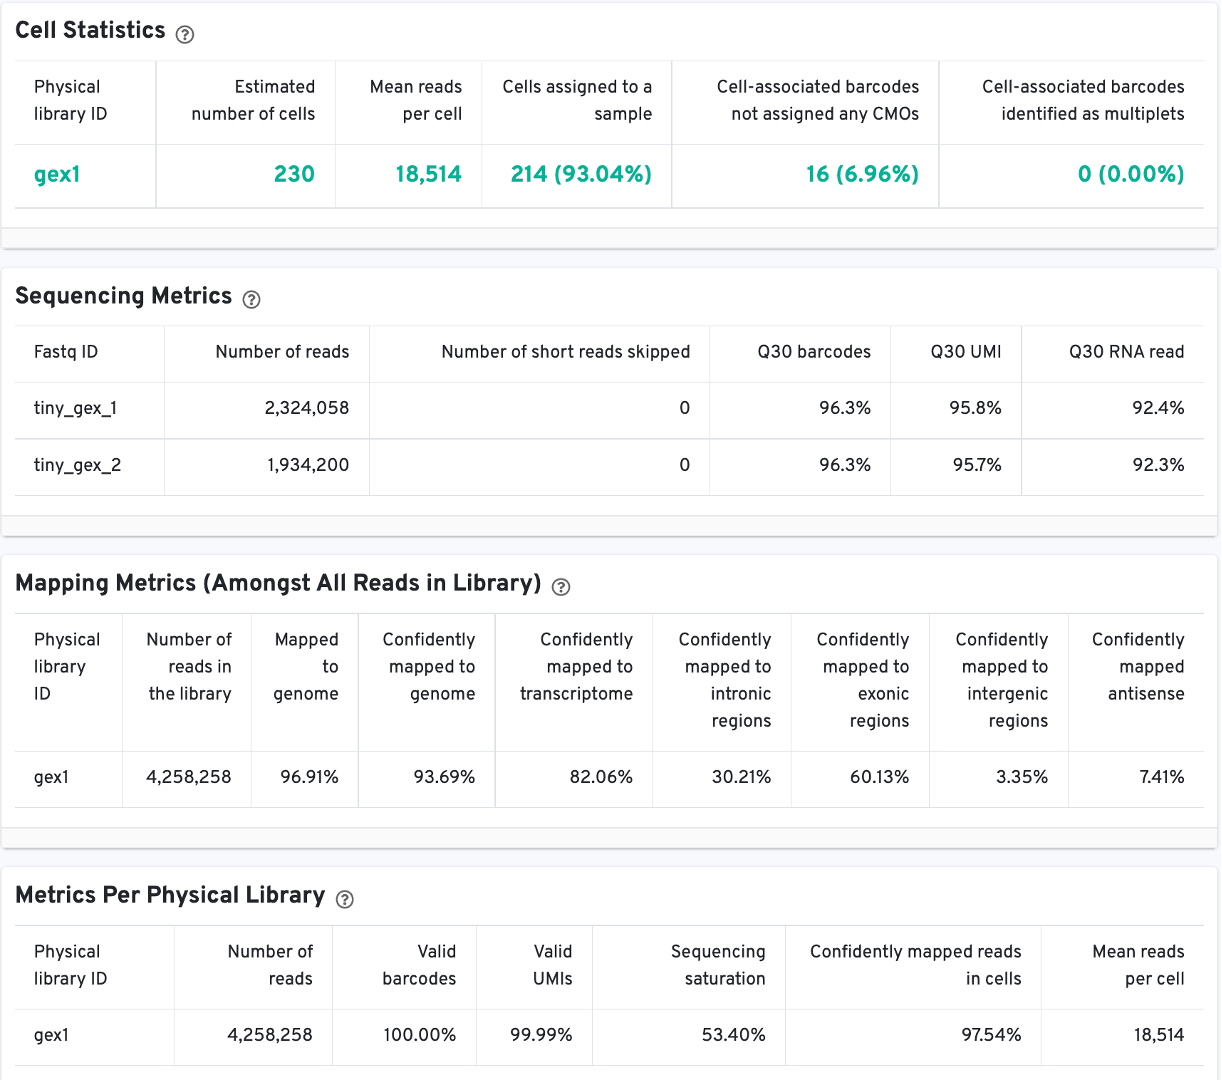
The Cells table contains the most important hero metrics for the sample. The Cell Multiplexing table contains metrics specific to multiplexed experiments (3' Cell Multiplexing or multiplex Fixed RNA Profiling) for the sample, and the Mapping Metrics table contains metrics regarding how reads mapped to the reference. Click the question mark ? to read full descriptions for each one.
The t-SNE Projection section shows the data reduced to two dimensions, colored by UMI count or clustering (Graph-based by default). It is a good starting point to explore structure in the data. The Top Features by Cluster table shows the results of a differential gene expression analysis among clusters (Graph-based clusters by default).
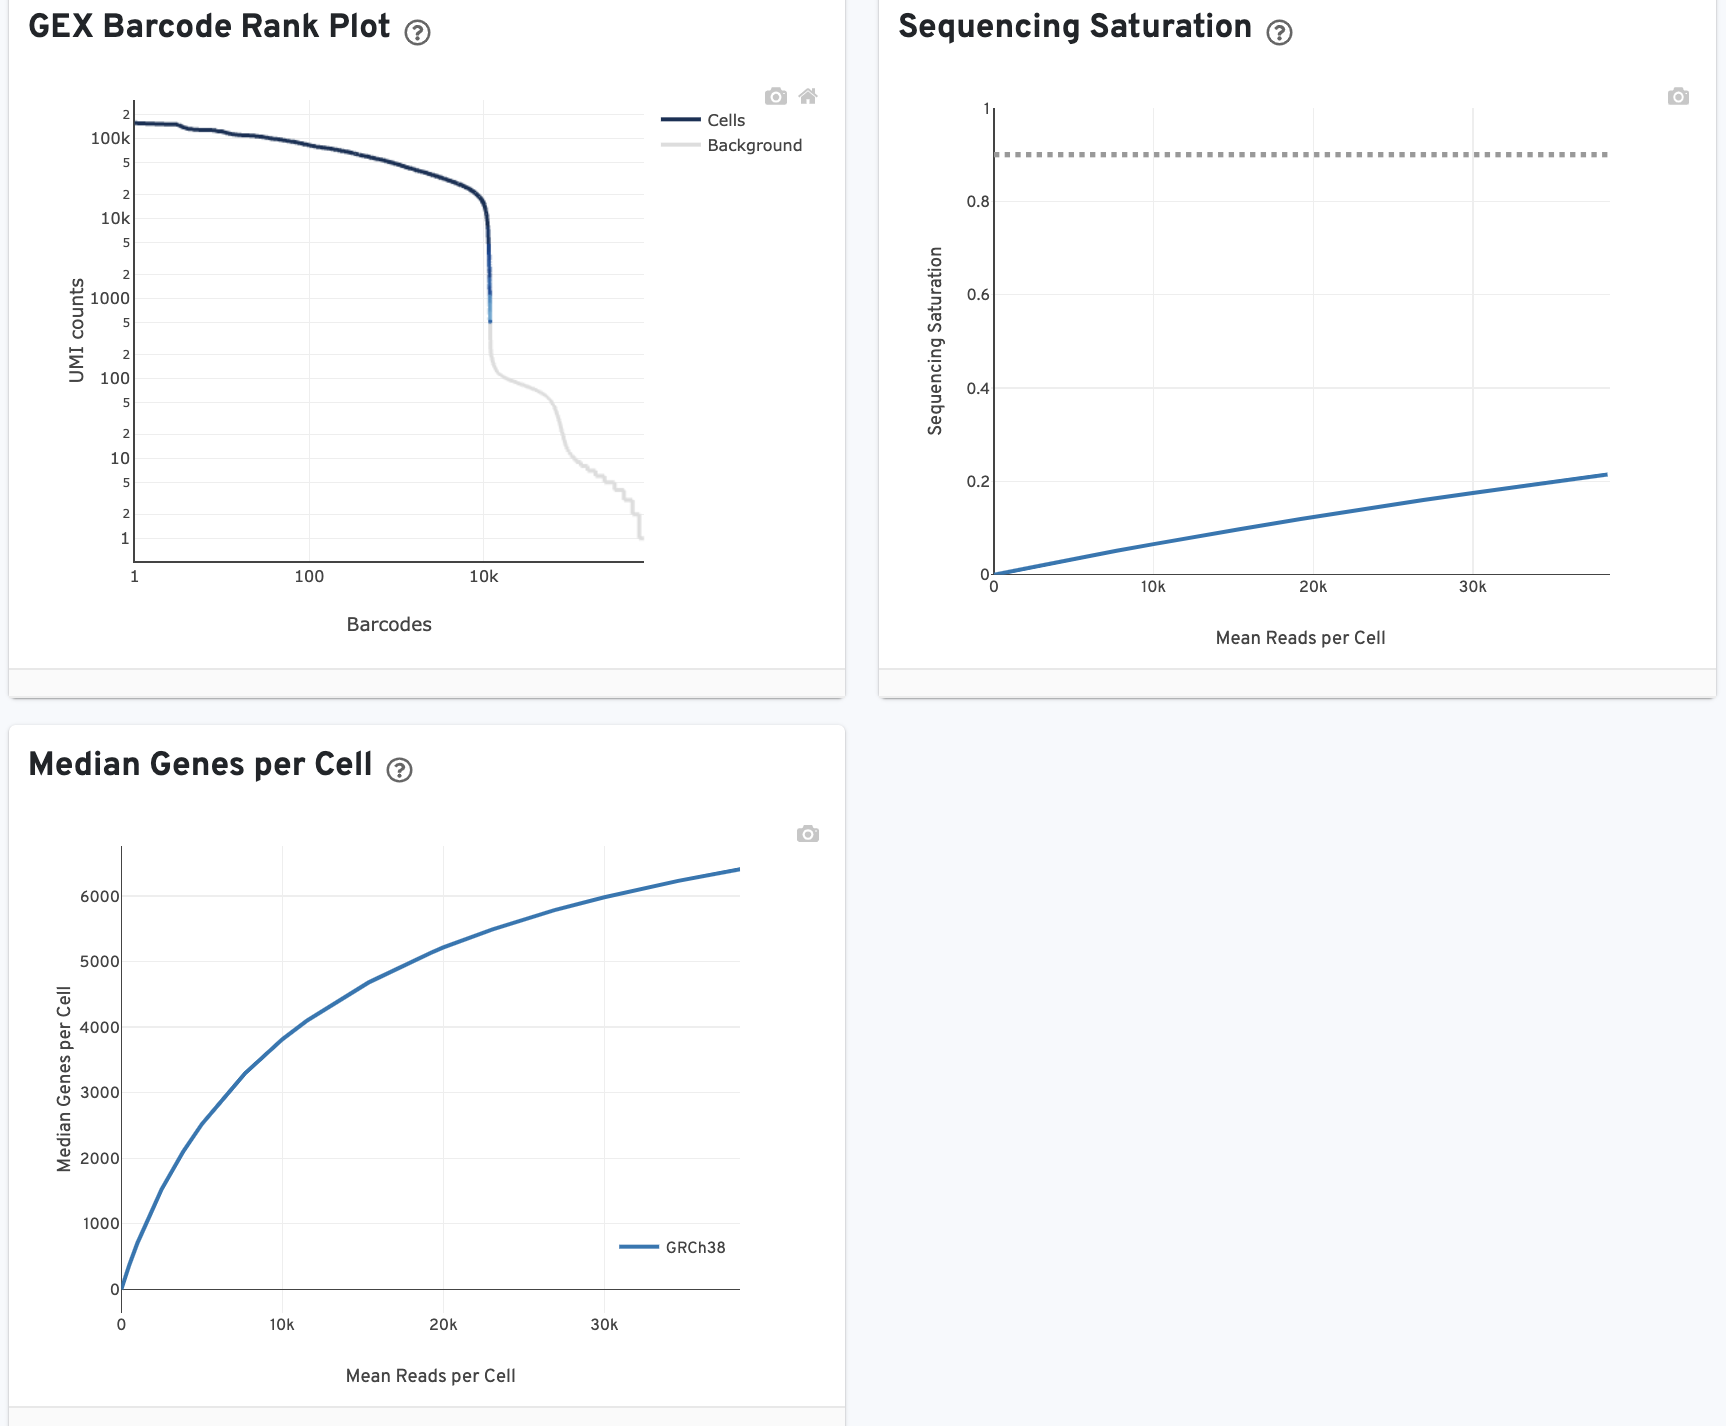
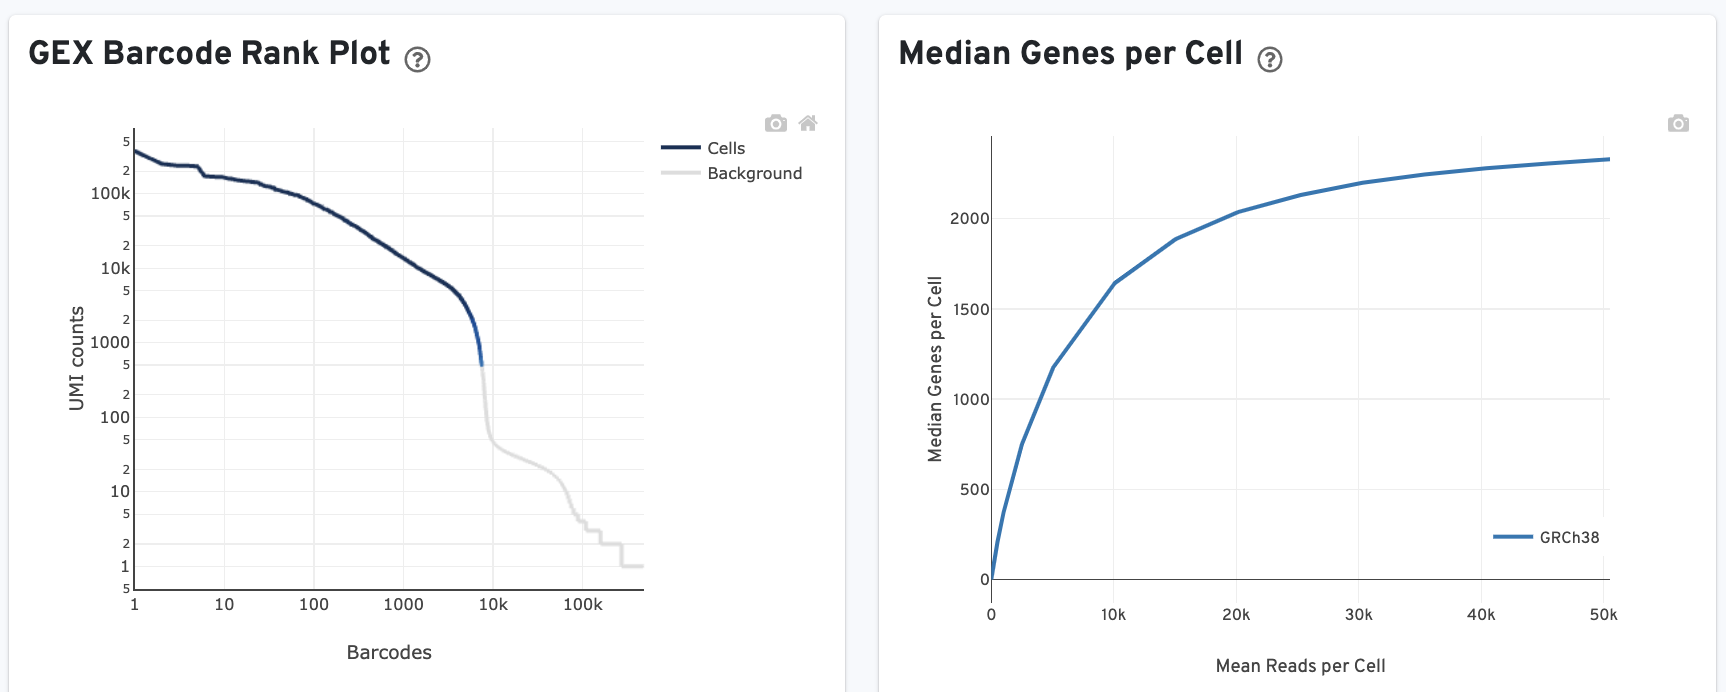
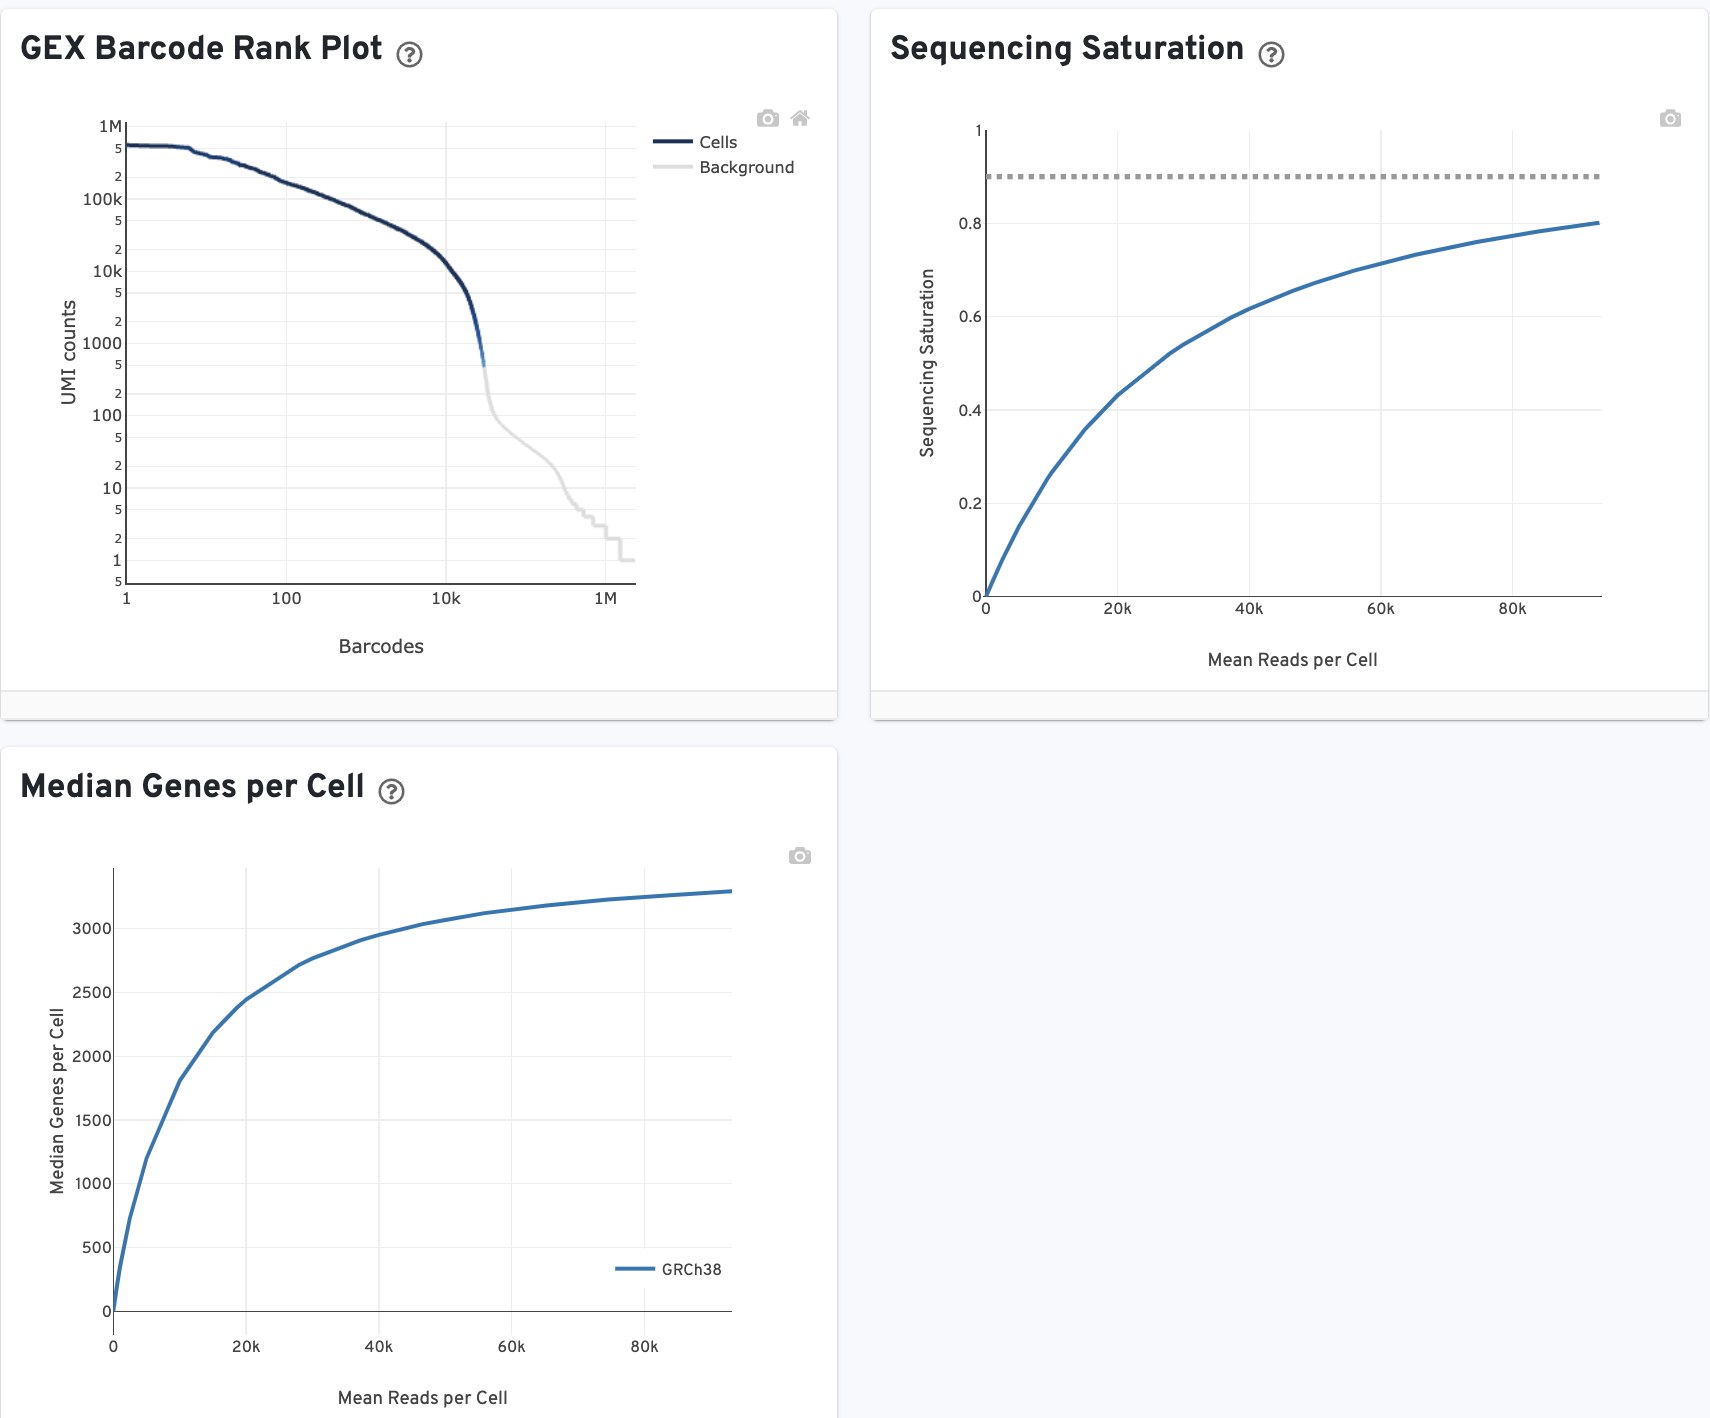
The GEX Barcode Rank Plot shows the count of filtered UMIs mapped to each barcode. Note: this plot is only shown in the Library tab for 3’ Cell Multiplexing experiments because cell calling is performed for the whole library, not for individual samples (see Cell Multiplexing Algorithms Overview for the pipeline steps). Read this Guided Tour of the Barcode Rank Plot for more details on its uses and interpretations.
The Median Genes per Cell plot shows the Median Genes per Cell as a function of downsampled sequencing depth in mean reads per cell, up to the observed sequencing depth.
Next switch to the Library view.
All web summaries have a Gene Expression tab that shows metrics calculated for the physical library. As with the Cells view, metadata for the physical library is displayed on top.
The Cell Statistics table displays the most important results of the experiment. Additional metrics are displayed below the hero metrics in the Sequencing Metrics, Mapping Metrics, and Metrics per Physical Library tables. Click the question mark ? to read full descriptions for each one.
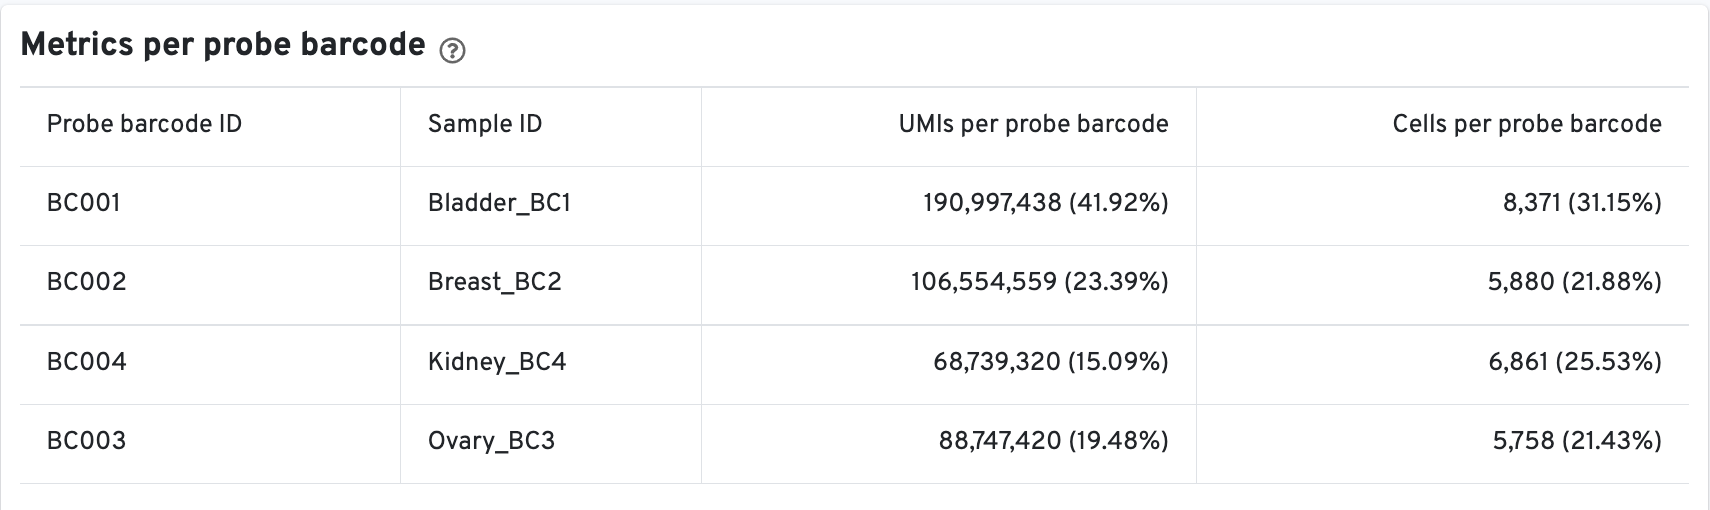
There is an additional Metrics per probe barcode table for multiplexed Fixed
RNA Profiling analysis. This table is useful for troubleshooting, for example to
identify when a probe barcode was used but not included in the
multi config CSV [samples] section, or when a
probe barcode was not used but was included in the [samples] section.
Note: When Feature Barcode libraries are present in the analysis, the web summary provides the total number of sequenced reads assigned to a given sample for the Gene Expression library (Number of reads from cells called from this sample). The BAM file contains records for both Gene Expression and Feature Barcode libraries.
3' Cell Multiplexing libraries have an additional Multiplexing tab in the Library view that shows metadata and hero metrics for the CMO physical libraries. Click the question mark ? to read full descriptions for each one. For interpretation and troubleshooting guidance, please read the Interpreting Cell Ranger Multi Web Summary Files for Single Cell 3' Gene Expression with Feature Barcode technology for Cell Multiplexing technical note.
Here is an example web summary from a public dataset consisting of two multiplexed samples representing different cell lines, Jurkat and Raji.
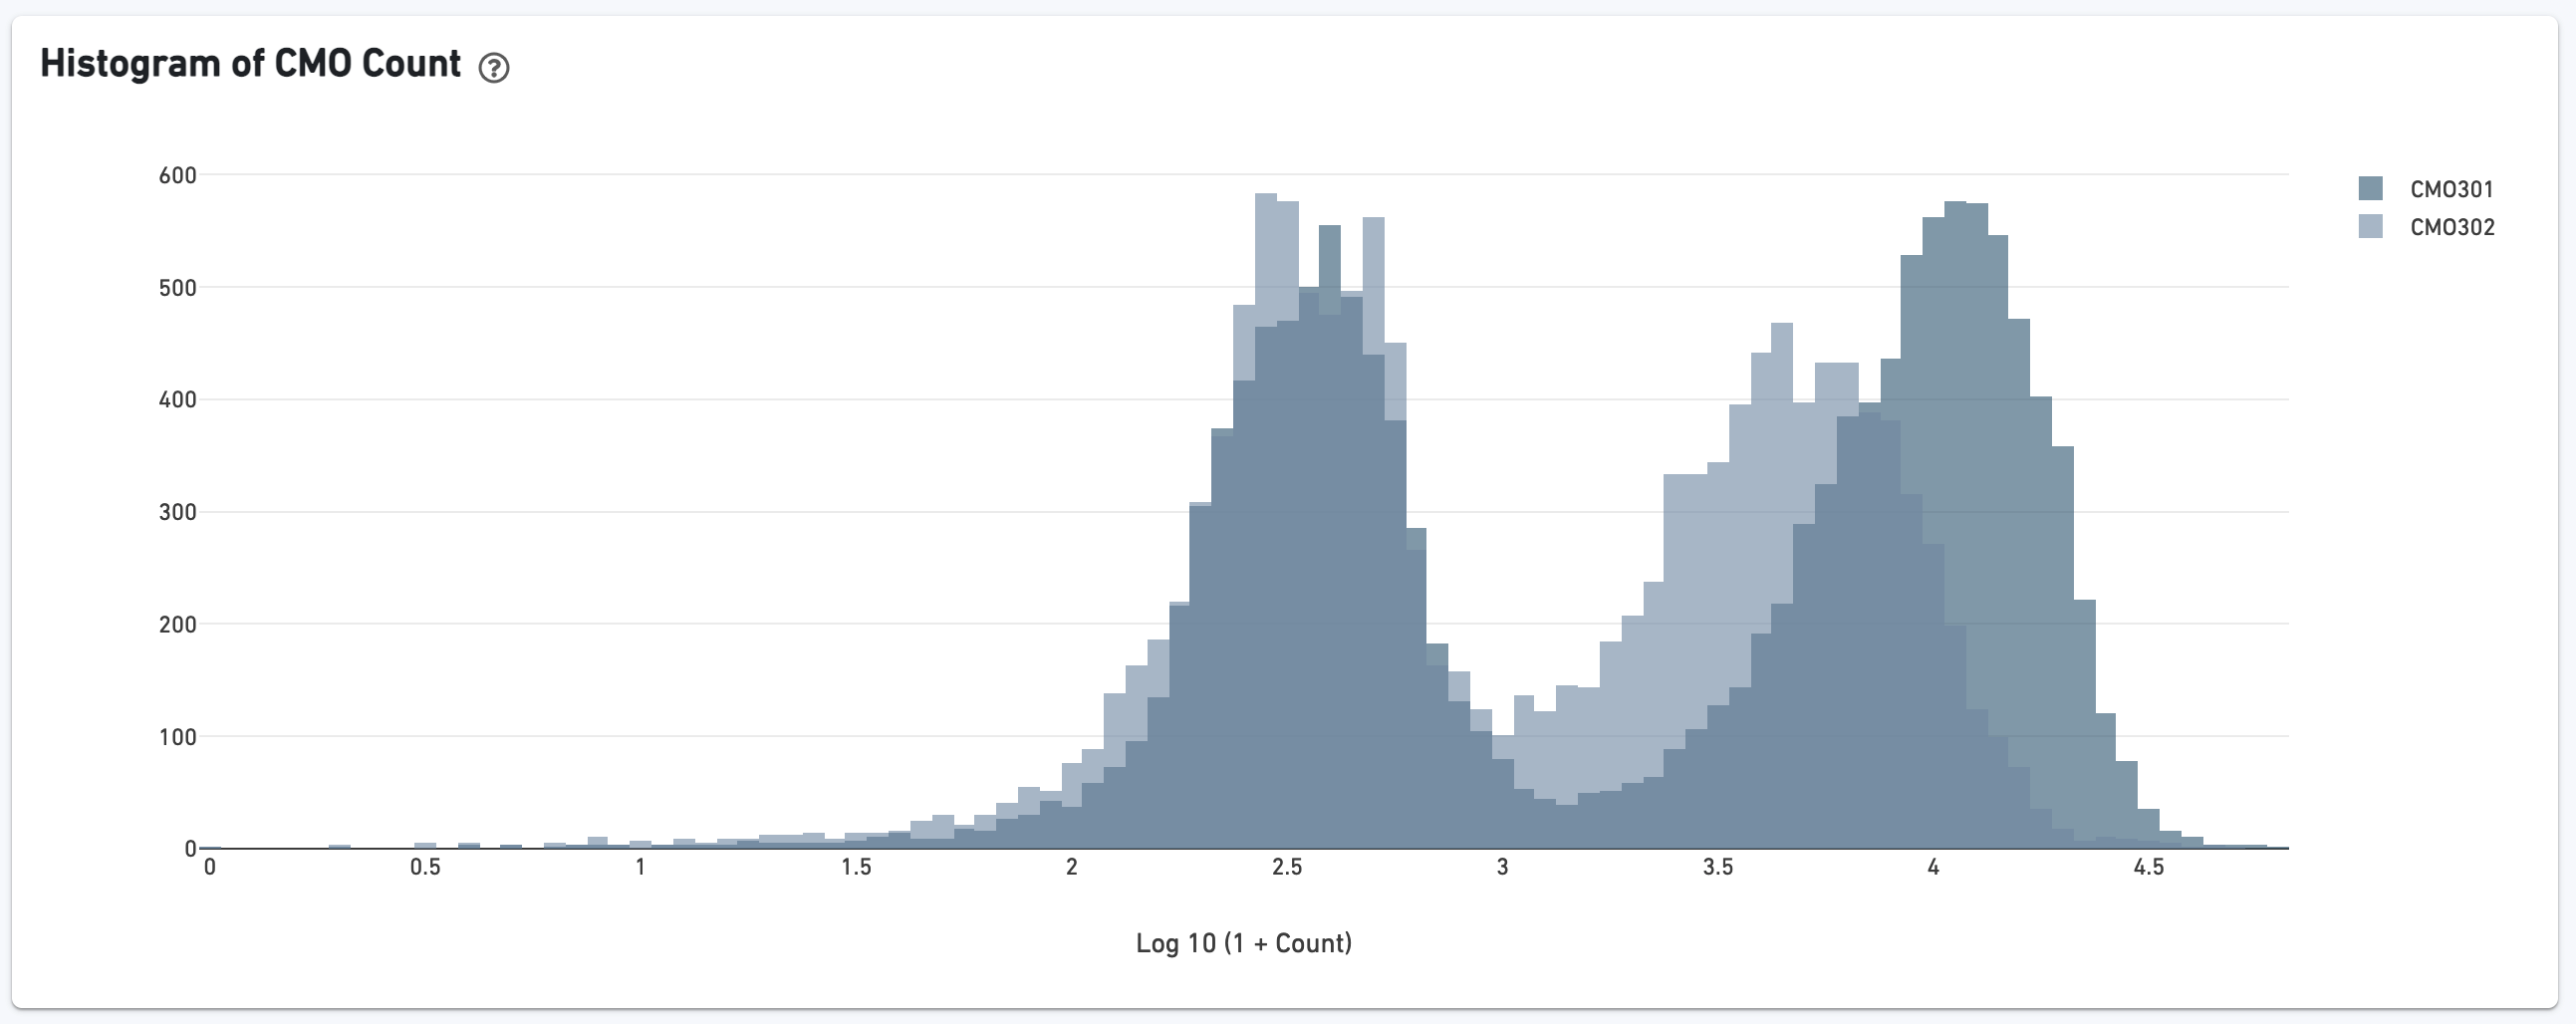
If the experiment went well, the histogram should show a bimodal distribution for each CMO, illustrated below for CMO301 and CMO302. The left peak should be background noise, while the right peak is signal. The CMO signal-to-noise ratio is calculated from this histogram.
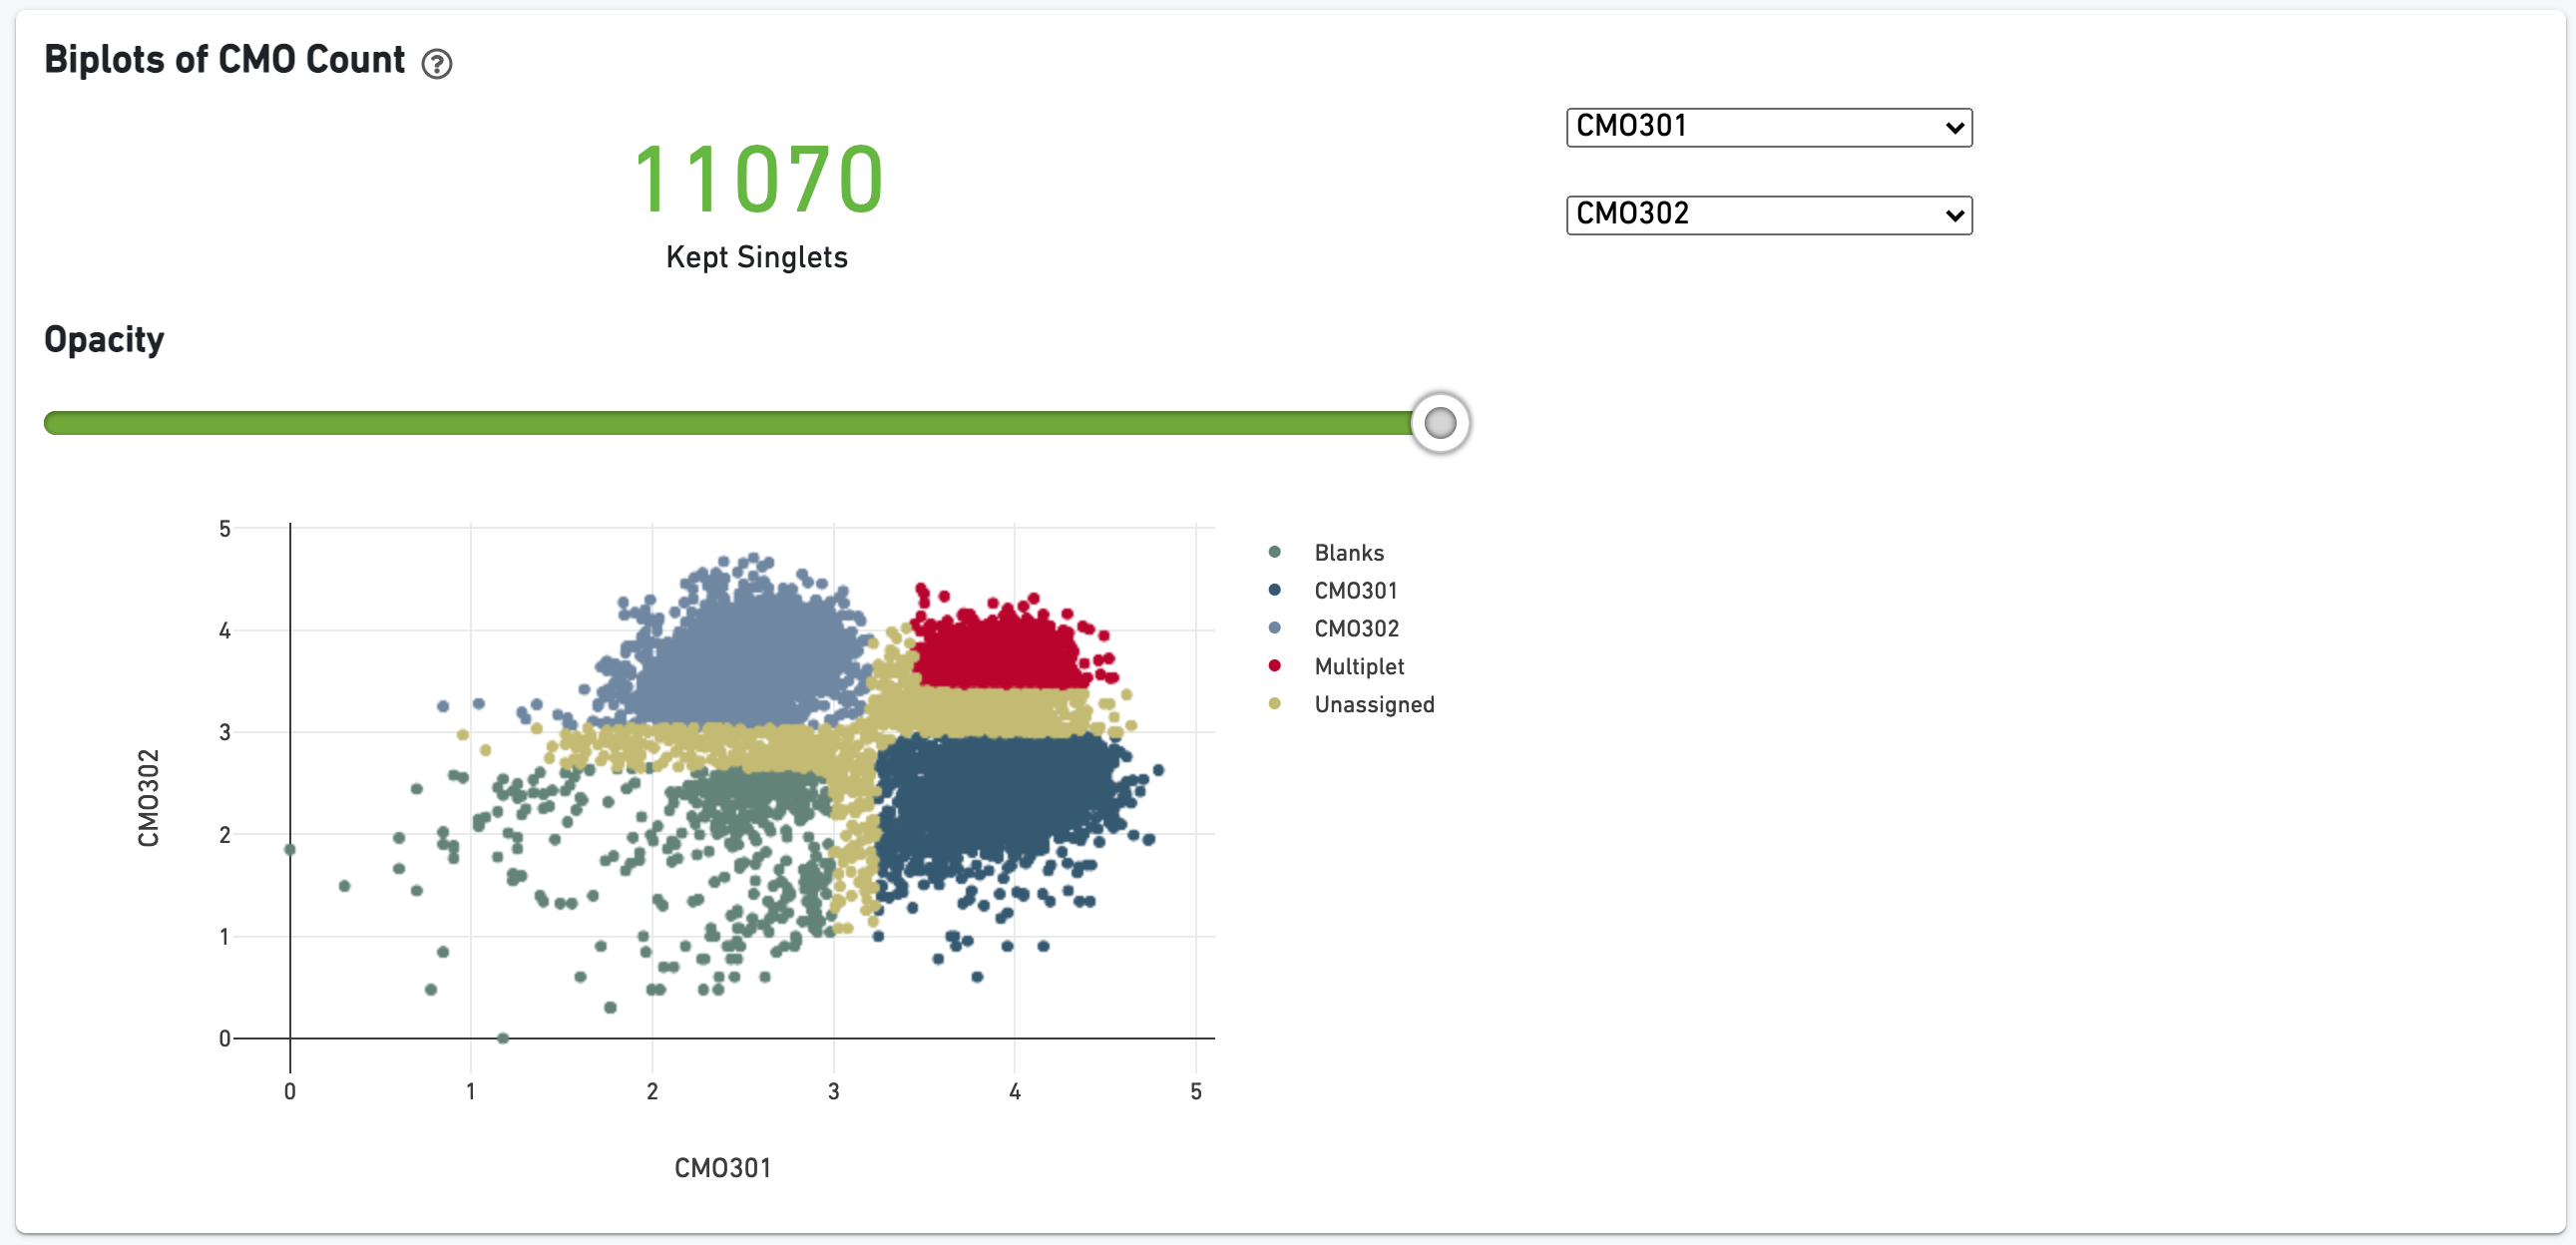
The biplot shows the CMO UMI counts for different cell populations: singlets, multiplets, blanks (not assigned any CMO), or unassigned, which are cells that were not confidently assigned to any of those states. The opacity slider allows the user to minimize over-plotting.
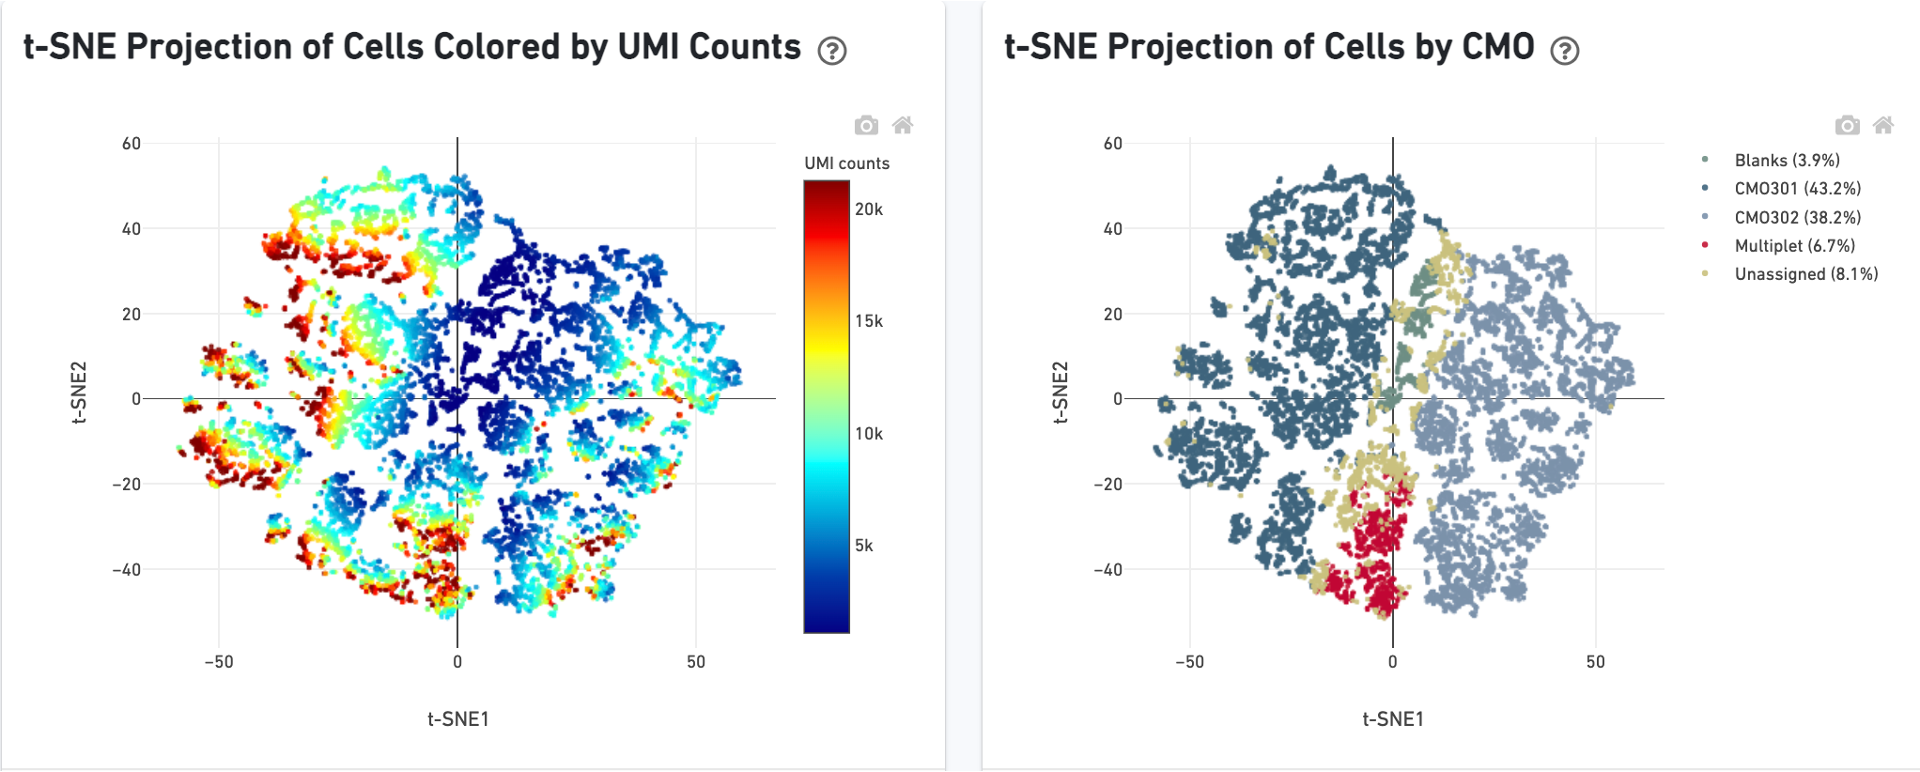
There is a t-SNE projection of just CMO counts, first colored by CMO UMI counts and then by CMO tag assignment. Ideally, there should be clear separation between CMO tags.
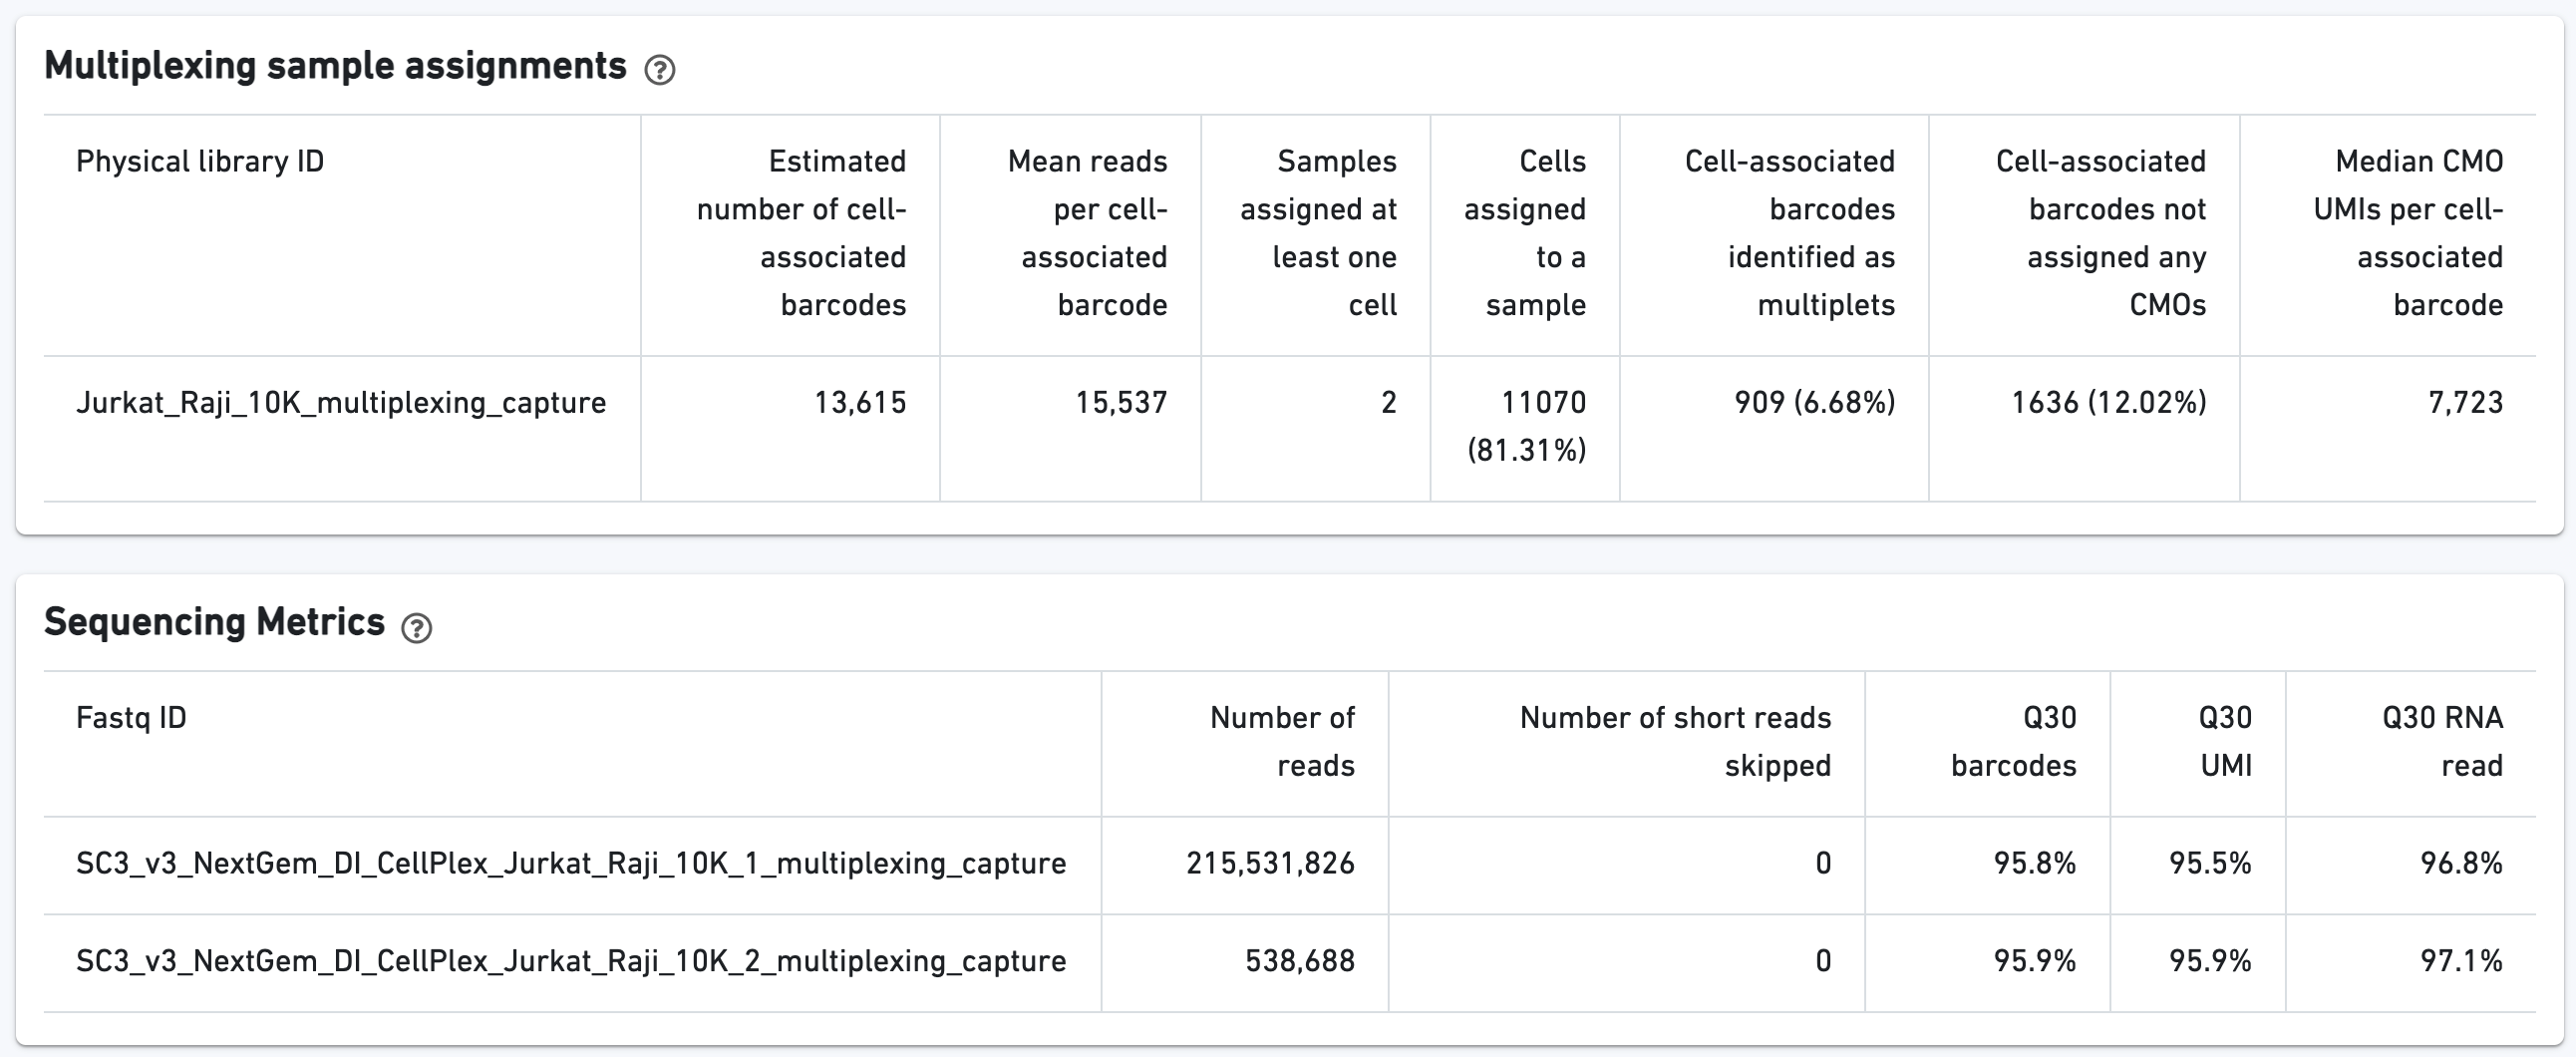
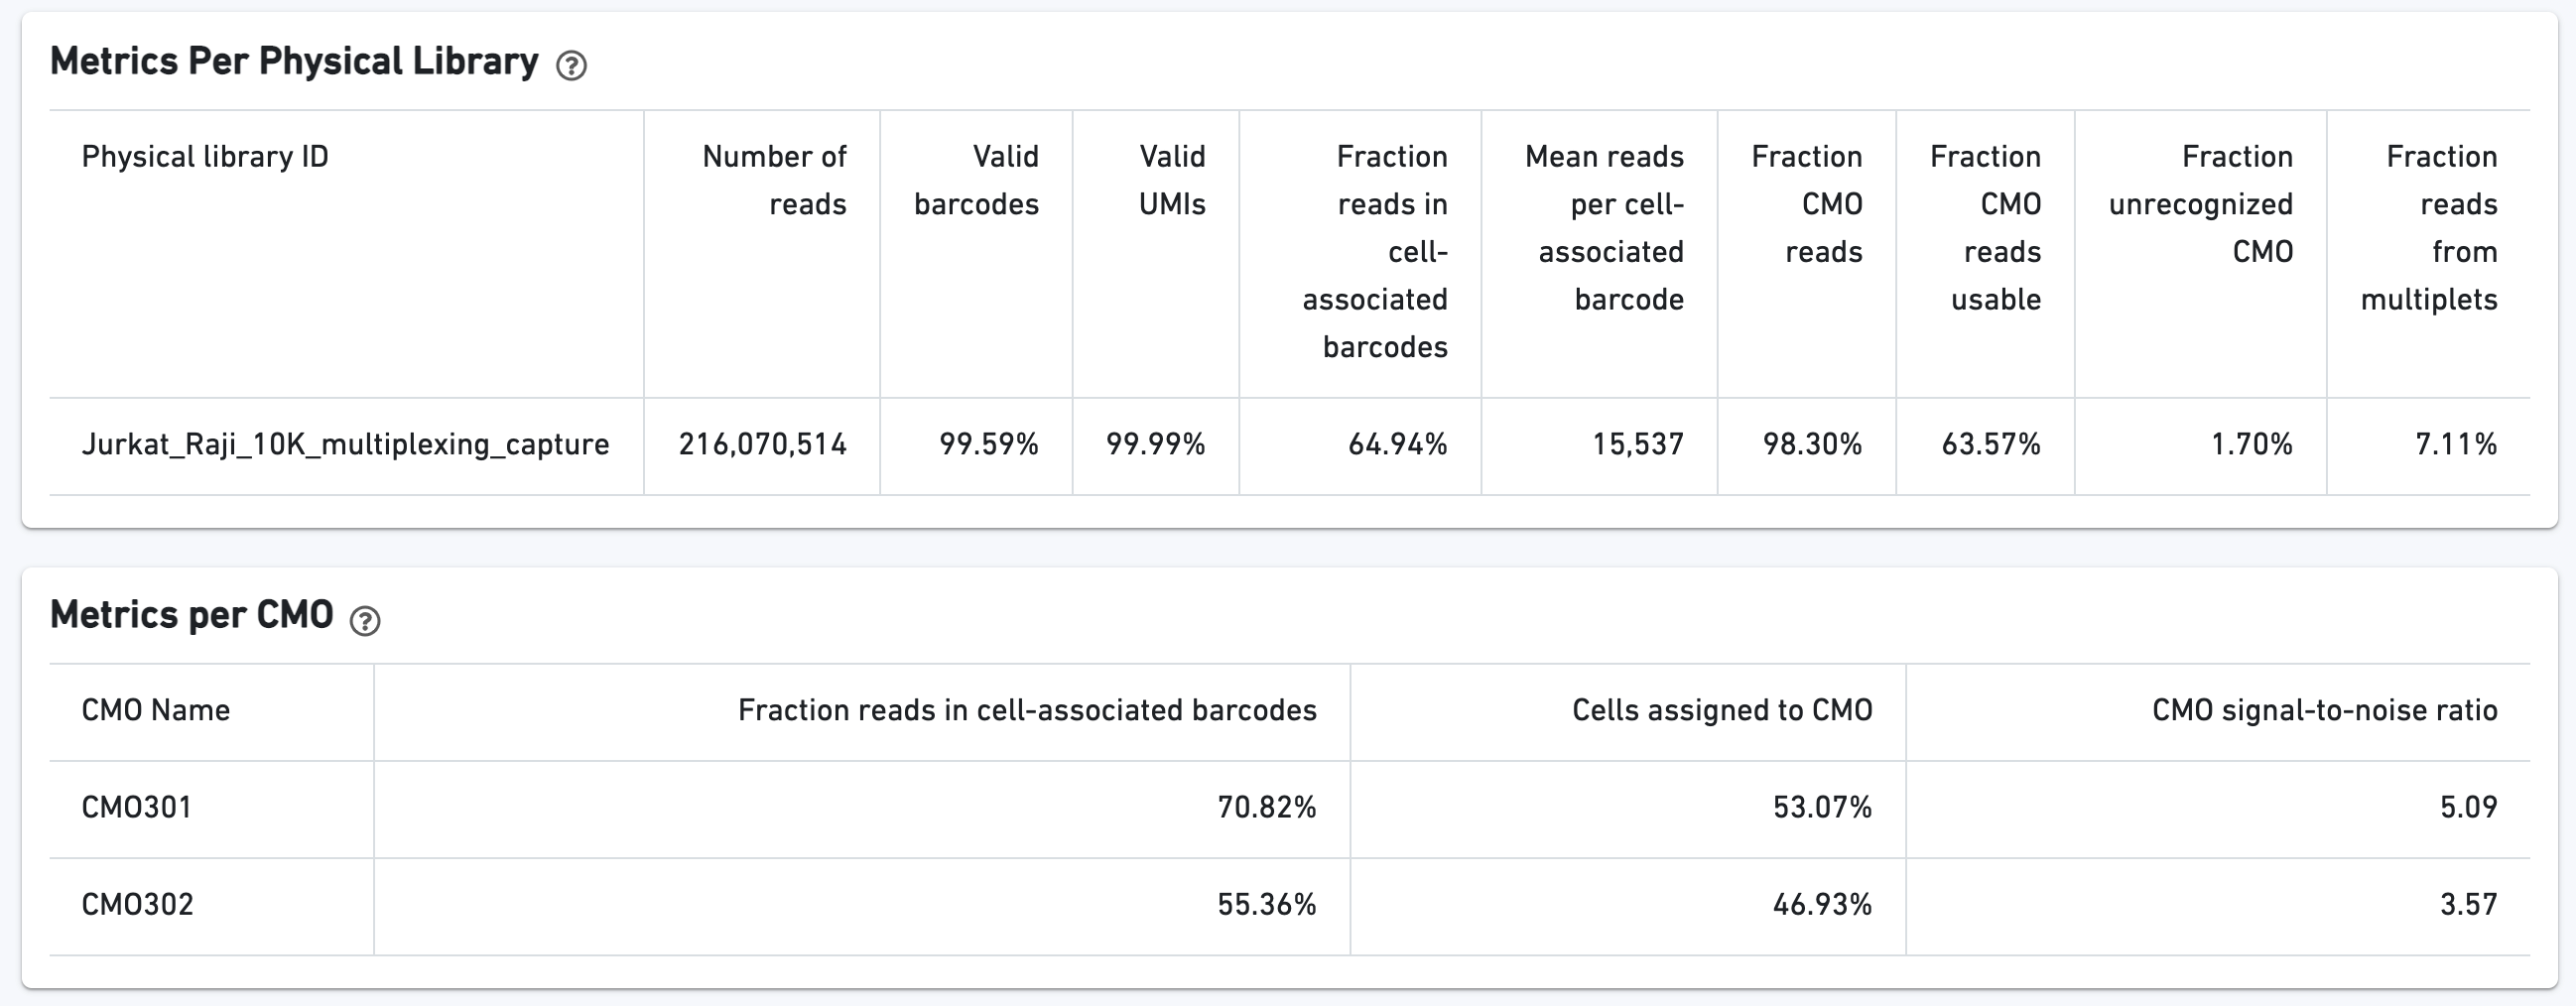
Additional tables are provided to show Multiplexing sample assignments, Sequencing Metrics, Metrics Per Physical Library, and Metrics per CMO:
The CMO Barcode Rank Plot is useful for assessing the quality of the CMO library. A steep drop-off between cells and background is expected for high quality libraries:
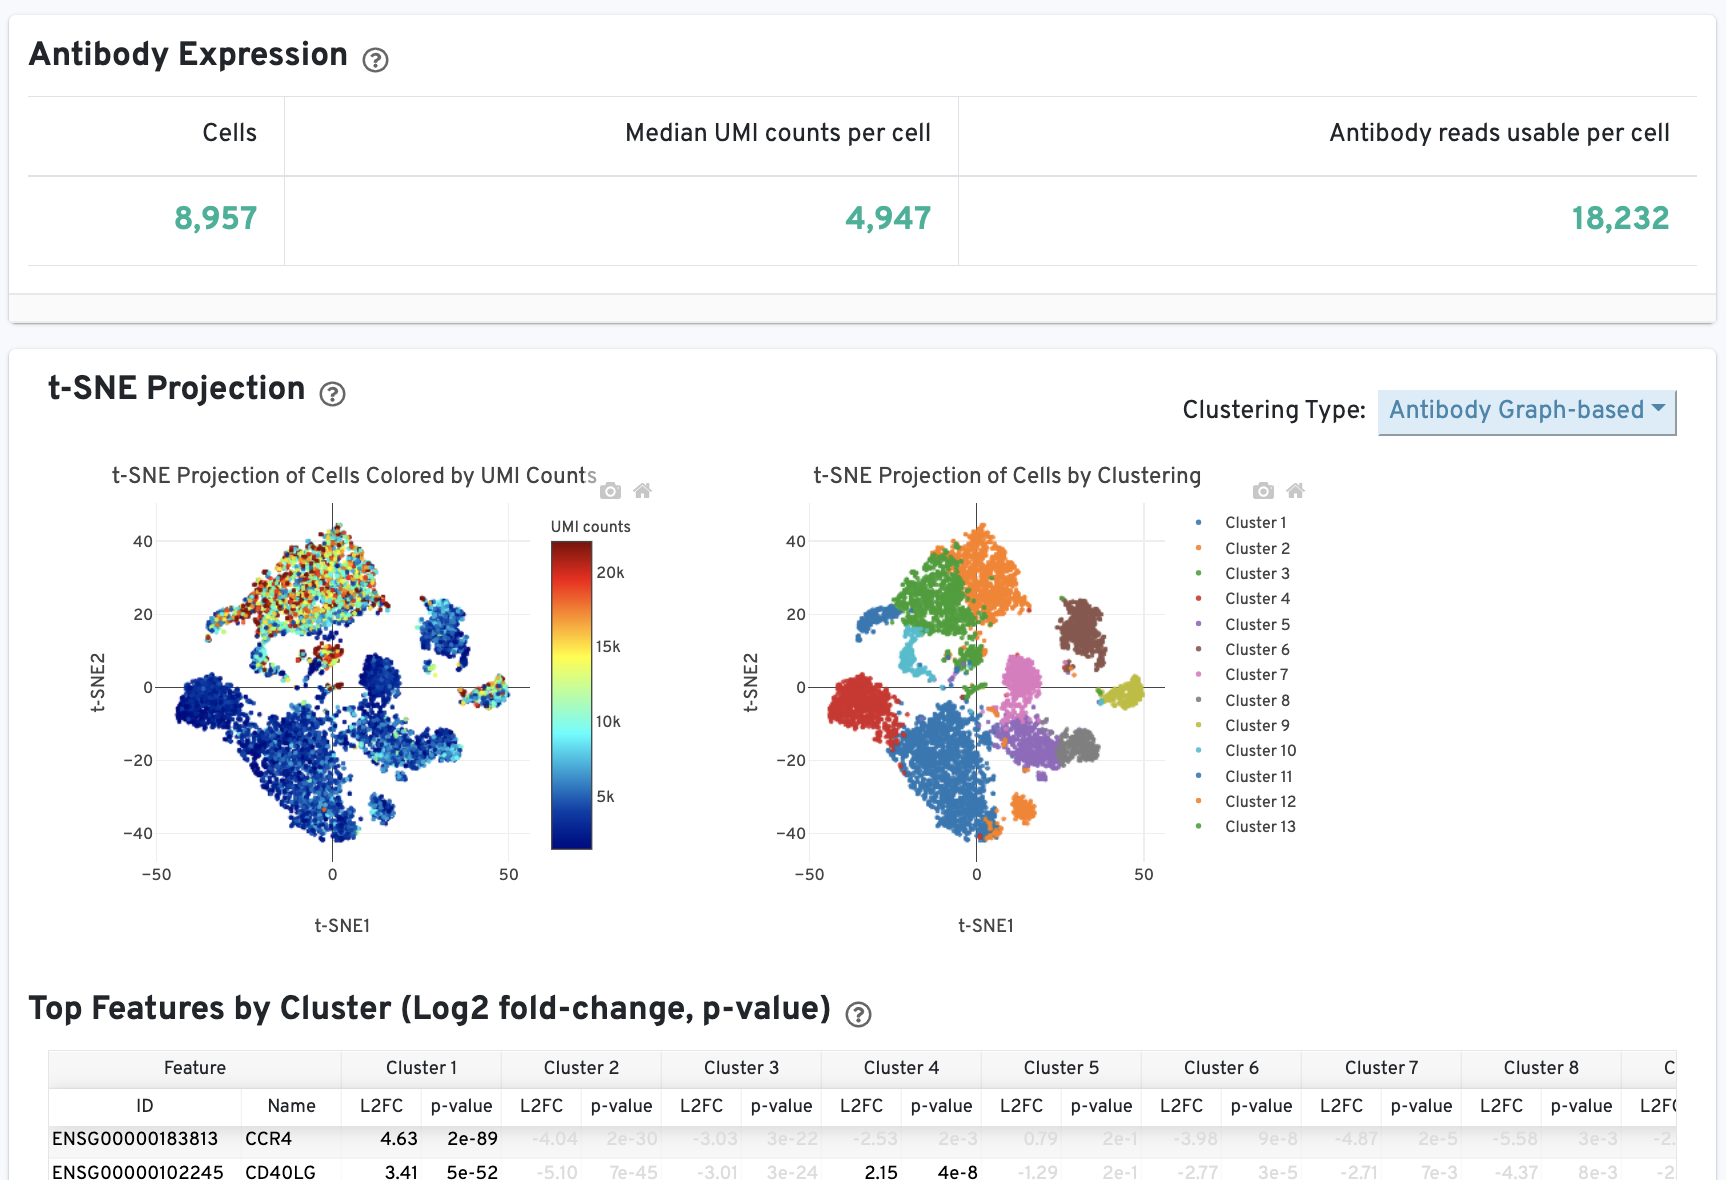
The Cells and Library views will each have an additional Antibody tab for Antibody Capture results. Click the question mark ? to read full descriptions for each one. Here is an example for singleplex Fixed RNA Profiling with Antibody Capture (an example dataset is available for 10k human PBMCs stained with TotalSeq™-B human universal cocktail):
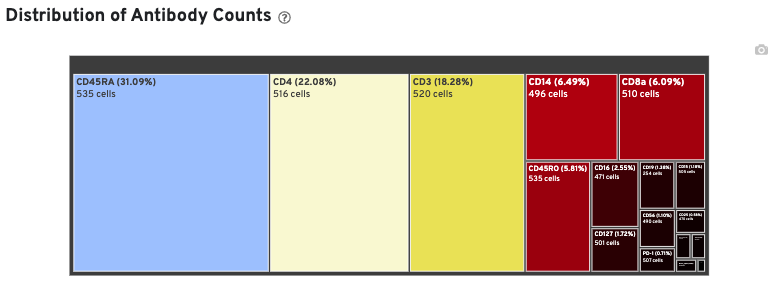
On Cells view:
In Cell Ranger v7.1 and later, the Antibody tab includes a Distribution of Antibody Counts plot. This plot shows the relative composition of antibody counts for antibodies with at least one UMI. The box size is proportional to the fraction of total UMIs from cell barcodes derived from that antibody. Hovering over a box provides more information about the metrics displayed. In this example, the first blue box shows that at least one CD45RA antibody UMI was detected in 535 cells:
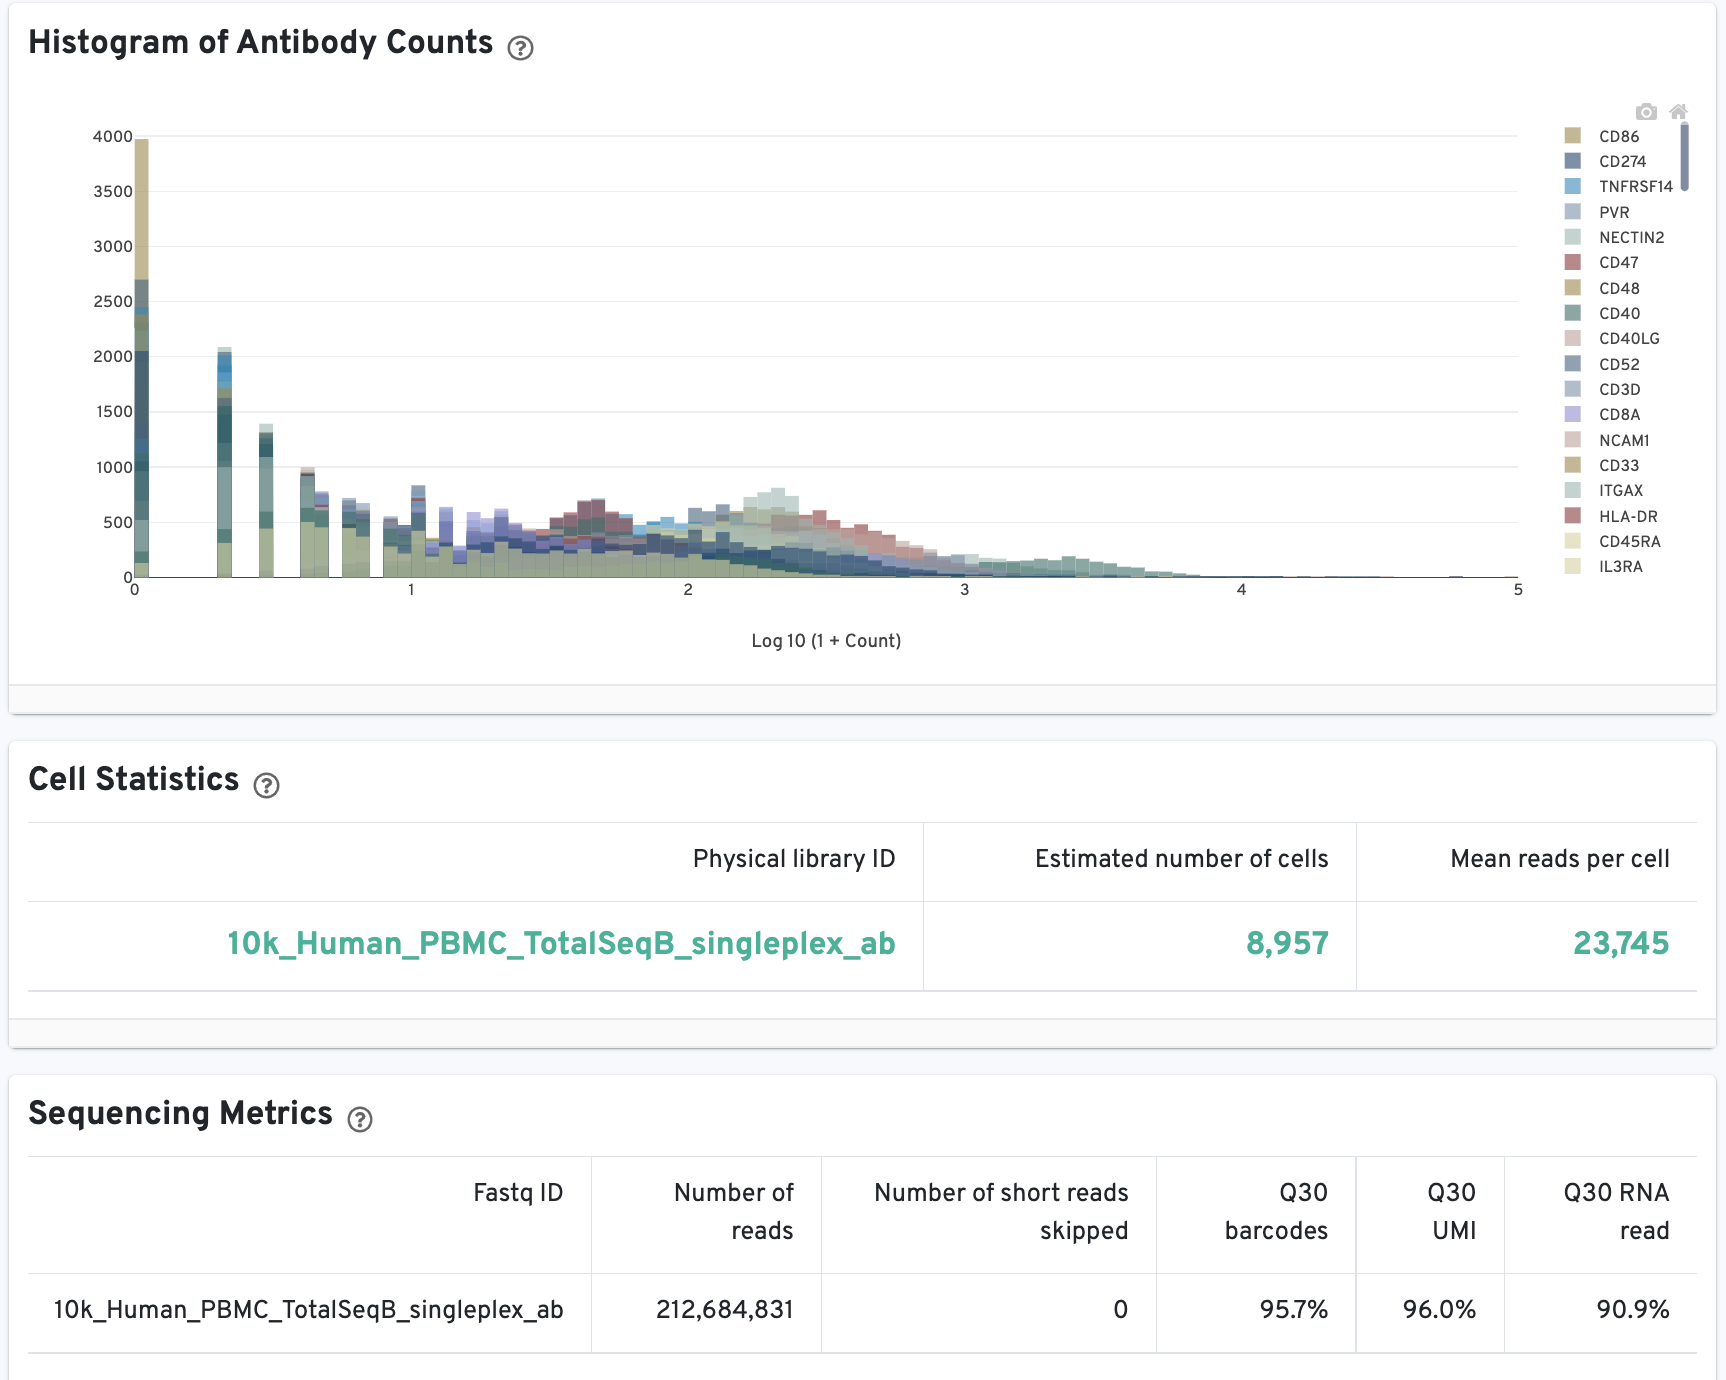
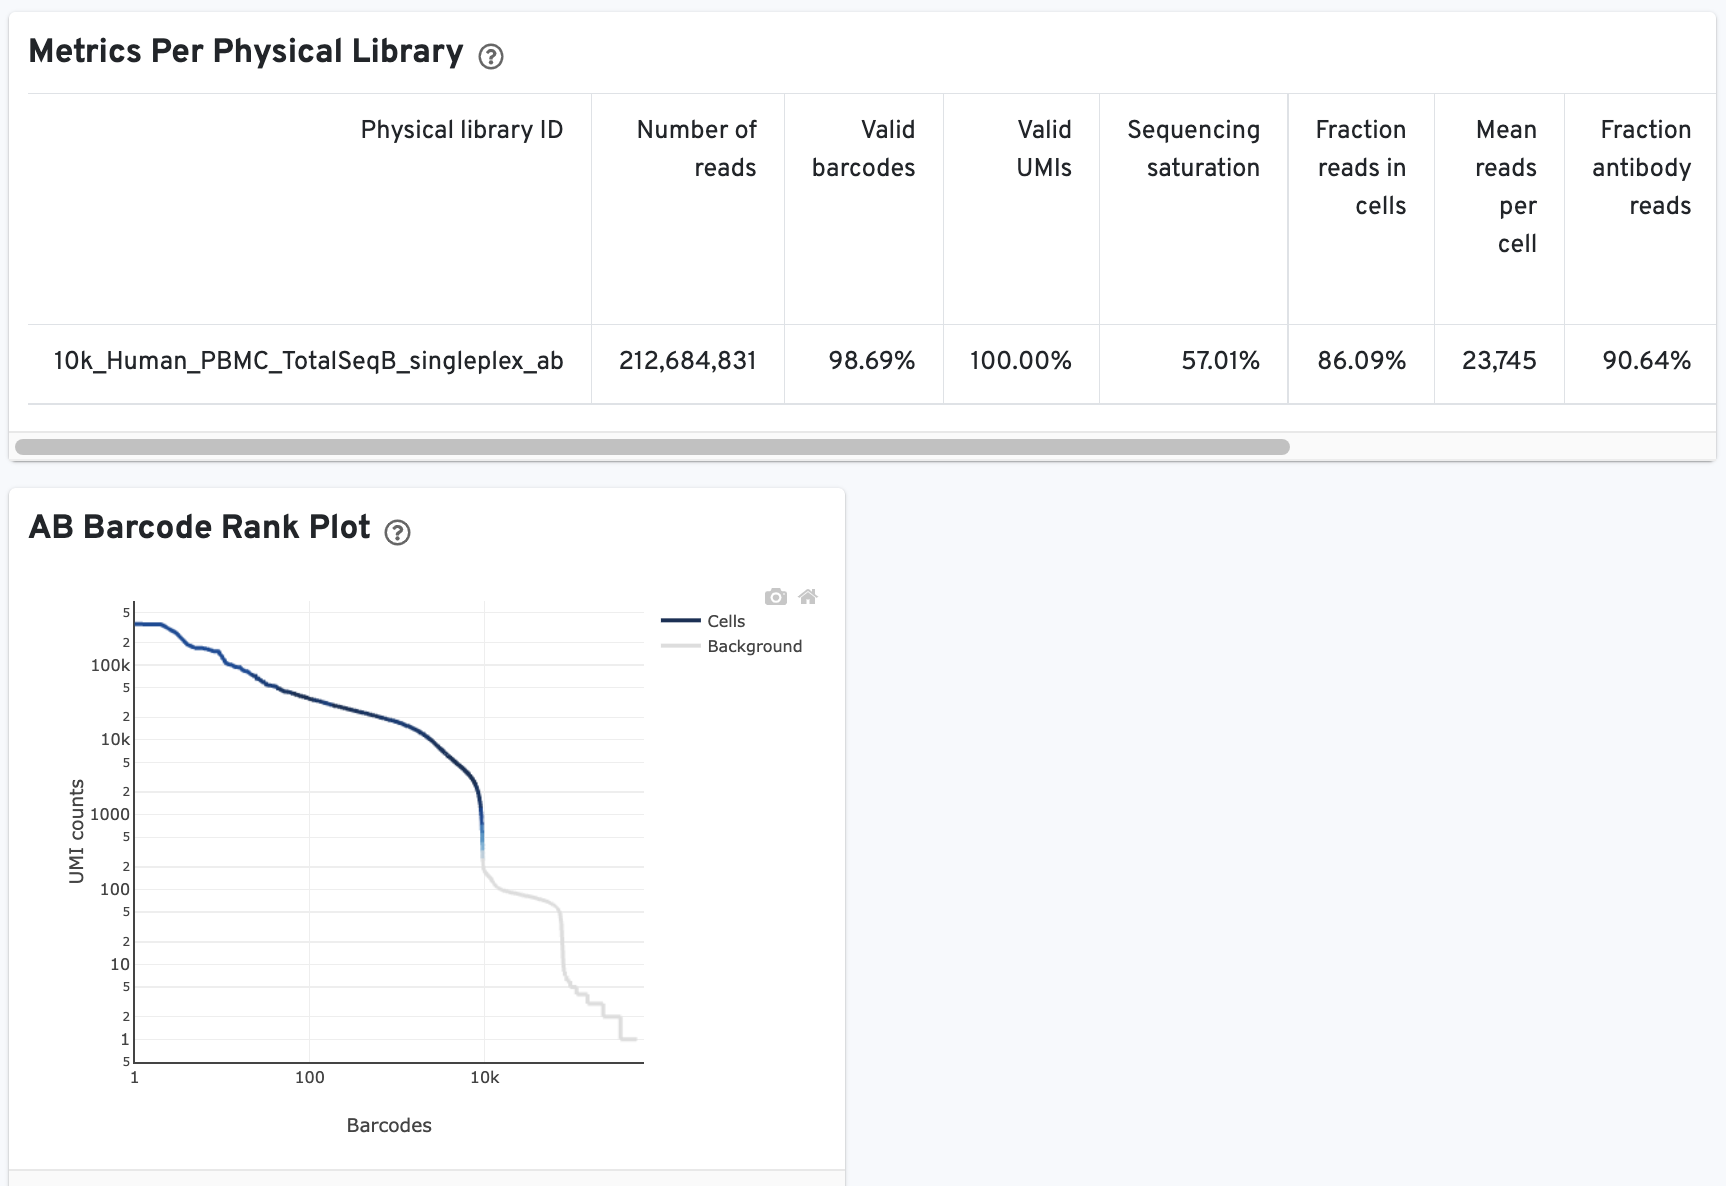
On Library view:
The Histogram of Antibody Counts can help to explore gene expression levels of the top 120 antibody marker genes across the library's population of cells. The x-axis shows UMI counts in the log10 scale (1=10 UMIs, 2=100 UMIs, etc.) and the y-axis shows the number of cells. To view this histogram for a specific subset of antibodies, select (or deselect) antibodies for display by clicking on the legend labels.
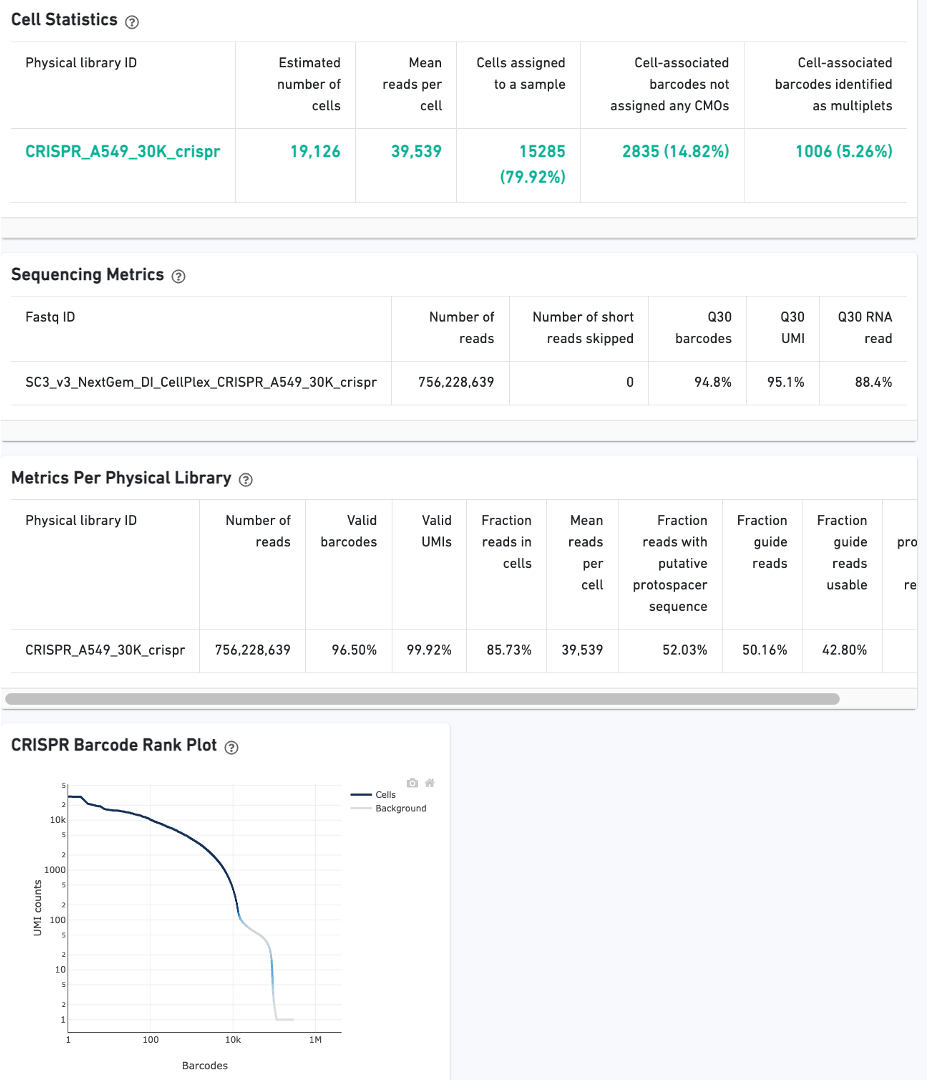
CRISPR Guide Capture experiments have an additional CRISPR tab in the Sample and Library views. Click the question mark ? to read full descriptions for each one. Here is a public dataset example for a 3' Cell Multiplexing with CRISPR Guide Capture experiment:
On Cells view:
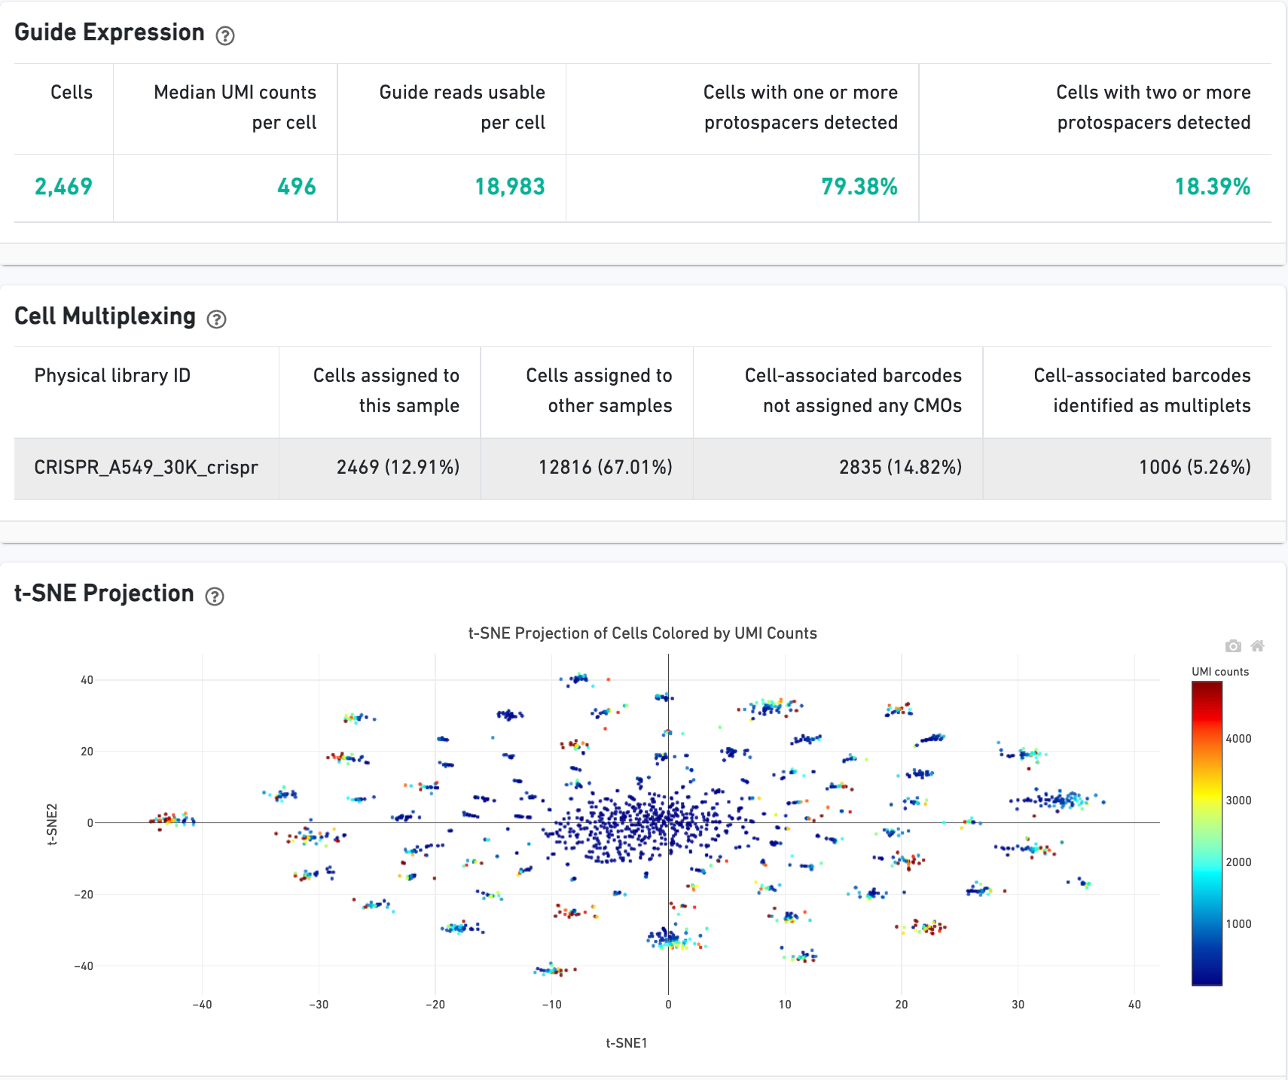
On Library view:
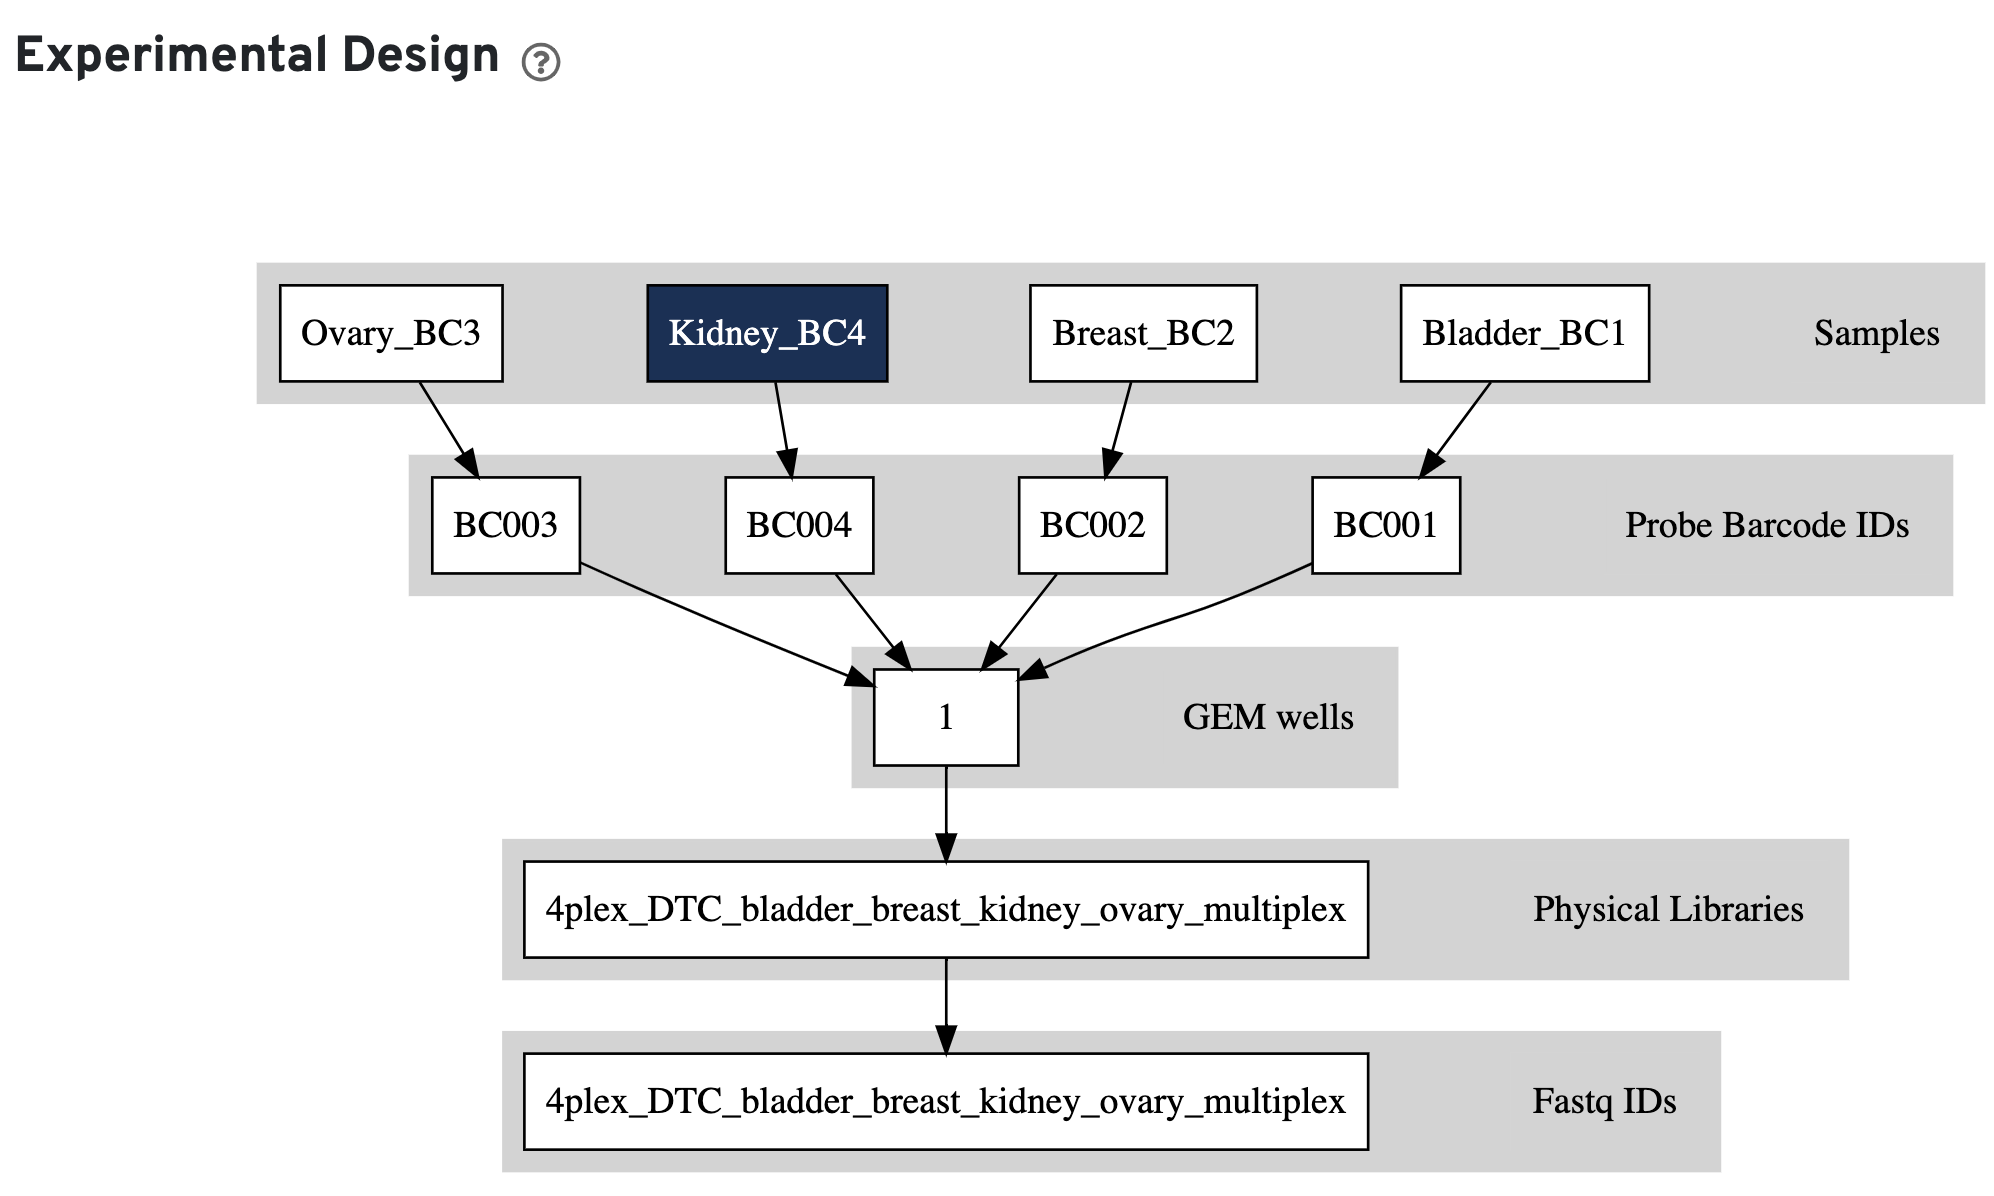
Finally, click the Experimental Design view.
This view enables one to visualize the experimental design for the dataset, as interpreted by Cell Ranger. This is an example for a multiplexed Fixed RNA Profiling experiment:
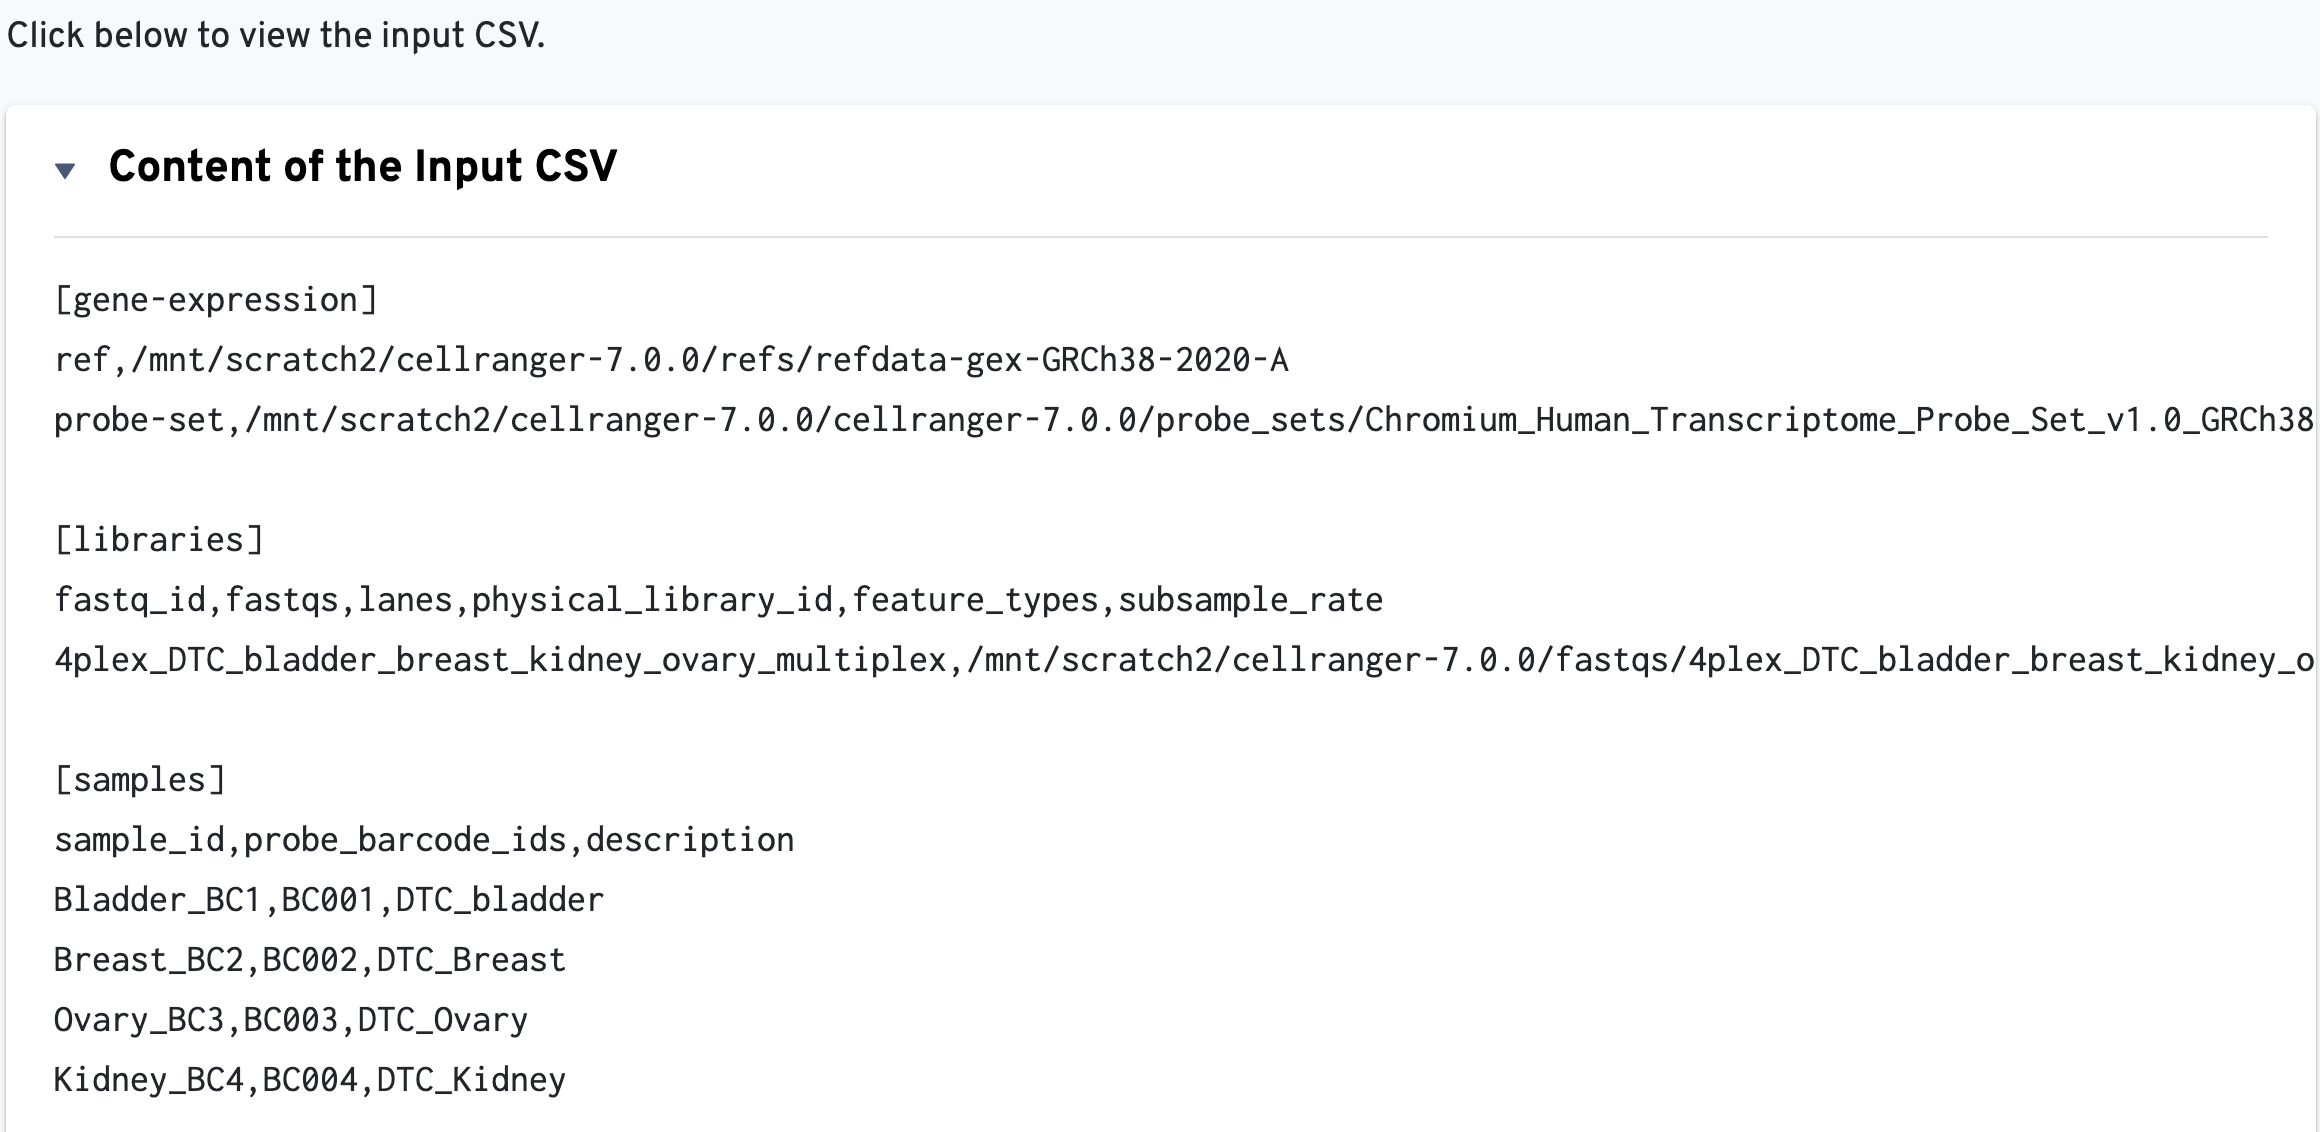
The input multi config CSV file is also displayed to help with troubleshooting:
Do you have questions or feedback about this documentation? Please contact support@10xgenomics.com.