Cell Ranger7.1, printed on 04/15/2025
Cell Ranger 7.0 introduces support for Fixed RNA Profiling (FRP) with the cellranger multi pipeline. While some steps are similar to the existing algorithm for Gene Expression, there are a few differences illustrated and described below for singleplex and multiplex Fixed RNA Profiling experiments.
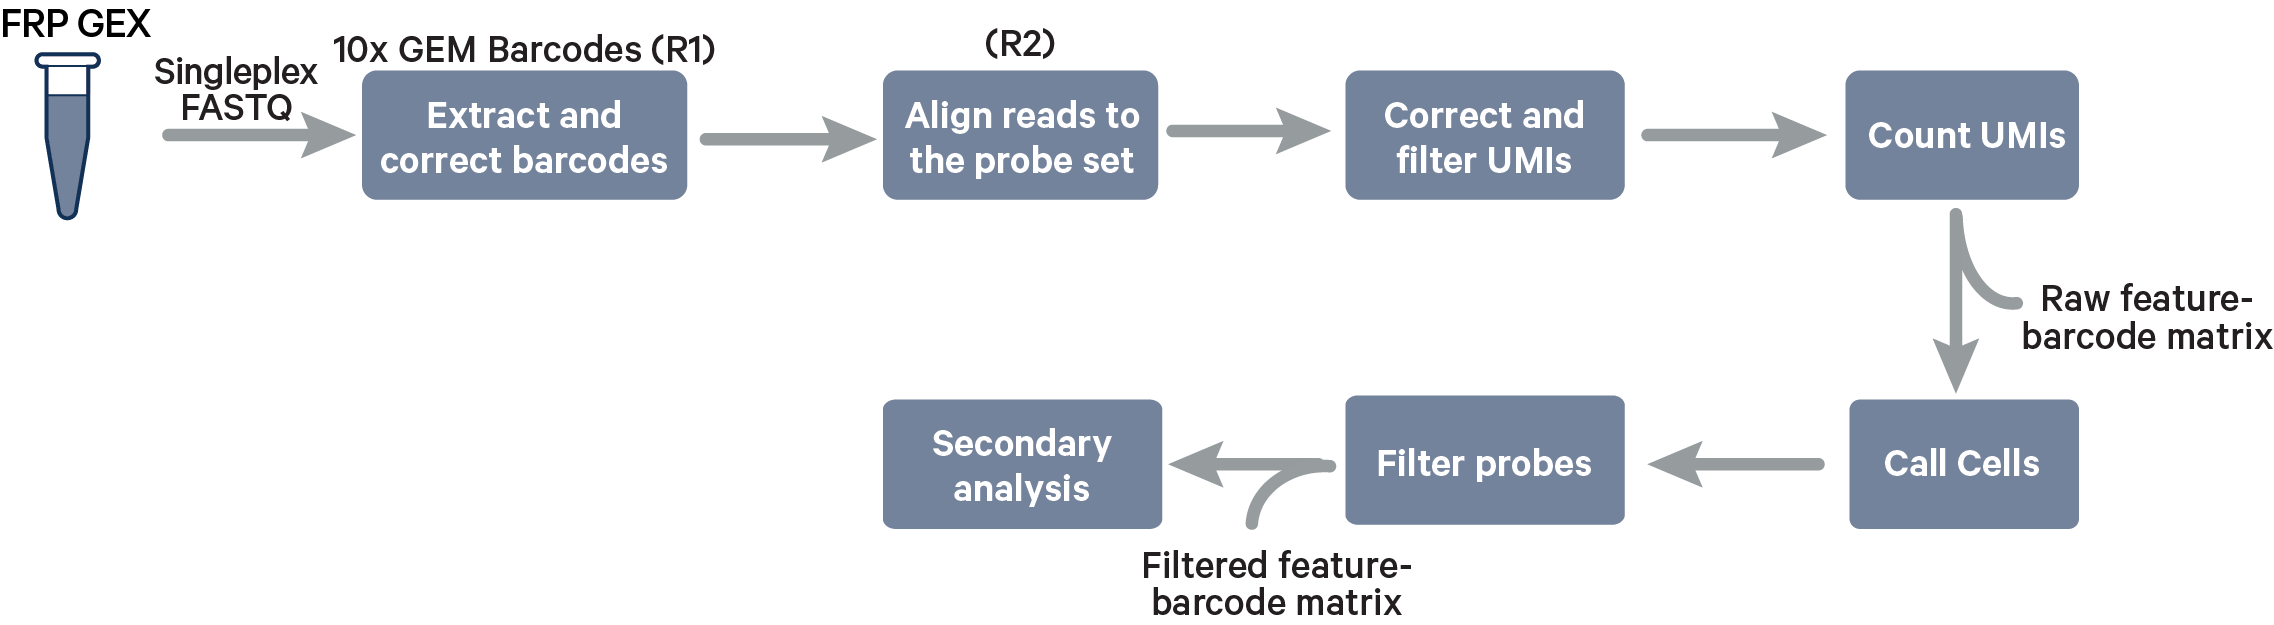
Singleplex Fixed RNA Profiling steps:
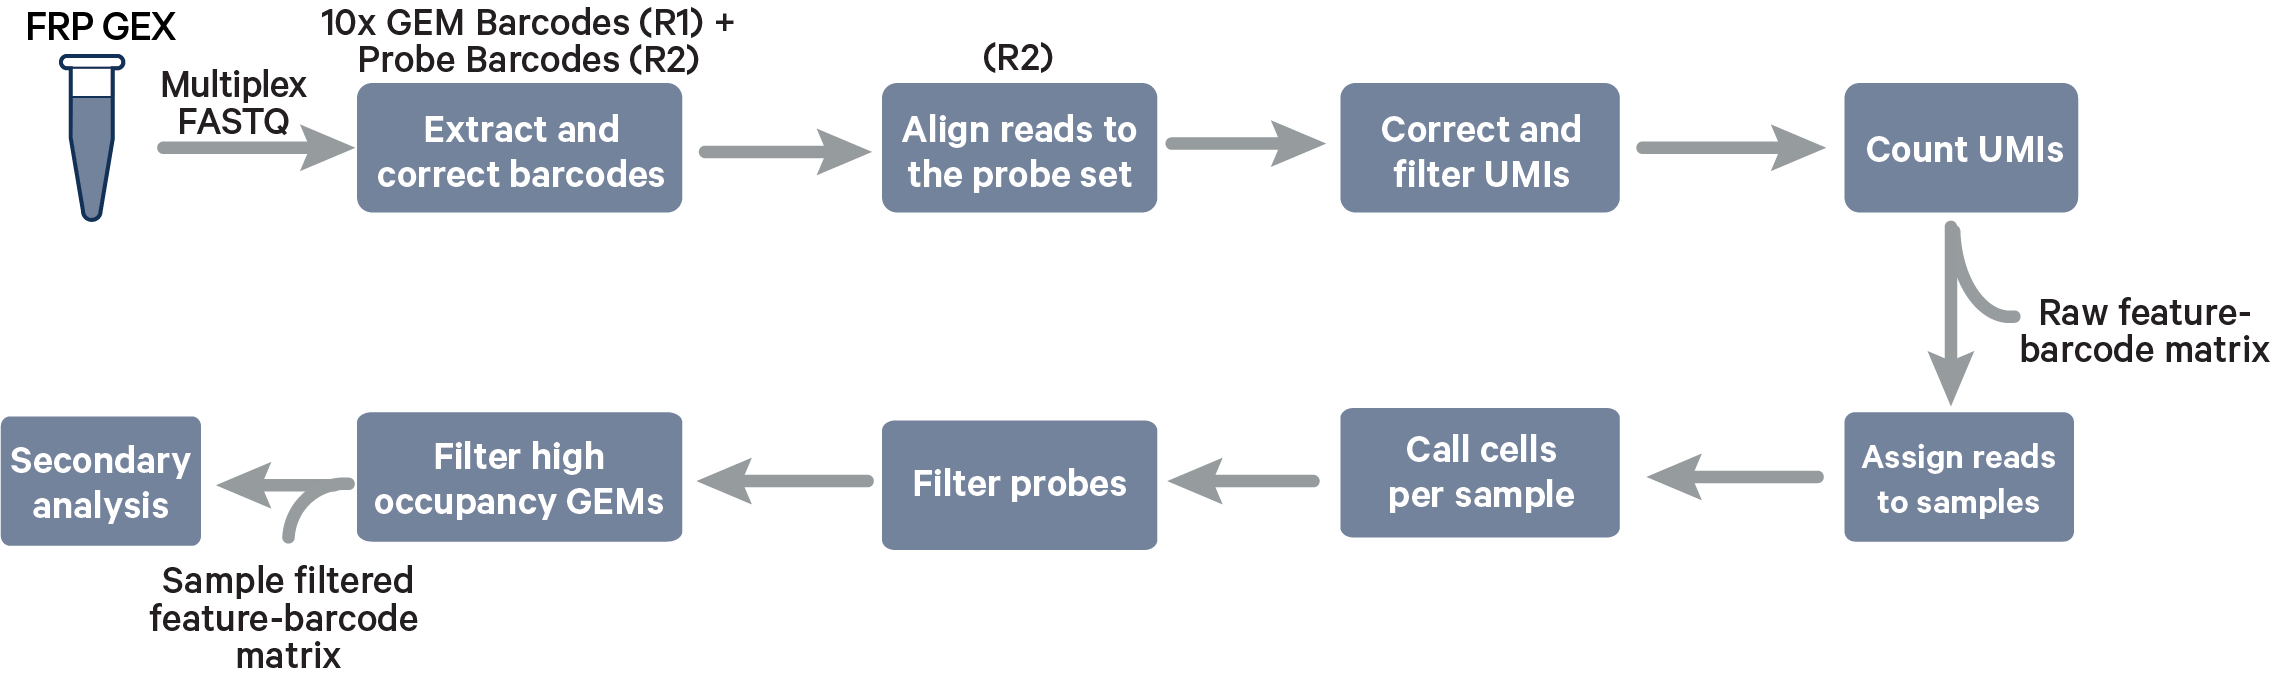
Multiplex Fixed RNA Profiling steps:
The cell barcode will be composed only of the 10x GEM Barcode and all reads with valid barcodes are considered to be part of the sample. This configuration does not use a [samples] section in the multi config file.
The cell barcode will be composed of both the 10x GEM Barcode and the Probe Barcode. Reads must have valid 10x GEM and Probe Barcodes in order to be assigned to a sample. The corrected Probe Barcode sequence is mapped to its corresponding Probe Barcode ID. If this ID has been specified within the probe_barcode_ids column of the [samples] section, the read is assigned to the sample paired with this Probe Barcode ID.
Note that each Probe Barcode ID (e.g., BC001) is actually a mix of four distinct barcode sequences, which ensures balanced base composition during sequencing. Raw Probe Barcode sequences are first corrected independently of the corresponding 10x GEM Barcode using the full list of all Probe Barcode sequences from probe construction. These corrected sequences are then collapsed such that the Probe Barcode sequence used within the cell barcode is always lexicographically the first barcode amongst the four barcodes from a given mixture. For example, if the four Probe Barcodes are ACTTTAGG, CGAGGGTA, GACACTAC, and TTGCACCT, all instances of these Probe Barcodes will be converted to ACTTTAGG for use within the Cell Ranger pipeline and outputs (e.g., feature-barcode matrix). The original sequence will be maintained in uncorrected form within the raw cell barcode tag (CR) included in the BAM file.
Cell Ranger 7.0 introduces support for analyzing fixed RNA using the cellranger multi pipeline. During the fixed RNA workflow, whole transcriptome probe panels, consisting of multiple pairs of probes for each targeted gene, are added to the tissue. These probe pairs hybridize to their target transcript and are then ligated together. To analyze fixed RNA data, the probe-set parameter must be used to specify a probe set reference CSV file. When this parameter is used, Cell Ranger will count ligation events using the probe aligner algorithm (reads are also aligned to the reference transcriptome using STAR, but only to determine their alignment positions and CIGAR strings; STAR alignments are not used to assign reads to genes for fixed RNA data). Distinct ligation events are counted for Fixed RNA Profiling rather than distinct transcripts. Sequencing reads are aligned to the probe set reference and assigned to the genes they target. For genes targeted by more than one probe pair, the UMI counts of all probe pairs targeting that gene are summed up and output as the UMI count for that gene in the feature-barcode matrix (for more information, see this article).
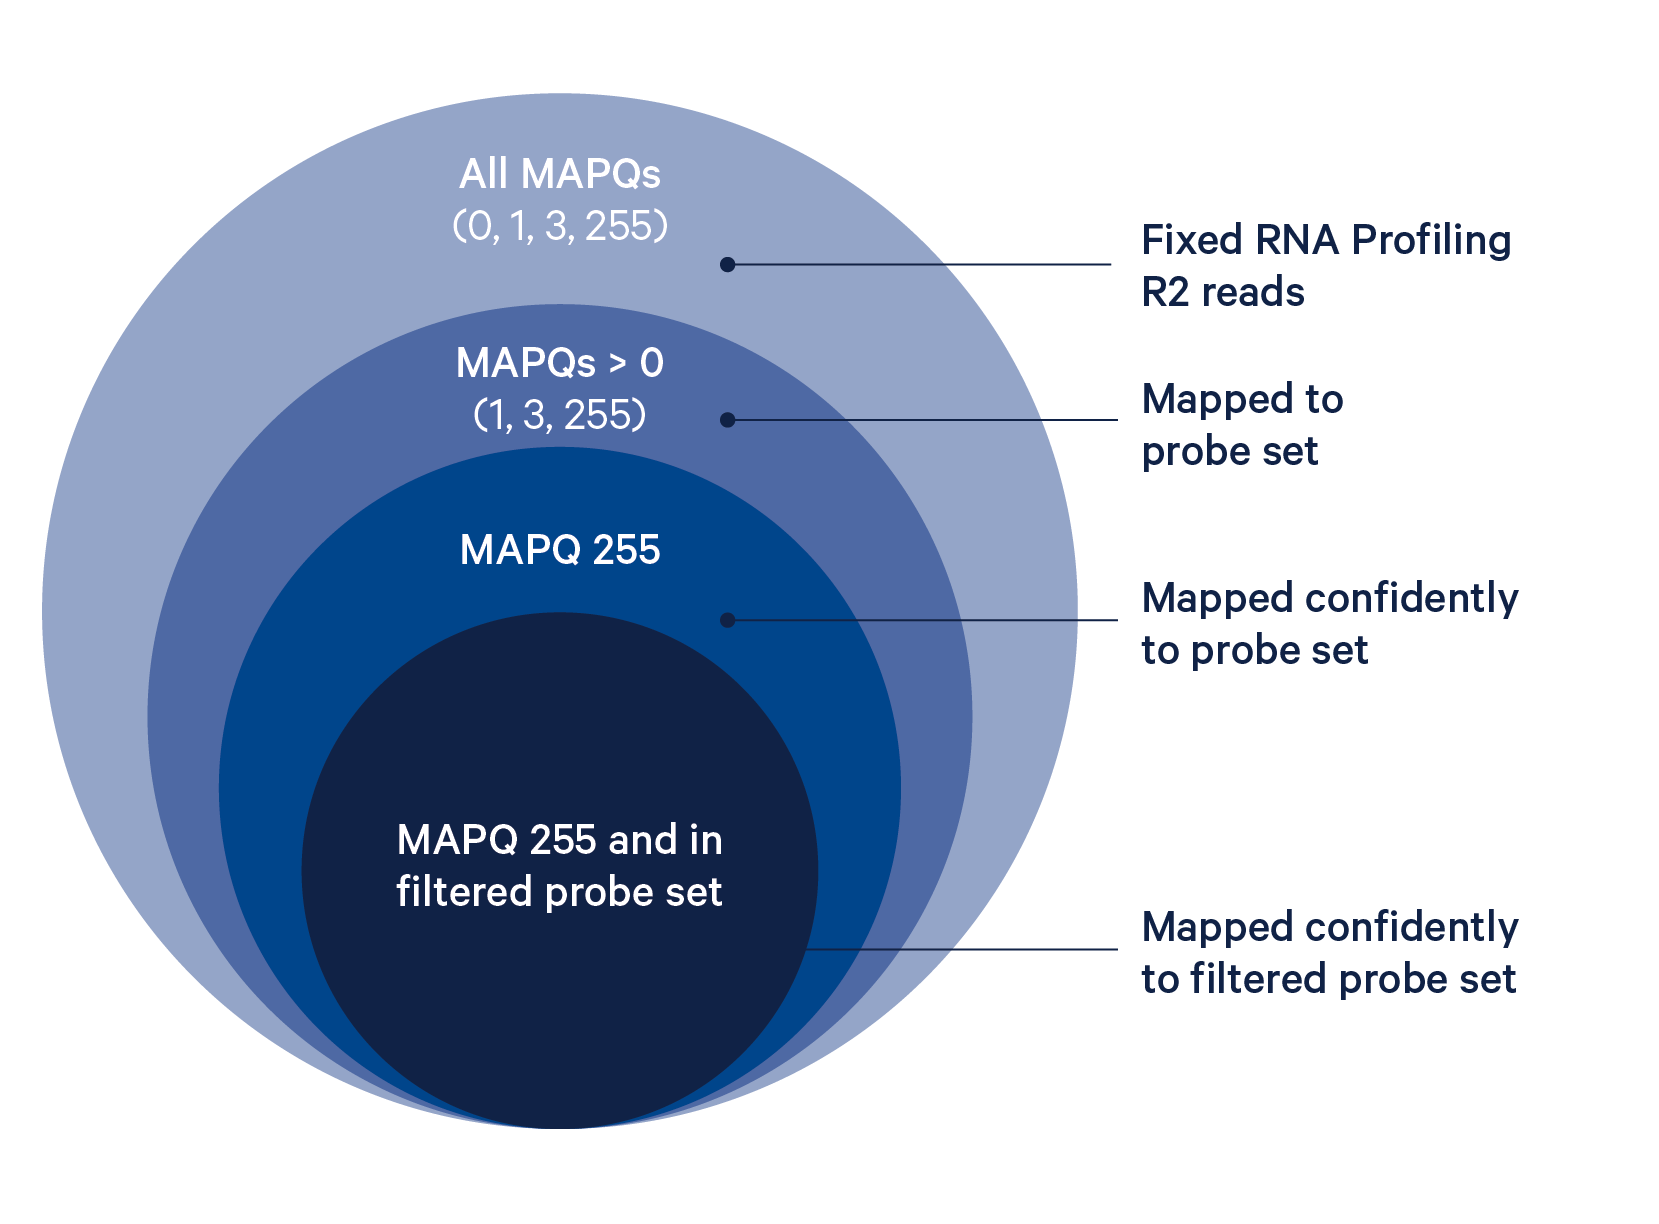
The probe alignment algorithm is similar to a seed-and-extend aligner, where each half of the read is a seed, as described in detail below:
The BAM tag pr:Z reports a semicolon-separated list of probe IDs. See BAM alignment tags for a detailed description.
The cell calling algorithm is the same as described on the Gene Expression algorithm page, but done for each sample individually.
Probes that are predicted to have off-target activity to homologous genes or sequences are excluded from analysis by default (all probes are present in the raw matrix file). These probes are marked with FALSE in the included column of the probe set reference CSV. Any gene that has at least one probe with predicted off-target activity will be excluded from filtered outputs. Setting filter-probes to false in the multi config file for cellranger multi will result in UMI counts from all non-deprecated probes, including those with predicted off-target activity, to be used in the analysis. Probes whose ID is prefixed with DEPRECATED are always excluded from the analysis. Please see the Probe Set Overview for details on the probes.
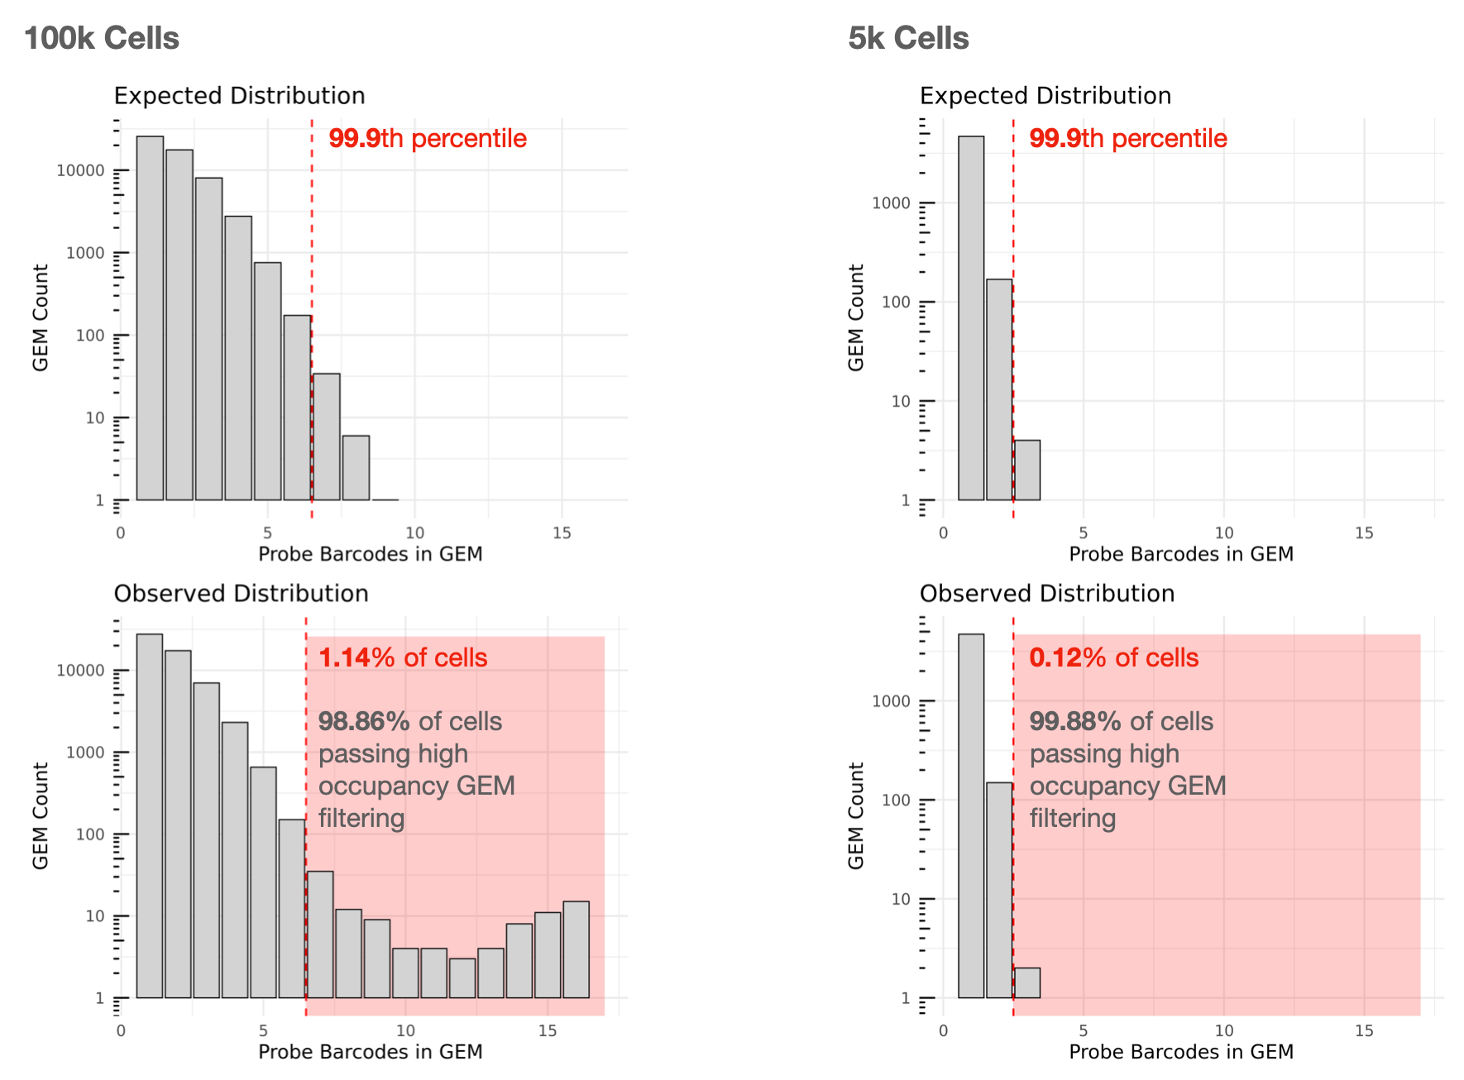
Cell calling is performed and we utilize the 10x GEM and Probe Barcodes to estimate the mean of the Poisson distribution that should describe the number of Probe Barcodes observed per GEM under optimal chip loading. Note that the mean of this distribution will increase roughly linearly with cell load. Using the expected distribution, we estimate the 99.9th percentile for the number of Probe Barcodes observed per GEM, and remove all cells belonging to GEMs that fall beyond this threshold in the observed distribution to mitigate higher than expected barcode collision rates.
High amounts of filtering due to high occupancy GEMs may reflect partial clogs/wetting failures or significant deviations from the recommended chip loading protocol. In an optimal experiment, the percentage of cells passing high occupancy GEM filtering that can be used for analysis is usually more than 90%.
The lefthand plot below shows an example of a multiplex Fixed RNA Profiling experiment with 16 Probe Barcodes aiming to capture 100,000 cells. Cells contained in GEMs falling in the red zone in the observed distribution will be removed from Cell Ranger's filtered outputs (1.14% removed, 98.86% used). Note that the Y-axes of the histograms are log10 scaled.
For comparison, the righthand plot illustrates an experiment with a lower targeted cell number (5,000 cells) with 16 Probe Barcodes, for which 0.12% of cells are removed and 99.88% can be used.
The secondary analyses are described on the Gene Expression algorithm page.
In Fixed RNA Profiling, as long as the standard workflow is followed, probe accessibility to genomic DNA (gDNA) should be limited. The expectation is that gDNA should have a negligible (<1%) contribution to sequenced ligation events.
The two exceptions are:
Cell Ranger uses a subset of transcript probes that have a mix of exon-junction-spanning (spliced) and non-exon-junction-spanning (unspliced) probes for the same gene to estimate gDNA content. Counts from probes that do not span an exon-exon junction include some background signal, as these probes can hybridize to gDNA. Probes that do span an exon-exon junction will specifically detect spliced transcripts with no or minimal signal due to gDNA background. This method estimates the proportion of UMIs that are derived from background ligation events.
The relationship between the counts from exon-exon-junction-spanning and non-exon-junction-spanning probes can be visualized in a scatter plot as shown below.
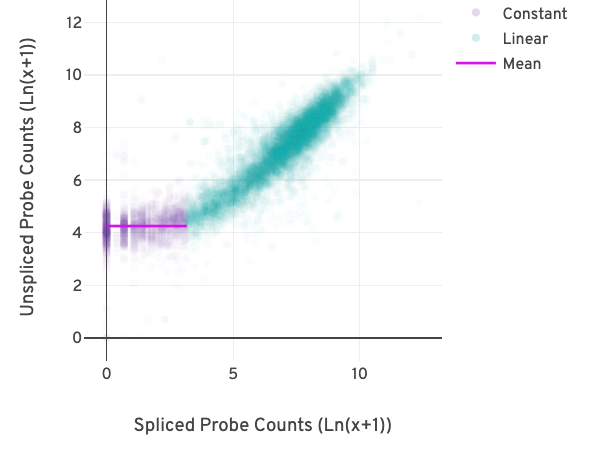
Each point in the plot reflects the relationship between two pseudo-bulk counts for a gene. The x-axis represents the sum of the junction-spanning probe counts across barcodes per gene. The y-axis represents the sum of the non-junction-spanning probe counts across barcodes for the same gene.
The difference in the counts due to background becomes apparent at low probe counts. The relationship between the pseudo-bulk counts switches from being linearly correlated (turquoise) to non-correlated (purple) in the figure above.
A segmented linear model is used to estimate where the unspliced and spliced counts begin to deviate. The mean of unspliced counts (purple) estimates the UMI background level per unspliced probe. Counts less than this value have a high probability of stemming from gDNA.
Starting in Cell Ranger 7.1, the web summary and metrics_summary.csv will report genomic DNA metrics when the v1.0.1 probe set reference CSV with the region column is used. The metrics are shown in the Library view for a singleplex experiment and in the Library and Cells views for a multiplex experiment.
Estimated UMIs from Genomic DNA is the estimated fraction of filtered UMIs derived from gDNA based on the discordance between probes targeting exon-junction-spanning regions and non-exon-junction-spanning regions. Normally, Estimated UMIs from Genomic DNA should be <5% in Fixed RNA Profiling data with good quality samples. The fraction is calculated as follows:Estimated UMIs from genomic DNA per unspliced probe×Number of unspliced probesTotal number of filtered UMIs
Estimated UMIs from genomic DNA per unspliced probe is the estimated number of UMIs derived from gDNA for each probe targeting non-exon-junction-spanning regions. A probe not spanning an exon junction with a total UMI count below this value has a high likelihood of its UMIs being derived primarily from hybridization to genomic DNA rather than mRNA.