Cell Ranger3.0, printed on 04/02/2025
Loupe V(D)J Browser 2 adds support for B cells. All the same visualizations and tools that we used to look at the T cell receptor repertoire are still available, with updates to accommodate analyzing B cell immunoglobulin data. For instance, in addition to the TRA and TRB T cell receptor chains, we now identify IGH, IGK, and IGL immunoglobin chains.
We've provided several example B cell Ig datasets for you to download and explore. For this example, we'll use a PBMC B cell Ig dataset from a normal donor.
Immunoglobulin class switching, or isotype switching, occurs when the constant region of a B cell V(D)J heavy chain sequence changes such that the lymphocyte produces antibodies of a different isotype. Clonotypes are defined as a set of cells with the same CDR3 sequence in their V(D)J variable regions. Since class switching causes recombination in the constant region, outside the CDR3 sequence, it is possible that cells that produce different Ig isotypes may belong to the same clonotype.
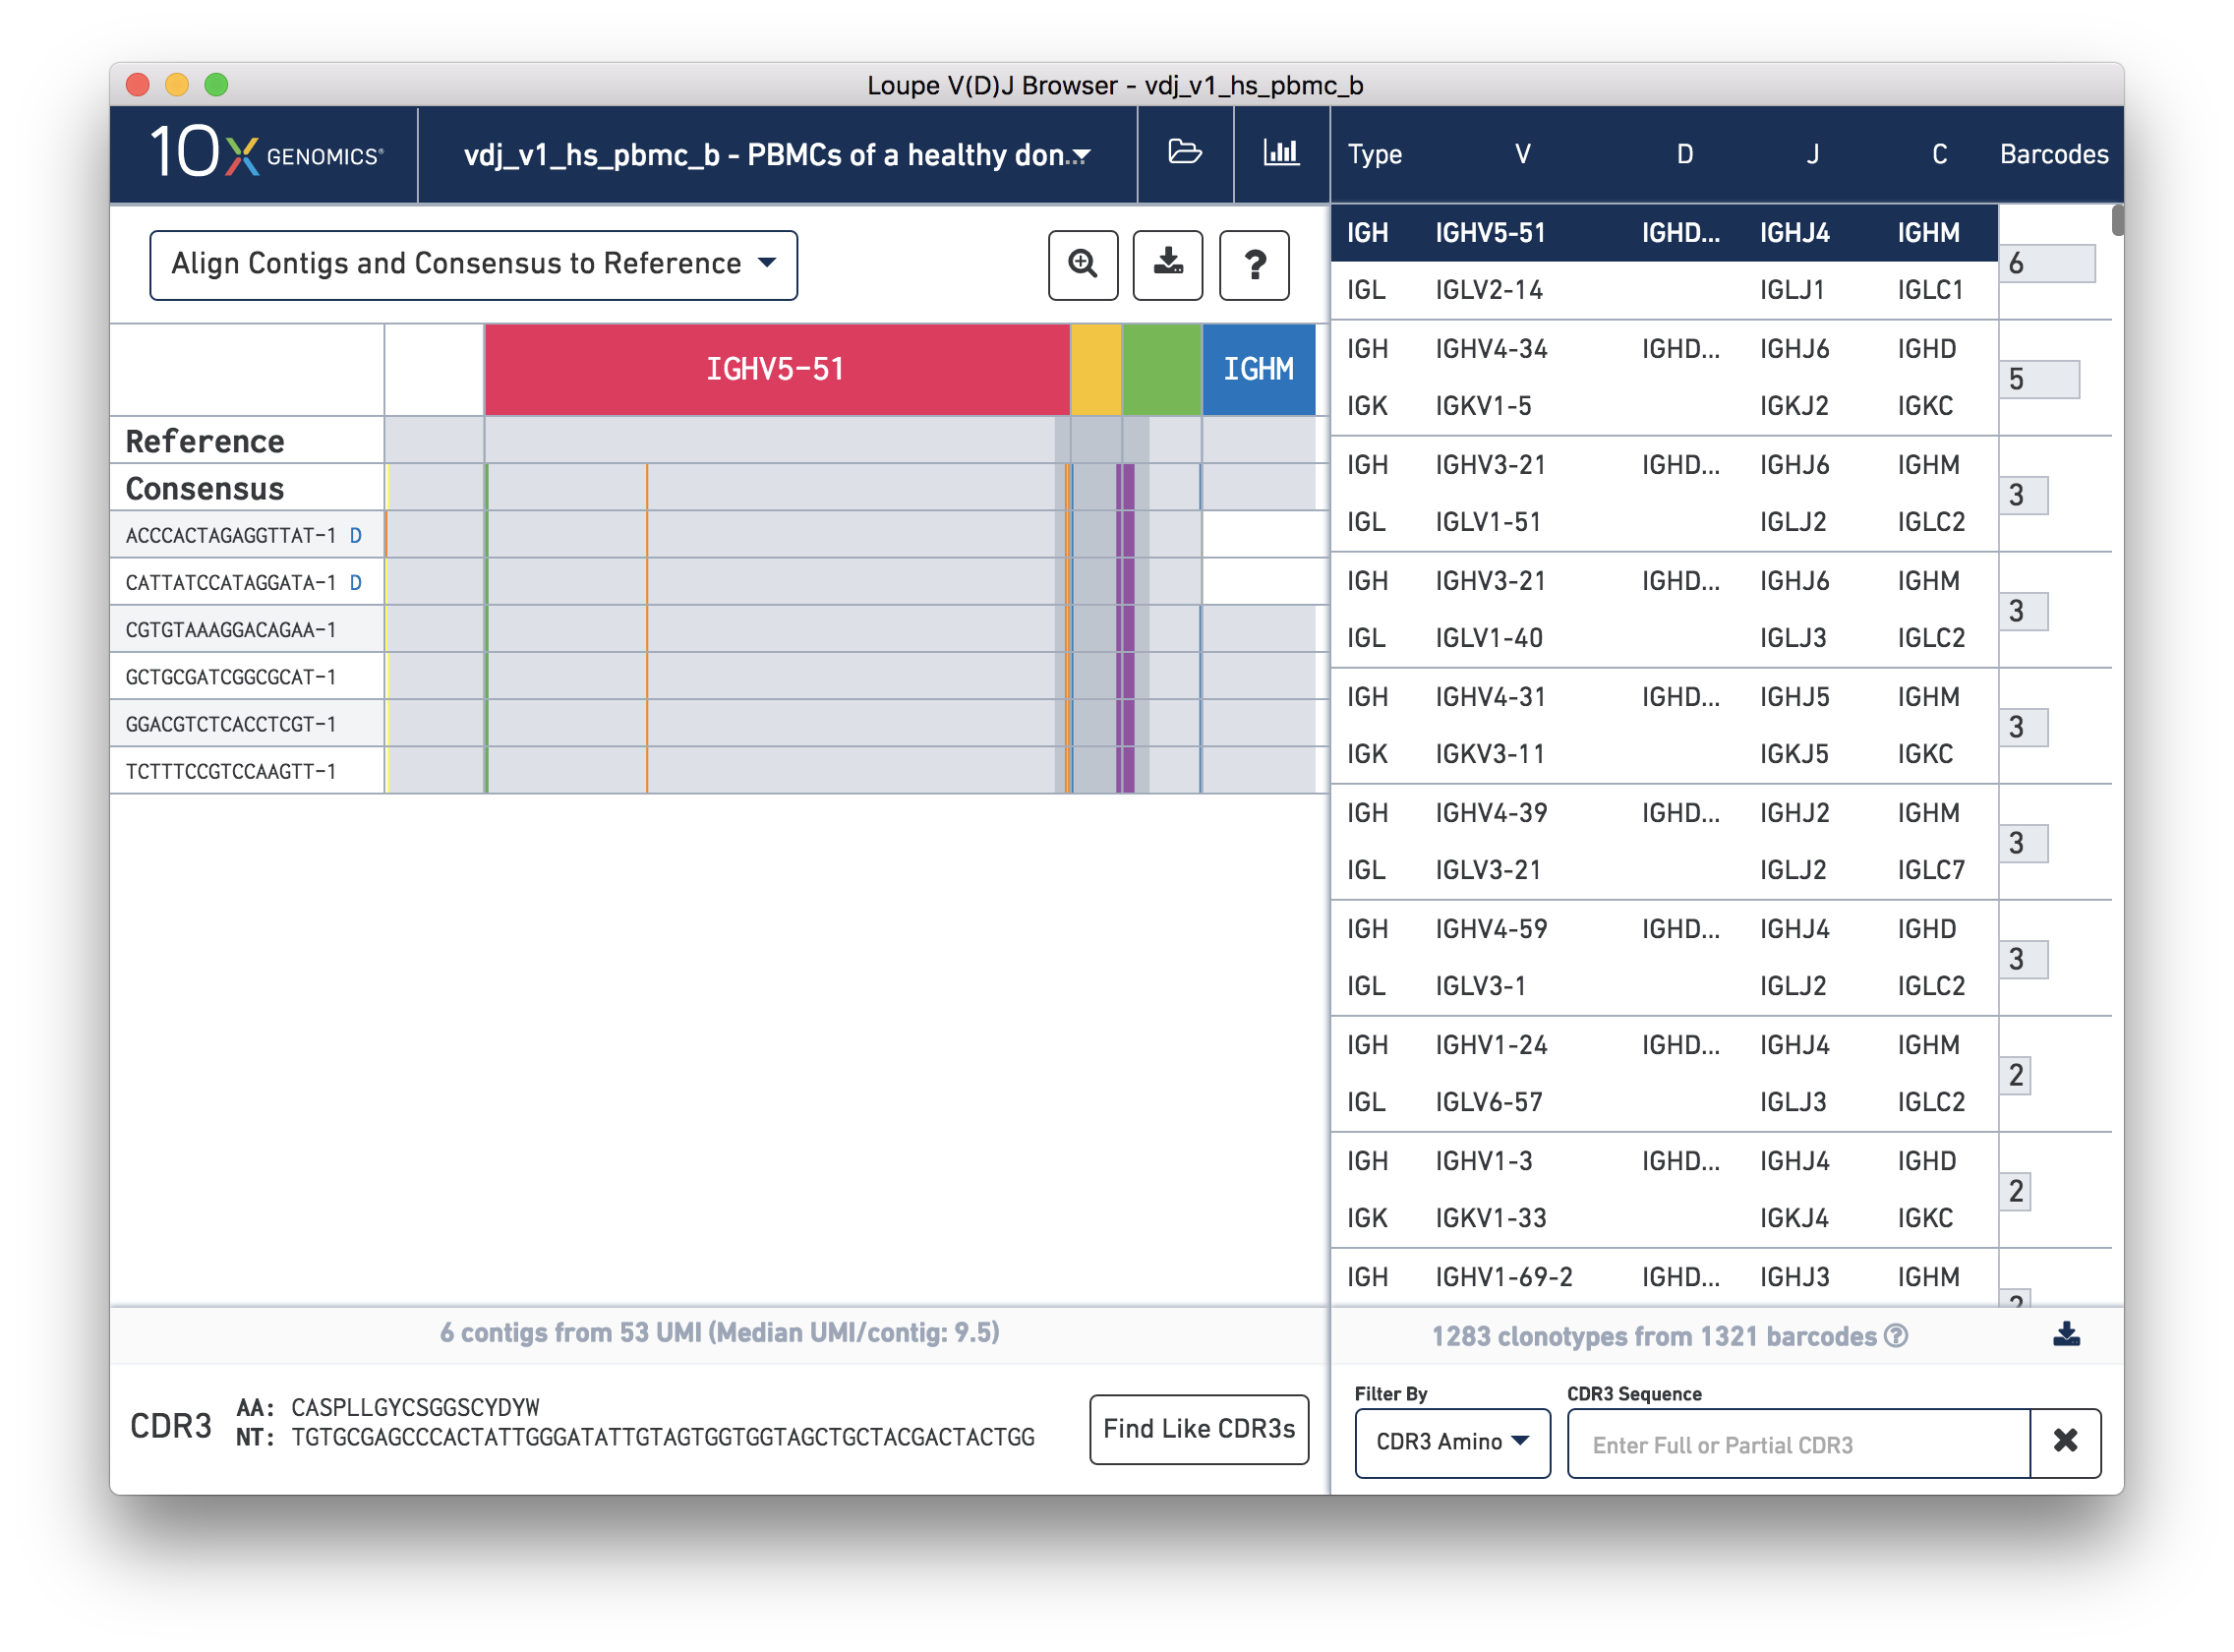
To make it obvious where this occurs, when you click on a heavy chain in a B cell sample and the C region for a contig is different from what was annotated in the consensus, a small letter in blue indicating the isotype will appear next to the barcode.
For example, open and click the heavy chain of the top clonotype in the PBMC dataset you just downloaded. Note that the C region annotation for this consensus is IGHM. Upon clicking you'll see that the first two contigs of this chain have small blue Ds next to the barcode indicating that these contigs have constant regions annotated with IGHD. If you hover over the barcode, you'll see details about the contig including the C gene annotation in red, indicating that it differs from the consensus.
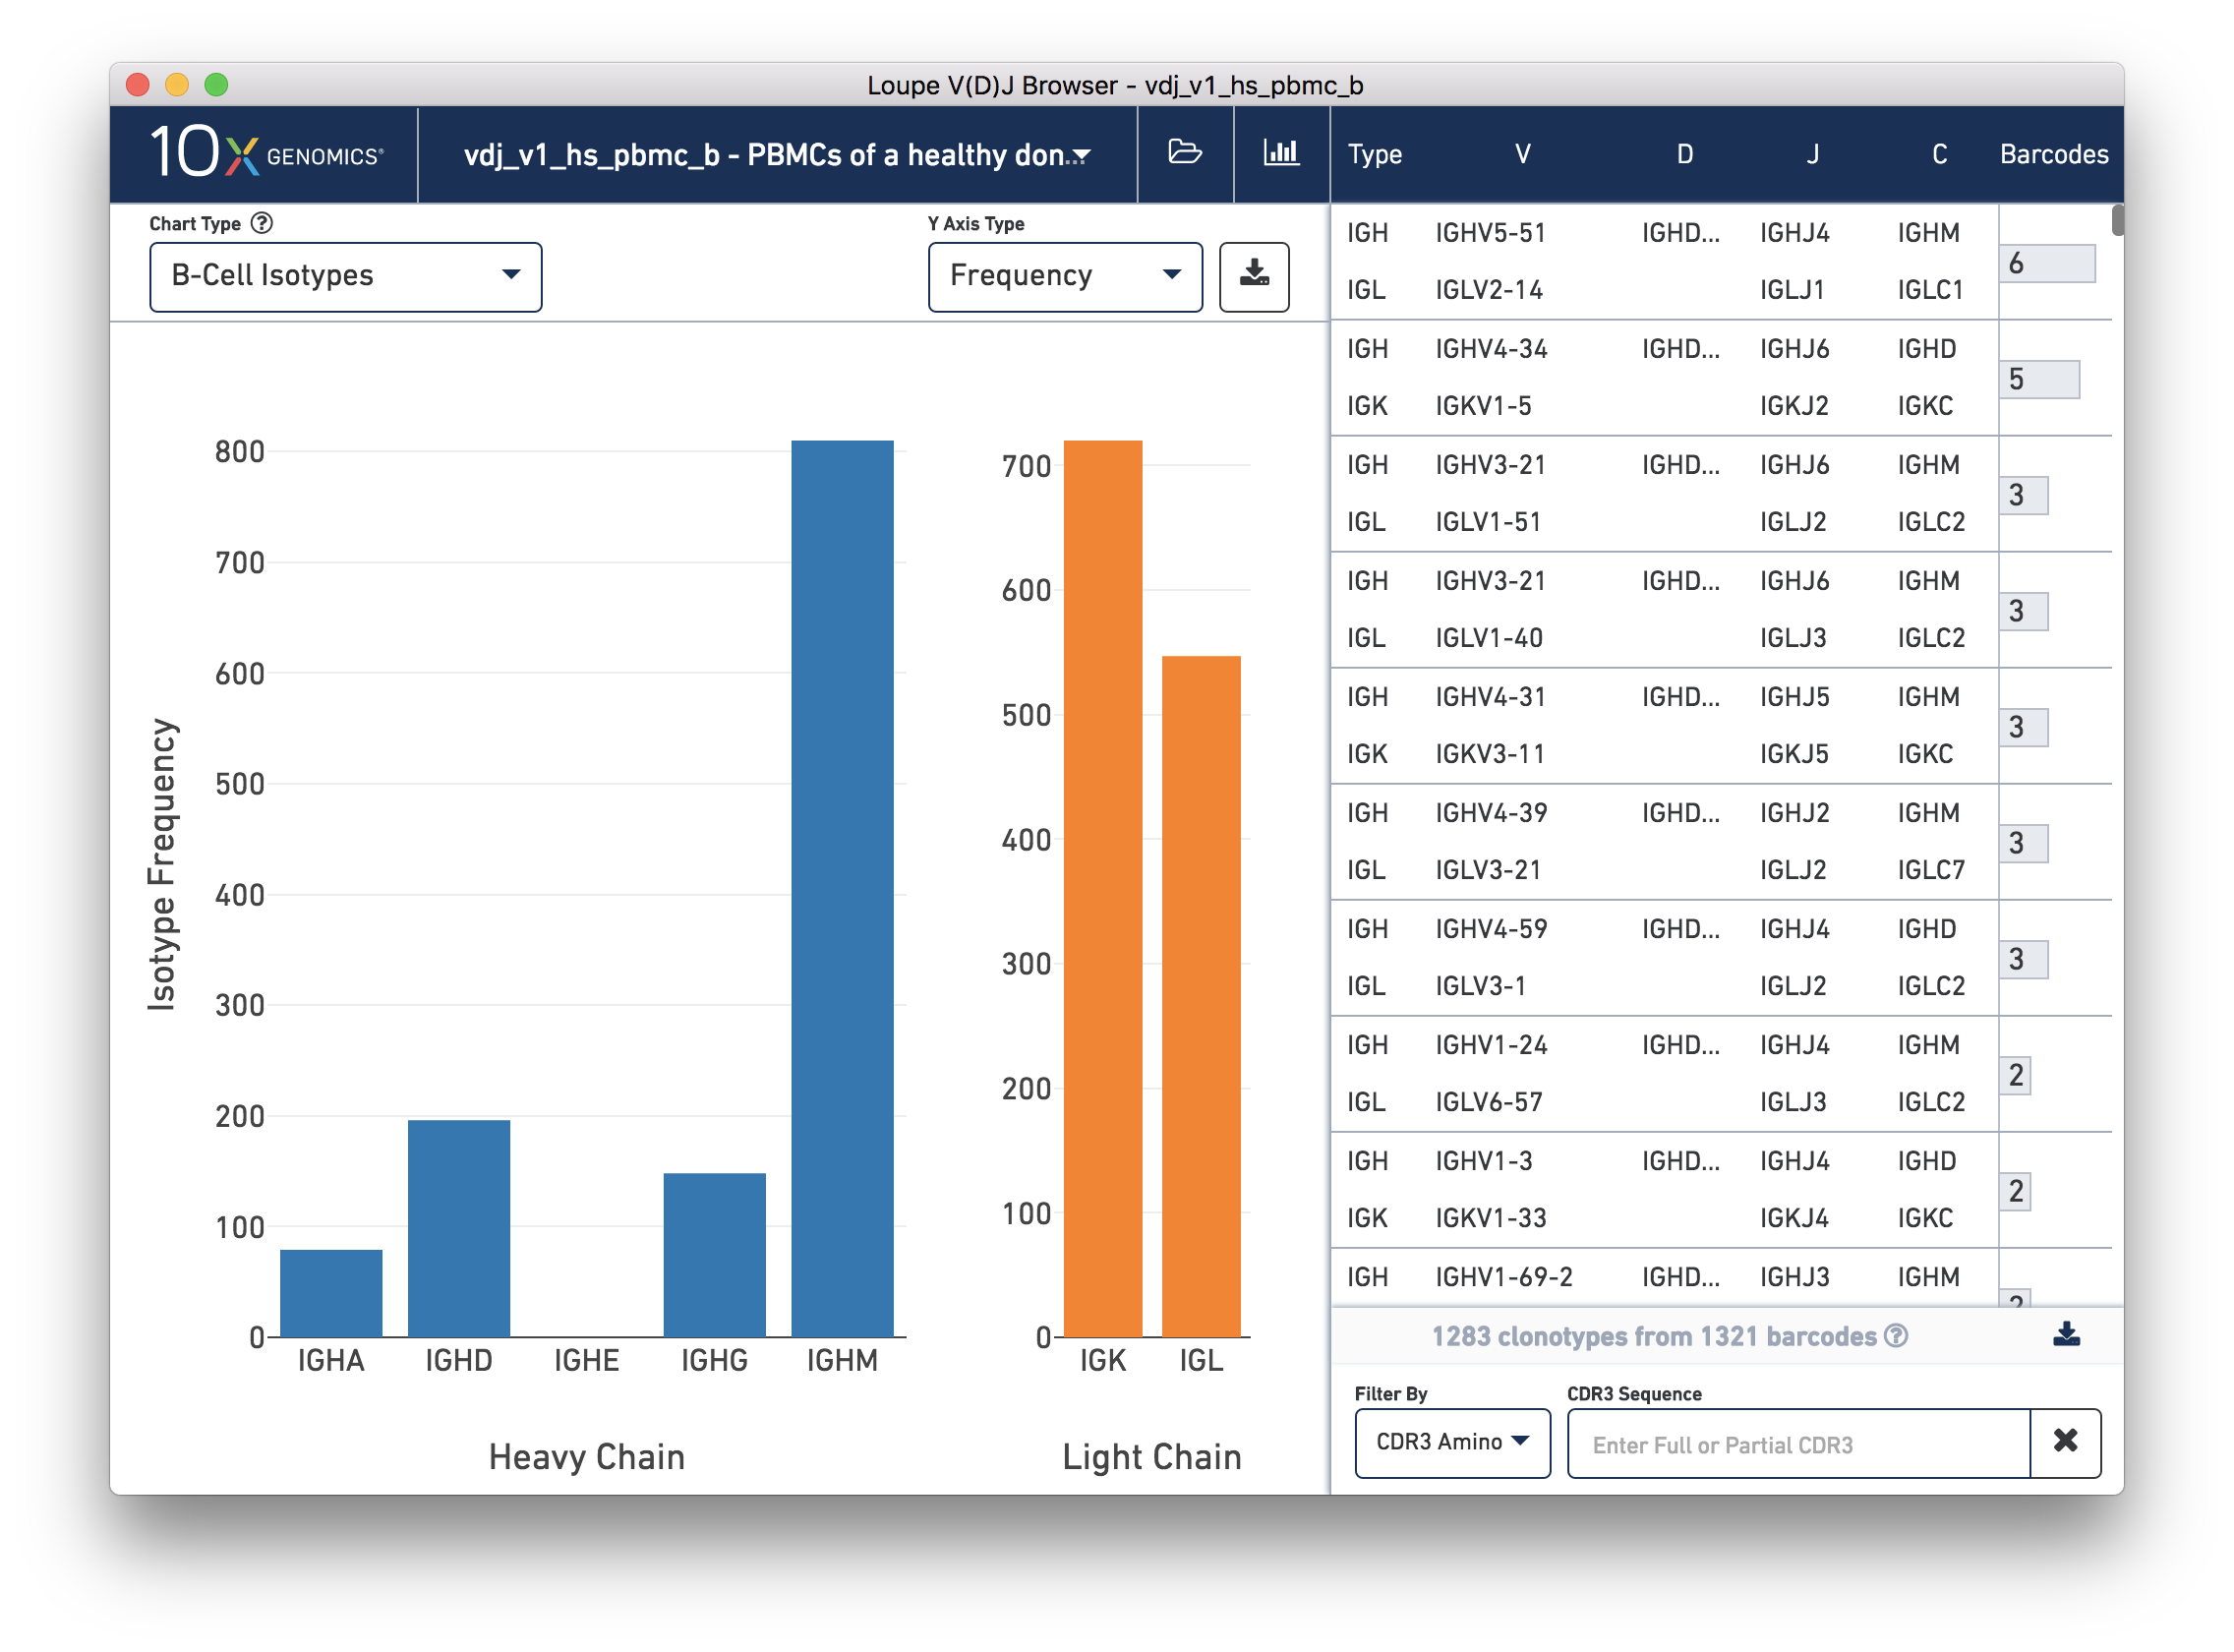
When viewing a B cell sample, there are two additional summary charts which allow you to analyze the isotype distribution. To access these, return to the chart view by clicking the bar chart icon. Then click the Chart Type dropdown and scroll to the bottom of the list to find the B Cell Isotypes and B Cell Paired Isotypes charts.
First, select the B Cell Isotype chart. This chart displays the frequency of immunoglobin isotypes and type of light chains in the sample.
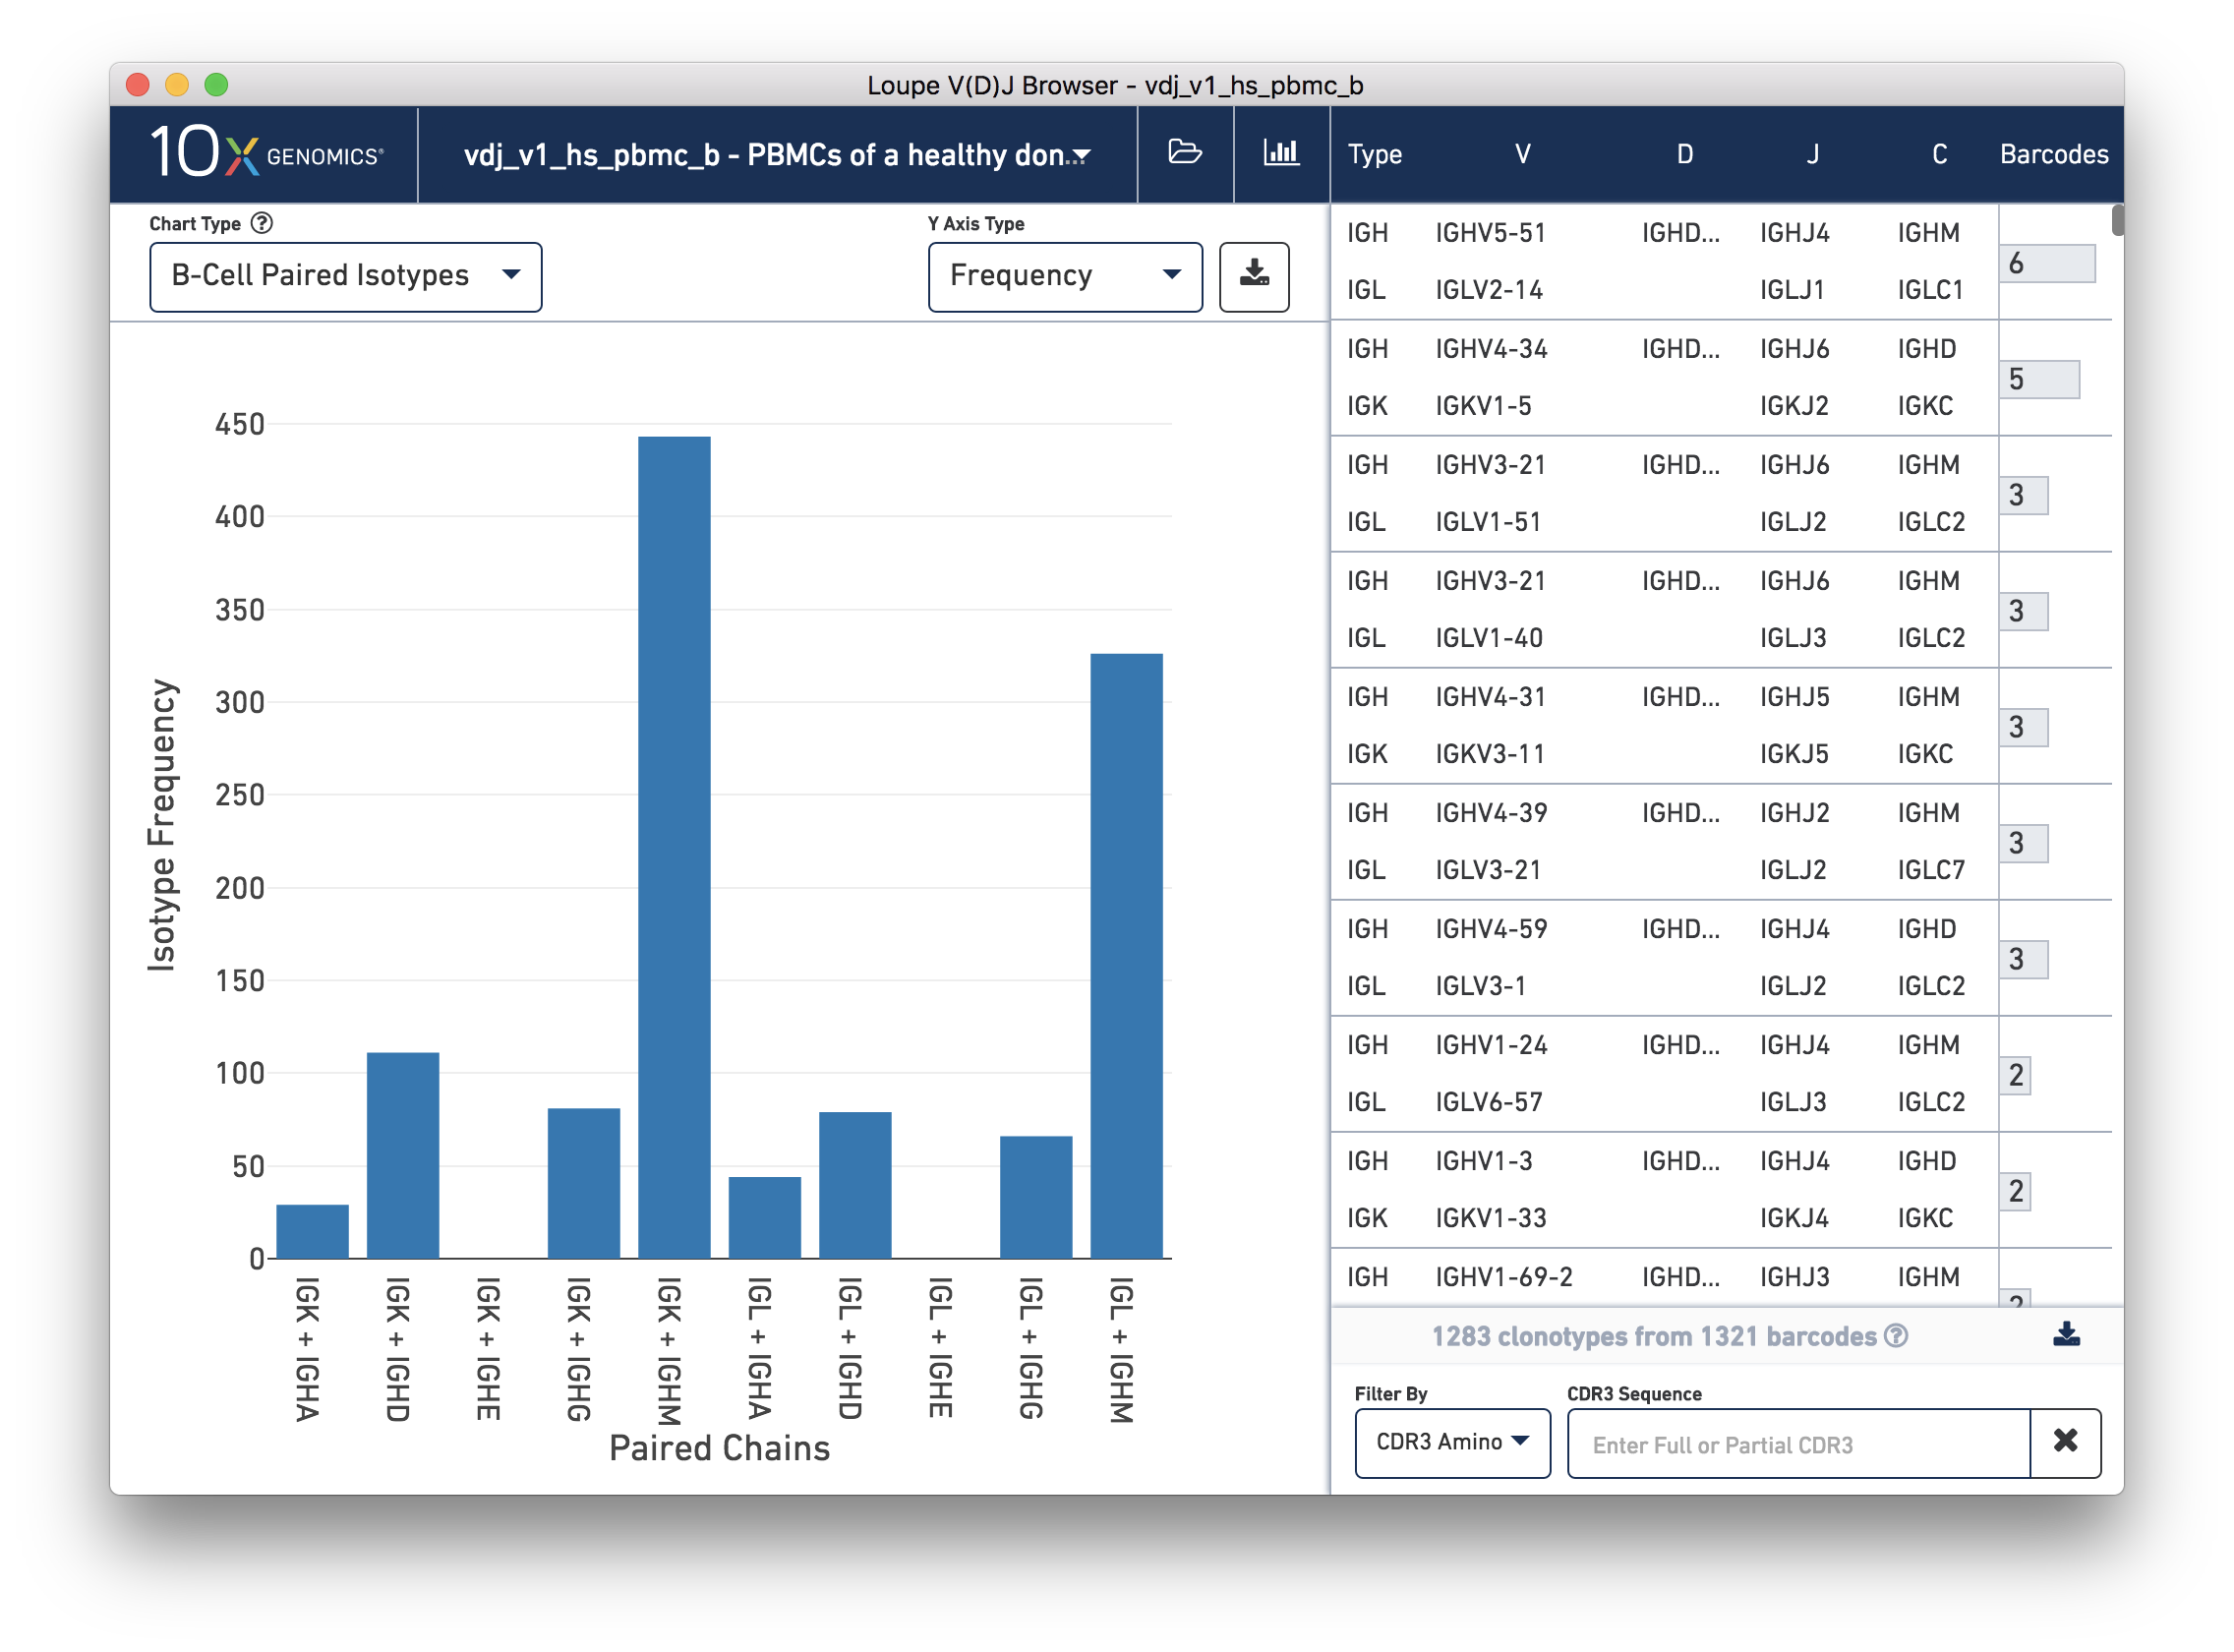
Next, select the B Cell Paired Isotype chart. The chart displays the distribution of paired isotypes and light chains among clonotypes in the sample. Only clonotypes where there is exactly one heavy chain and one light chain are included in this chart.
Of course, it's all the more powerful if you can compare across samples, whether those samples are from different timepoints, different conditions, or different sources. Let's take a look at the new features that allow Loupe V(D)J Browser to open and compare multiple .vloupe files at once.