Space Ranger6.3, printed on 03/26/2025
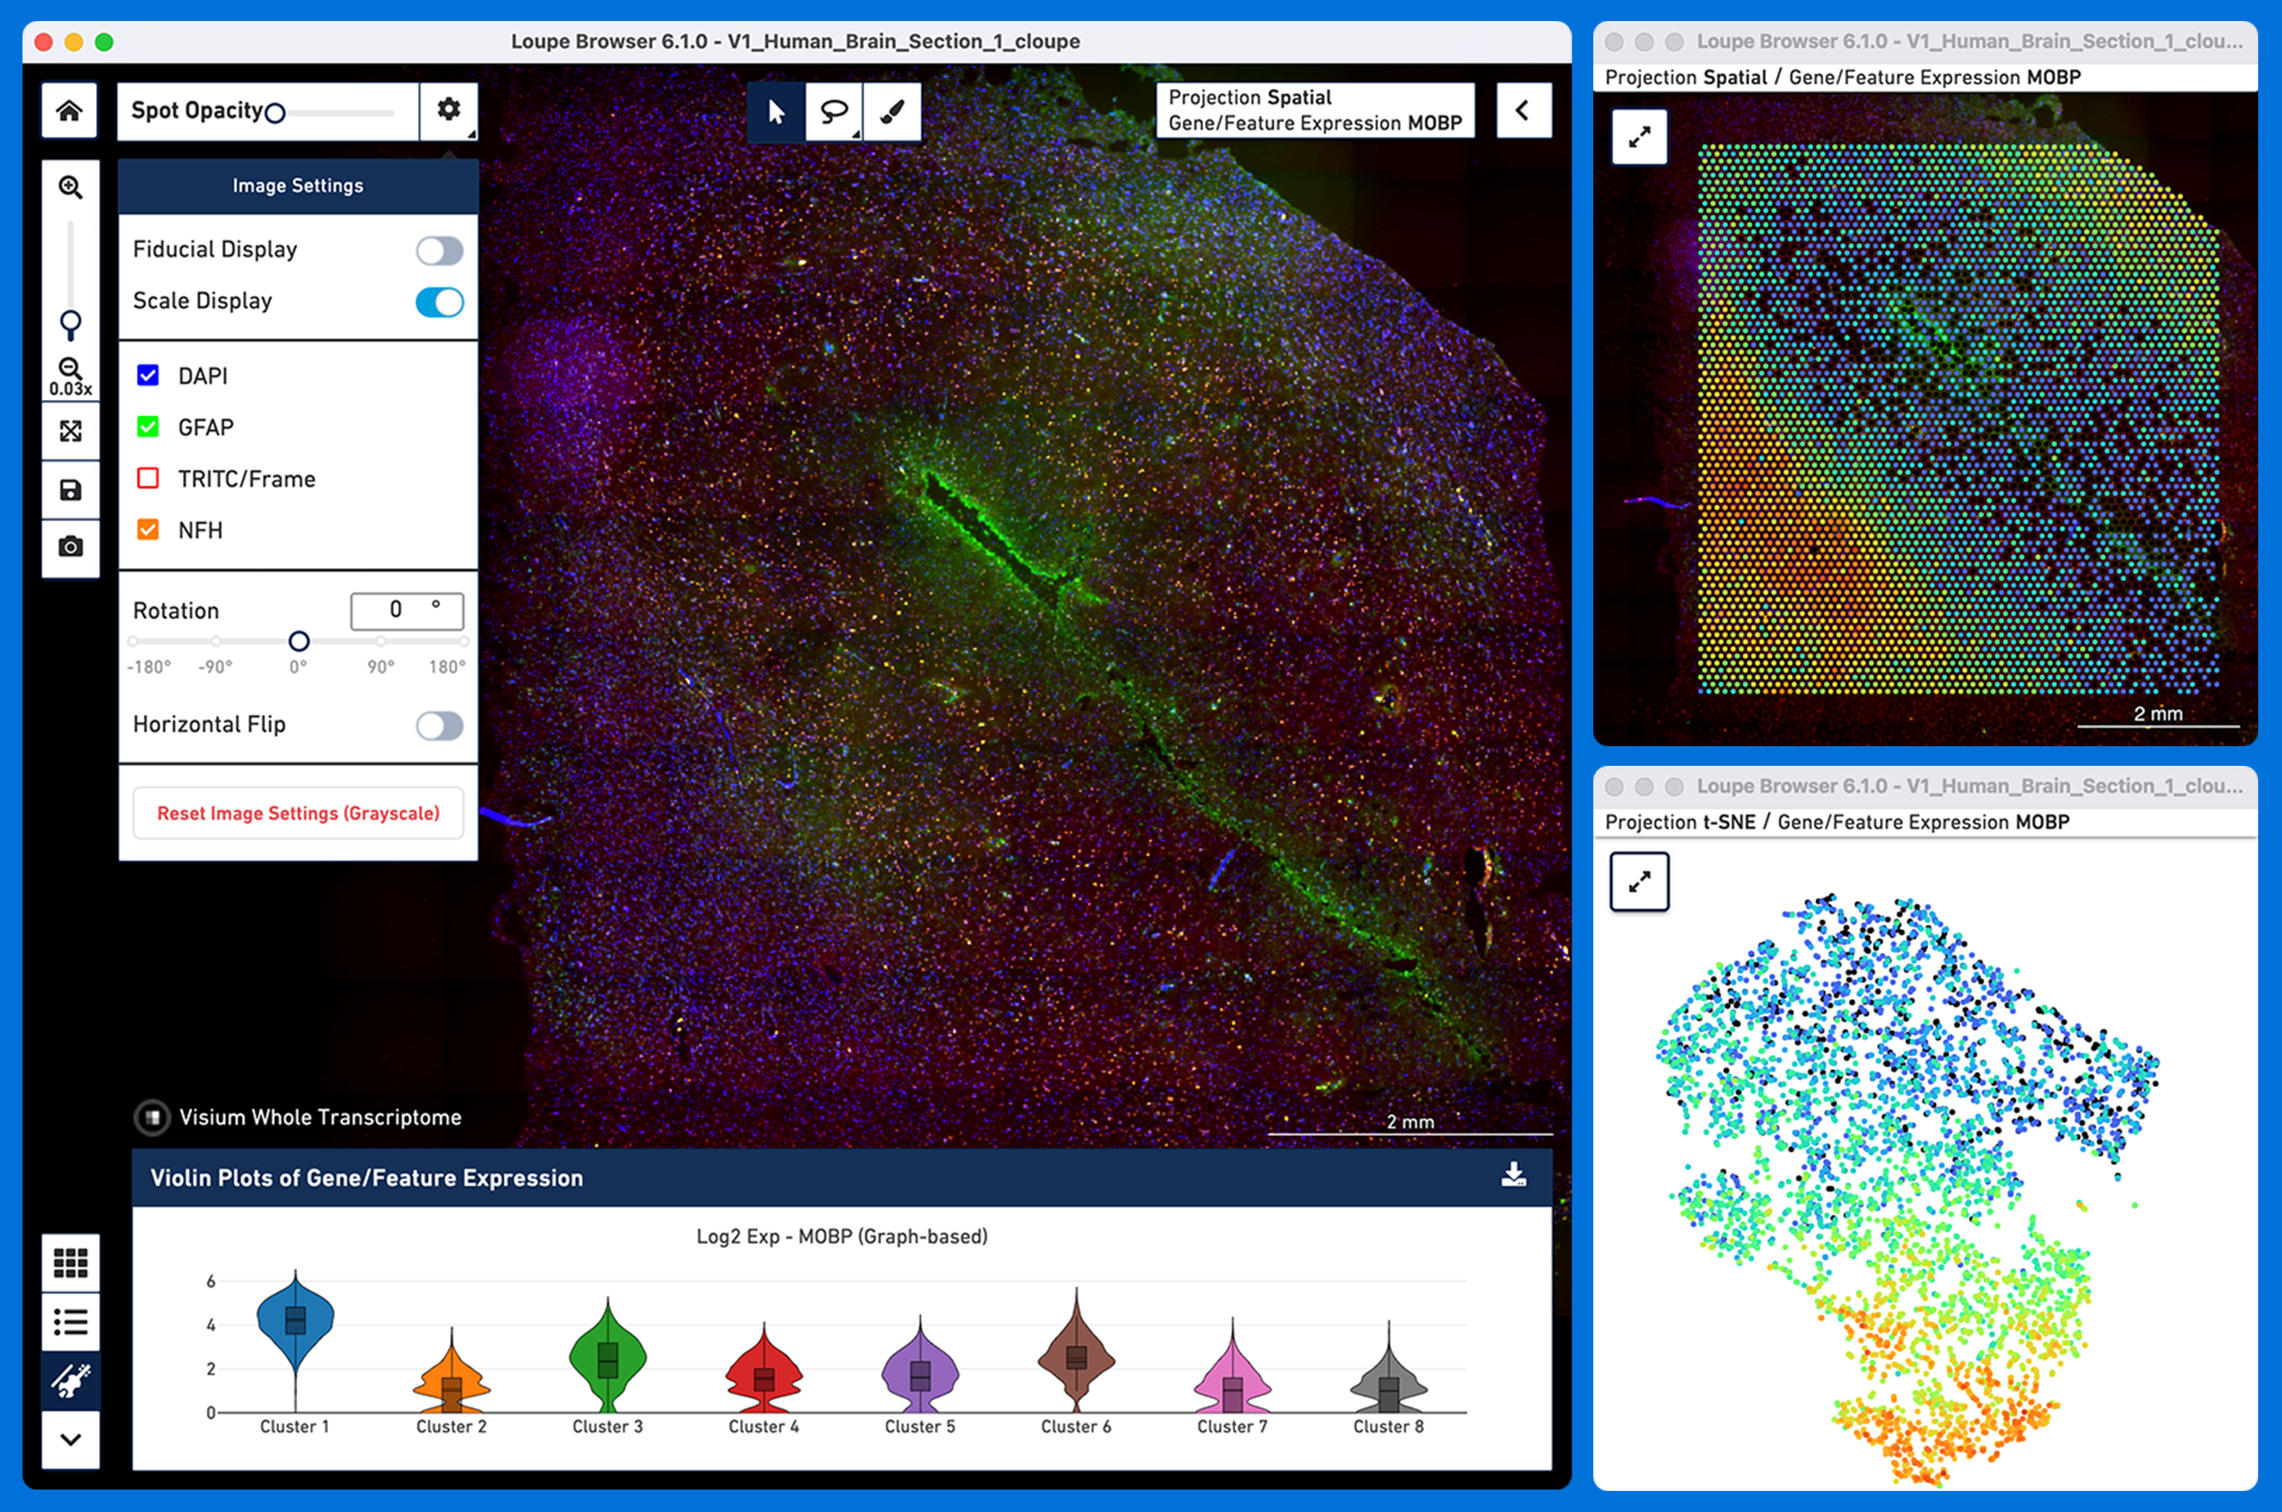
Loupe Browser is a desktop application that provides programming free interactive visualization functionality to analyze data from different 10x Genomics solutions. Loupe Browser allows you to easily interrogate different views of your 10x Genomics data to quickly gain insights into the underlying biology. Loupe is named for a jeweler's loupe, which is used to magnify and inspect the details of precious gemstones.
Loupe Browser supports the analysis of data from the Visium Spatial Gene Expression solution. The typical spatial data analysis worklfow involves Loupe Browser at both upstream and downstream steps. In addition to the downstream visualization and analysis capabilities, Loupe Browser offers support for manual alignment of fiducial frame and tissue selection upstream of running Space Ranger pipeline.

To use Loupe Browser, open any .cloupe file generated by the Space Ranger analysis software which is embedded with the following information:

Loupe Browser provides many powerful analysis capabilities including the ability to perform the following analysis all within the spatial context of a tissue image:
To learn how to use Loupe Browser to analyze your gene expression data, review the following tutorials.
Manual Fiducial Alignment
Use Loupe Browser guided fiducial alignment and tissue selection tools (version 4.0 and later) to generate the manual alignment file in JSON format necessary for spaceranger count pipeline.
Manual CytAssist Image Alignment
Use the Loupe Browser-guided landmark selection and auto refine tools (version 6.2 onwards) to align the CytAssist captured image on Visium slide with a microscope image of the same tissue section on a standard glass slide to generate a alignment JSON file necessary for spaceranger count pipeline.
Navigation
Understand the key features of the interface, the different views, modes and data selector panels as well as export and import options.
Evaluate Gene Markers
Use gene markers of known cell type to view their spatial distribution and explore the use of gene expression independent spatial enrichment metric Moran's I (version 5.1 and later) to evaluate spatiality.
Explore Spatial Clusters
Understand gene expression data in a spatial context and use gene lists to create custom categories and evaluate differential gene expression between them.
Characterize Substructure
Identify subpopulations within clusters in the dataset and create complex Boolean filters to locate regional subfields within a cluster.
Spatial Reclustering
Reanalyze spatial datasets for clusters or regions of interest by customizing clustering and projection parameters to identity new insights.
Sharing Results
Save features of interest, export data tables, and plots from the Visium Spatial data.