Space Ranger2.0, printed on 03/29/2025
The pipeline output contains a subdirectory named spatial/, which stores spatial related files including quality control (QC) images. These QC images are useful to confirm accurate fiducial alignment and tissue detection. However, the user supplied original full resolution images are used for visualization in Loupe Browser.
Space Ranger 2.0 onwards supports the CytAssist enabled Gene Expression (GEX) analysis which introduces additional files in this folder.
Choose the tab to find the descriptions about the files in the folder corresponding to each workflow.
tissue_hires_image.png and tissue_lowres_image.png: These files are downsampled versions of the original,
full-resolution image provided by the user. Downsampling is accomplished by box filtering, which averages RGB values in patches of pixels in the full-resolution image to obtain an RGB value of one pixel in the downsampled image. Note that the downsampled images maintain the aspect ratio of the original image.
tissue_hires_image.png image has 2,000 pixels in its largest dimension.tissue_hires_image.png image is 4,000 pixels in its largest dimension.Irrespective of the slide type, tissue_lowres_image.png is always 600 pixels.
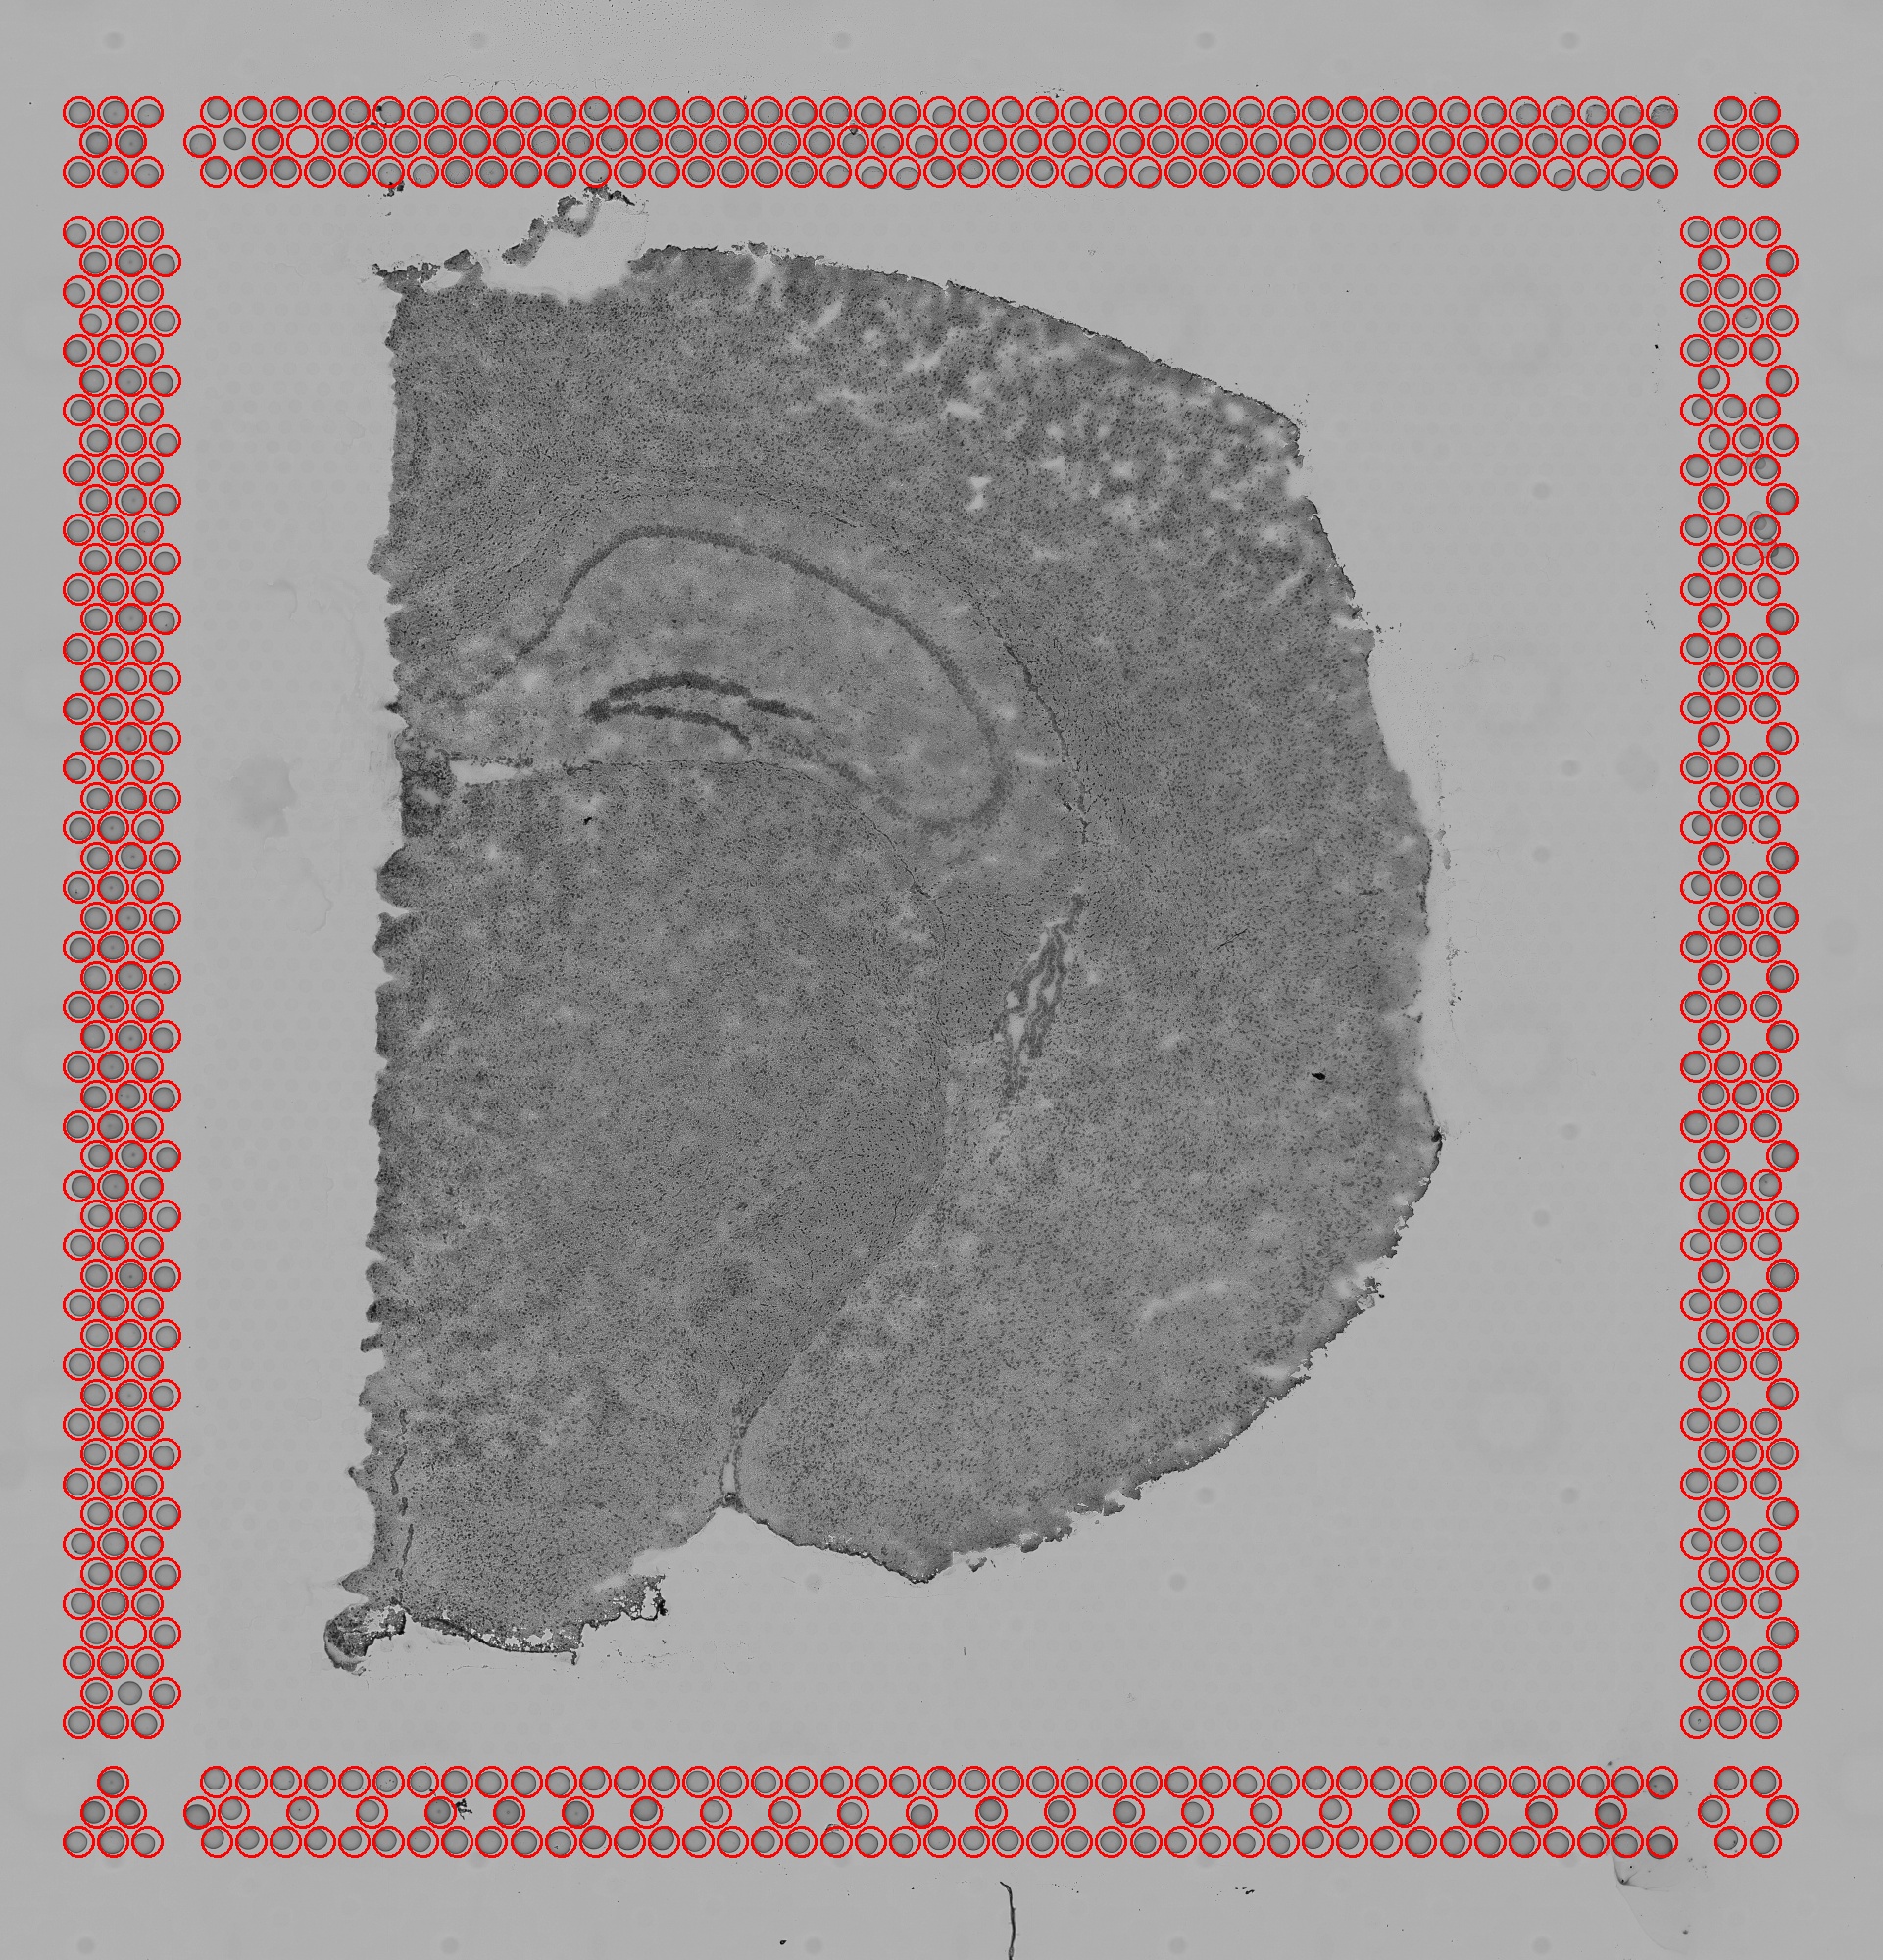
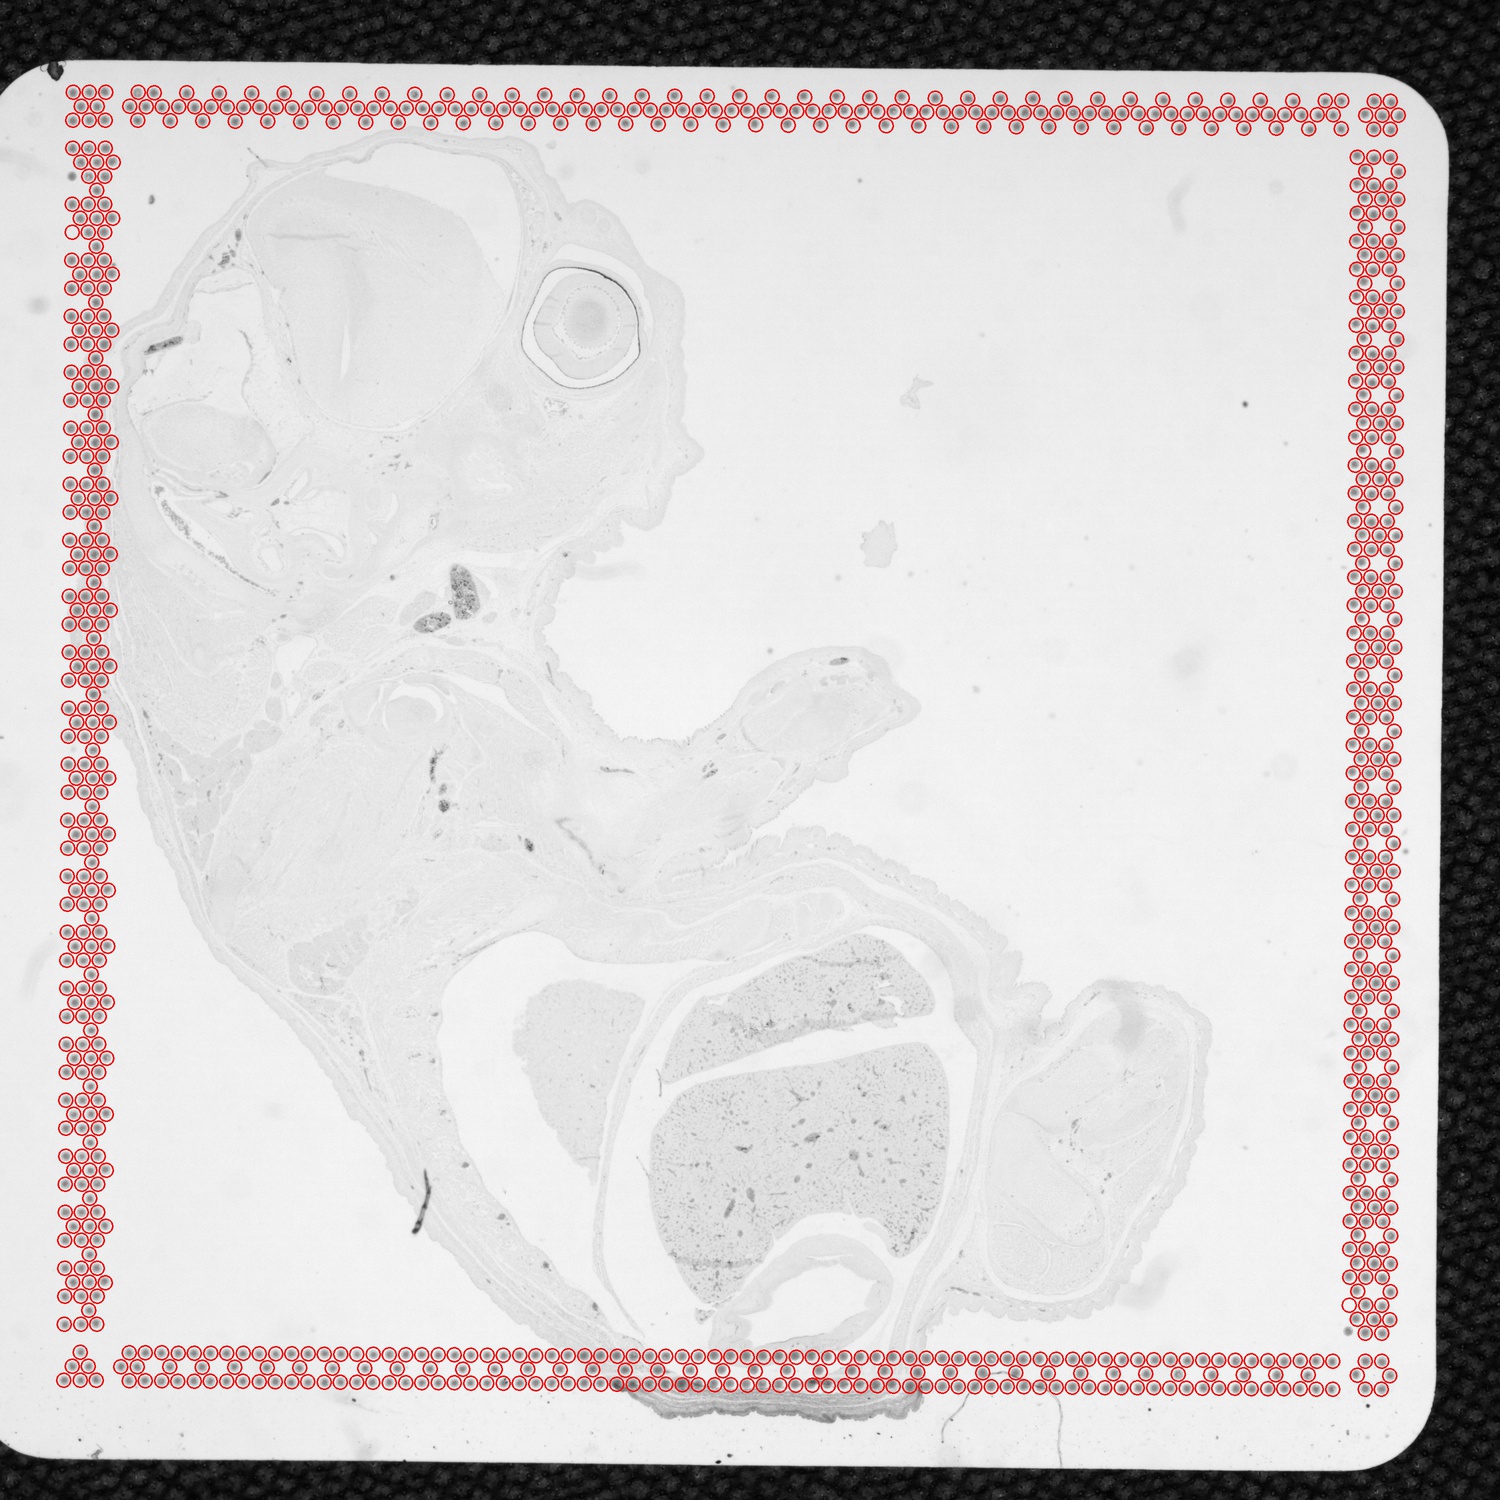
aligned_fiducials.jpg: This image has the dimensions of tissue_hires_image.png. Fiducial spots found by the
fiducial alignment algorithm are highlighted in red. This file is useful to verify that fiducial alignment was
successful.
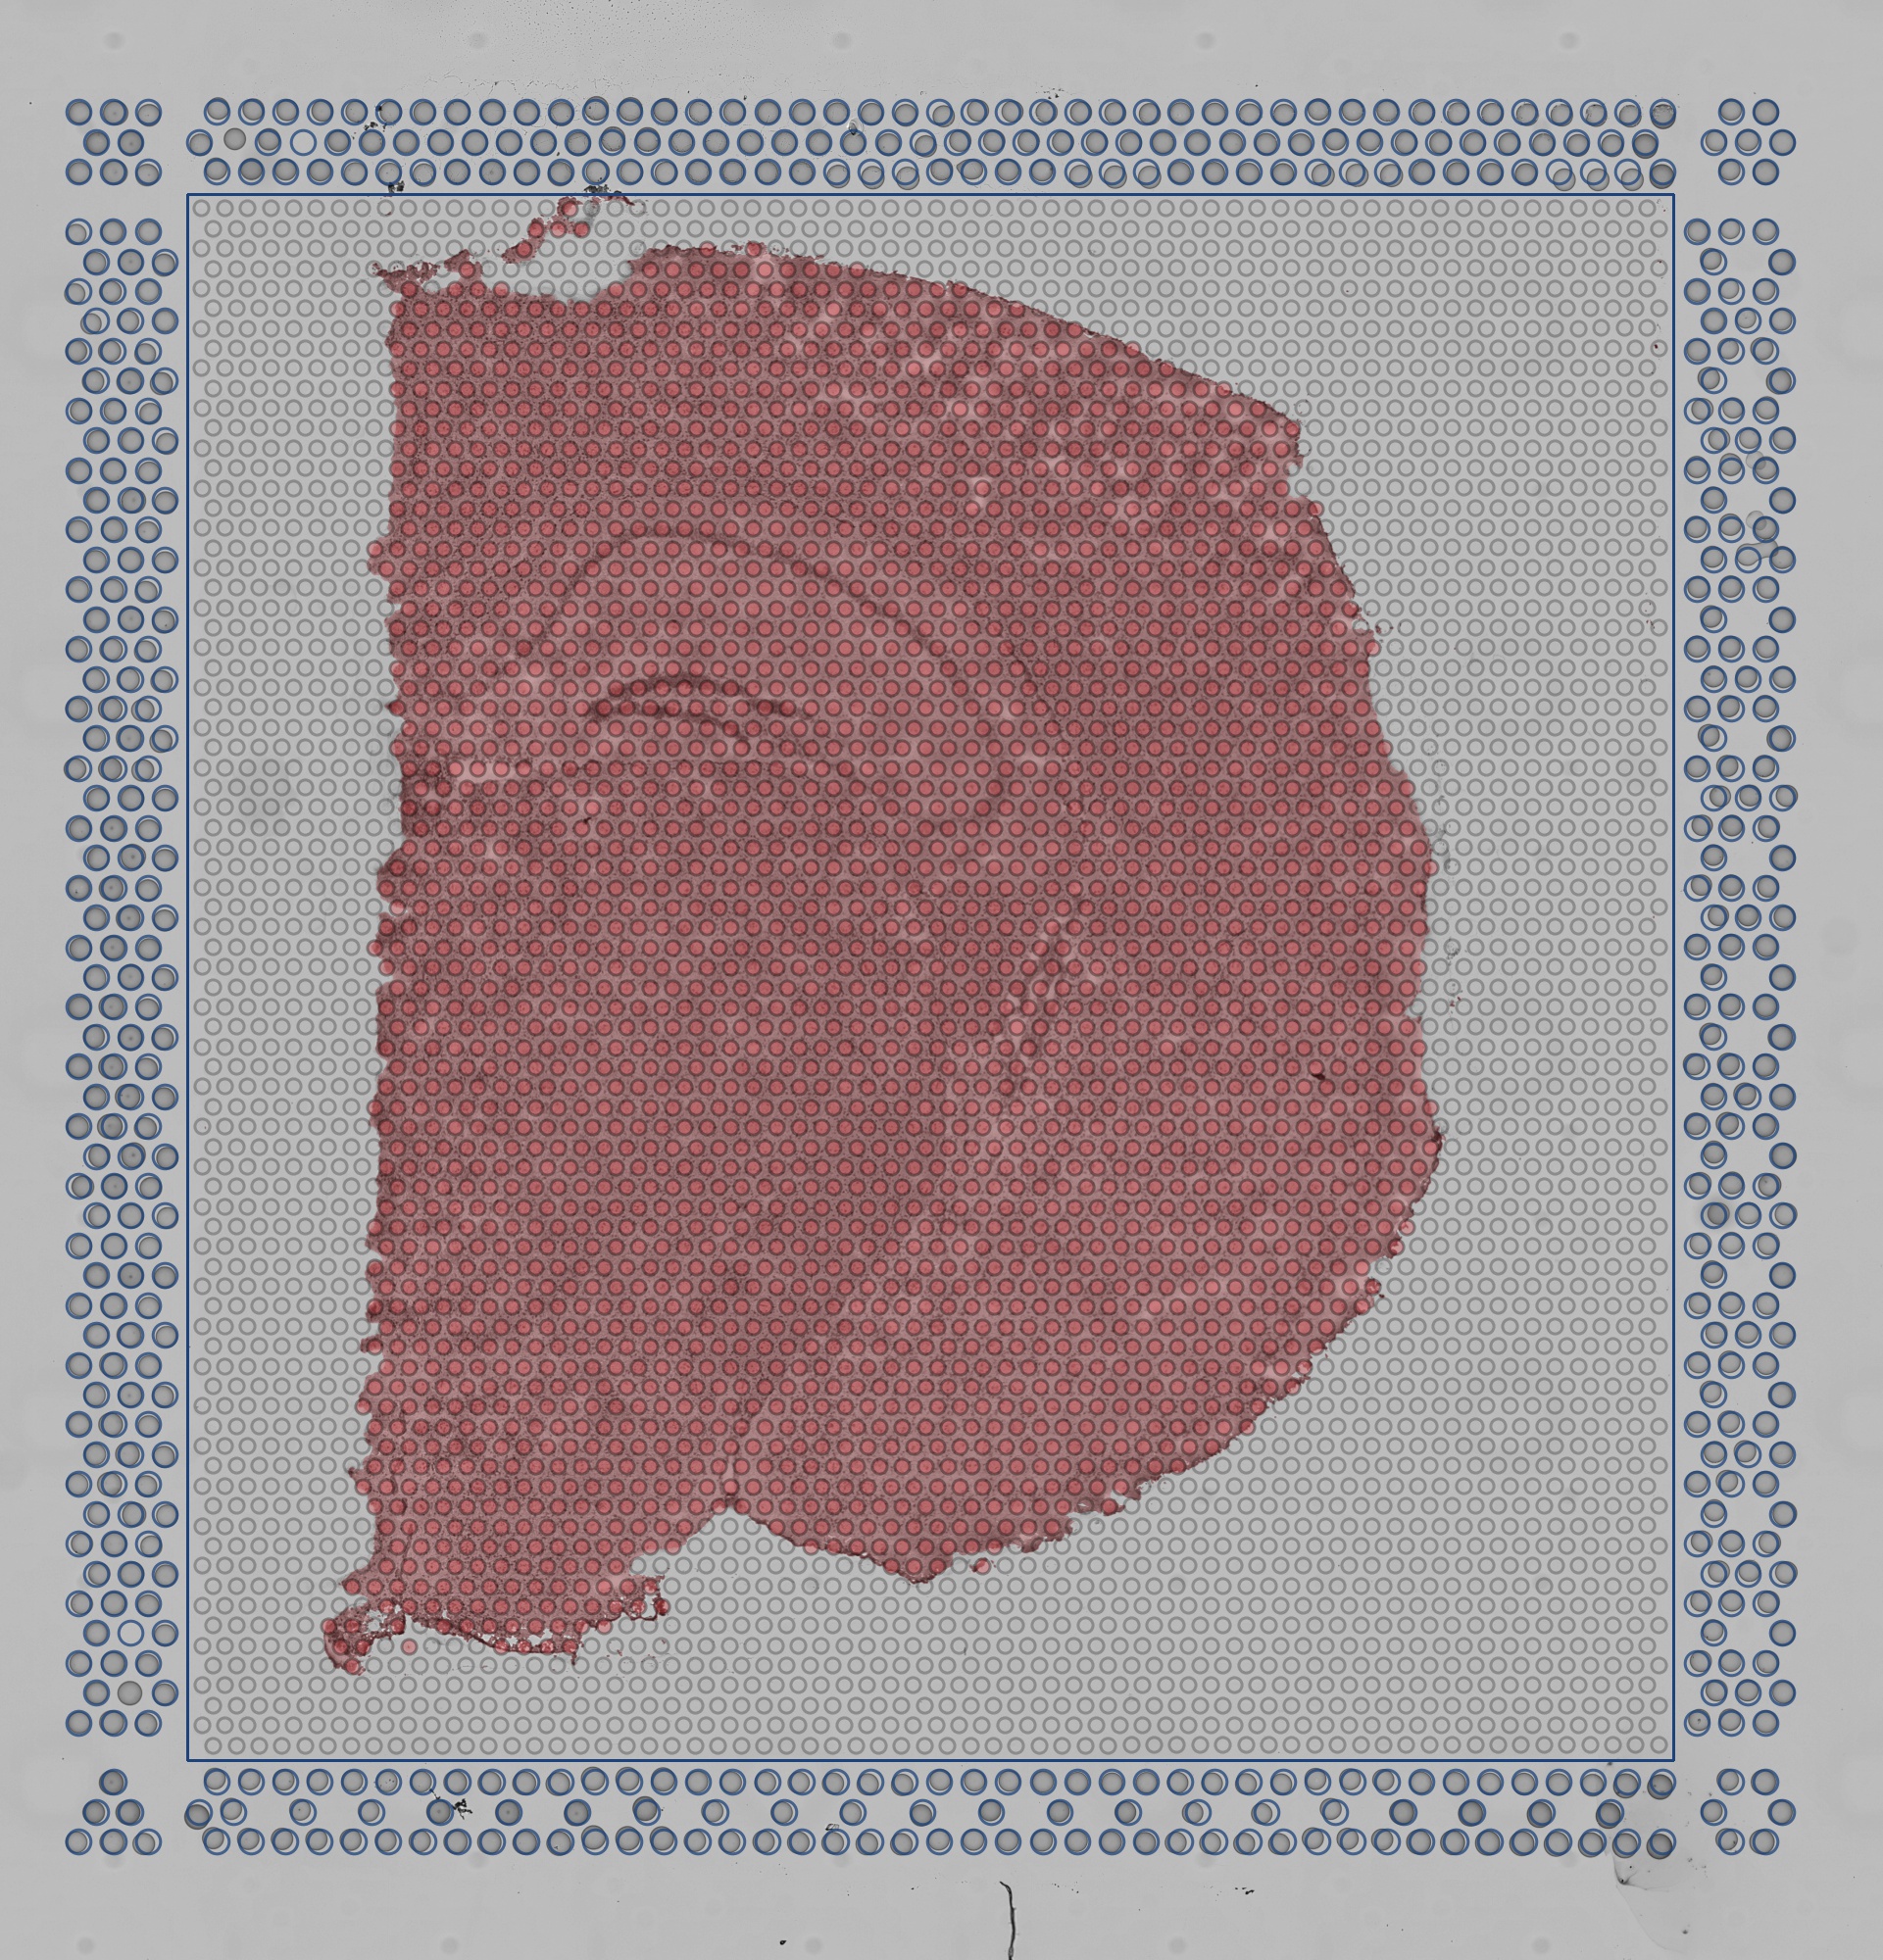
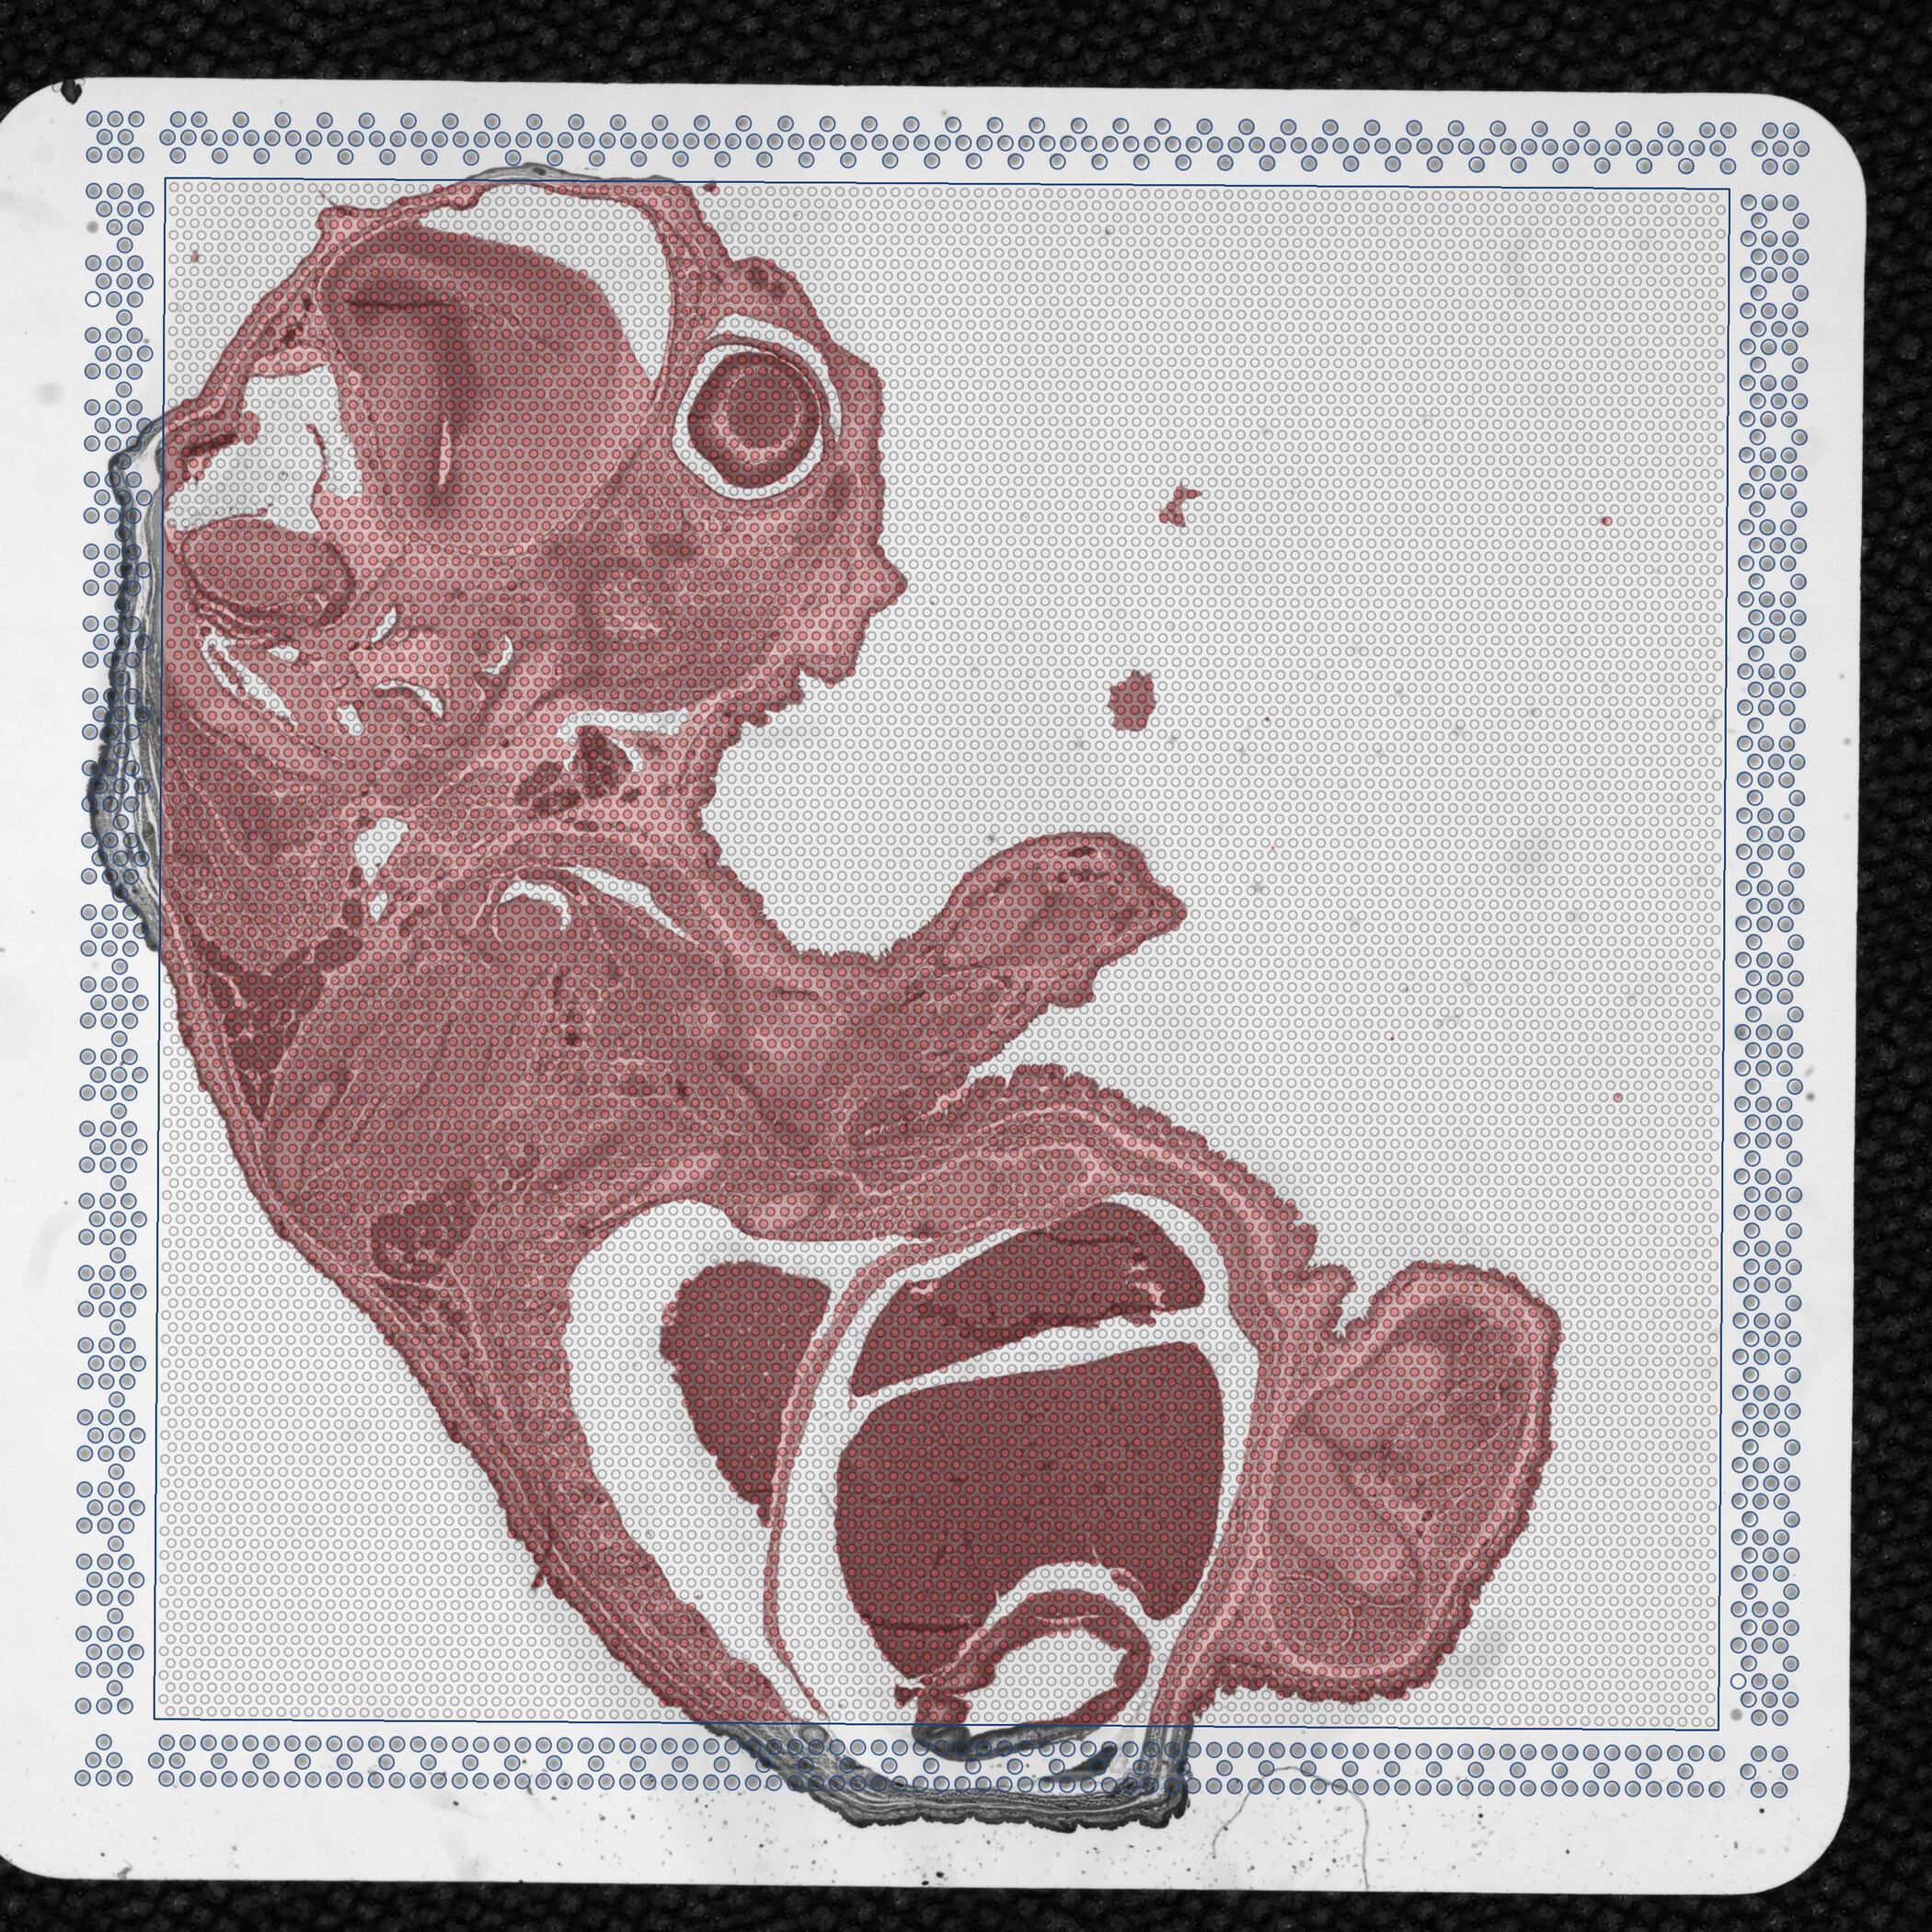
detected_tissue_image.jpg: This image has the dimensions of the tissue_hires_image.png and shows the following:
scalefactors_json.json: This file contains the following fields:
tissue_hires_scalef: A scaling factor that converts pixel positions in the original, full-resolution image to
pixel positions in tissue_hires_image.png.tissue_lowres_scalef: A scaling factor that converts pixel positions in the original, full-resolution image to
pixel positions in tissue_lowres_image.png.fiducial_diameter_fullres: The number of pixels that span the diameter of a fiducial spot in the original,
full-resolution image.spot_diameter_fullres: The number of pixels that span the diameter of a theoretical 65µm spot in the original, full-resolution image.$ cd /home/jdoe/runs/sampele345/outs/spatial $ cat scalefactors_json.json {"tissue_hires_scalef": 0.17011142, "tissue_lowres_scalef": 0.051033426", "fiducial_diameter_fullres": 144.4773339857, "spot_diameter_fullres": 89.43834961021503}
The example scalefactors_json.json values above are derived from the adult mouse brain dataset which includes an image with dimensions of 11291 x 11757. The scalefactors are calculated as
scalefactor=target sizemax(original image width, original image height)
Since the largest dimension for the tissue_hires_image.png is 2000 pixels, the tissue hires scalefactor will be tissue_hires_scalef=200011757≈0.17011142
Similarly for the tissue_lowres_image.png, the largest dimension is 600 pixels and the tissue lowres scalefactor is tissue_lowres_scalef=60011757≈0.051033426
The spot diameter and fiducial diameter are estimated fractional pixels of the spot diameter in the original image. They are estimated based on the registration solution and the known size of the spots and fiducial frame and does not use prior knowledge of the image pixel sizes. In this example, the estimated pixel size was calculated from the spot diameter for the full resolution image. microns/pixels=6589.43834961≈0.7267575965
tissue_positions.csv: This text file contains a table with rows that correspond to spots. From Space Ranger v2.0 onwards this file, which was previously named tissue_positions_list.csv, is renamed and includes a header column. Excluding the header column, the file has 4,992 rows for Visium slides with a 6.5 mm Capture Area and 14,336 rows for Visium slides with 11 mm Capture Area which is the number of spots in the spatial array. Columns correspond to the
following fields:
barcode: The sequence of the barcode associated to the spot.in_tissue: Binary, indicating if the spot falls inside (1) or outside (0) of tissue.array_row: For Visium slide (6.5 mm Capture Area), the row coordinate of the spot in the array from 0 to 77. The array has 78 rows. For Visium slides (11 mm Capture Area), the row coordinate of the spot range from 0 to 127 as the array has 128 rows.array_col: The column coordinate of the spot in the array. In order to express the "orange crate" arrangement of the spots, for Visium slides (6.5 mm Capture Area) this column index uses even numbers from 0 to 126 for even rows, and odd numbers from 1 to 127 for odd
rows with each row (even or odd) resulting in 64 spots. For Visium slides (11 mm Capture Area) this column index uses even numbers from 0 to 222 for even rows, and odd numbers from 1 to 223 for odd
rows with each row (even or odd) resulting in 111 spots.pxl_row_in_fullres: The row pixel coordinate of the center of the spot in the full resolution image.pxl_col_in_fullres: The column pixel coordinate of the center of the spot in the full resolution image.$ cd /home/jdoe/runs/sample345/outs/spatial $ column -s, -t < tissue_positions.csv | head -n 10 barcode in_tissue array_row array_col pxl_row_in_fullres pxl_col_in_fullres GTCACTTCCTTCTAGA-1 0 0 0 1832 11971 CACGGTCTCCTTACGA-1 0 0 2 1832 11833 ATAGCTGCGGATAAGA-1 0 0 4 1832 11695 GTCAGTATGTCCGGCG-1 0 0 6 1832 11556 ATGTACCAGTTACTCG-1 0 0 8 1831 11418 ACGCTCAGTGCACCGT-1 0 0 10 1831 11280 TCACTAACGTATAGTT-1 0 0 12 1831 11142 CGGTTAGGCCTGGACG-1 0 0 14 1831 11004 GATATCACCAGCATGG-1 0 0 16 1831 10866
The spots are arranged using a orange crate packing to maximize packing density. Further explanation of this arrangement can be found in this article.
Note that the tissue_positions.csv contains the same information about the barcode whitelist and their slide coordinates as that contained in the barcodes folder that comes bundled with Space Ranger (spaceranger-x.y.z/lib/python/cellranger/barcodes where x.y.z represent the version number).
spatial_enrichment.csv: File in CSV format that contains table of Moran's I values for each feature when specific conditions are met:
The Moran's I value can be anywhere between -1 (perfectly dispersed) to 1 (perfectly enriched) but in biological samples values significantly below 0 are unexpected. A p-value is provided, as well as an adjusted p-value which is corrected using the Benjamini-Hochberg method for multiple comparisons.
From Space Ranger 2.0 onwards, the spatial_enrichment.csv file includes a Feature Type column the value for which is Gene Expression for single-library analysis.
# Gene Expression output
$ cd /home/jdoe/runs/sampele345/outs/spatial
$ column -s, -t < spatial_enrichment.csv | less -#2 -S

Feature ID          Feature Name    Feature Type     I                        P value                 Adjusted p value        Feature Counts in Spots Under Tissue  Median Normalized Average Counts  Barcodes Detected per Feature
ENSMUSG00000053310  Nrgn            Gene Expression  0.849230495400066        0.0                     0.0                     140702                                42.22927672729207                 2645
ENSMUSG00000070570  Slc17a7         Gene Expression  0.8228828454463434       0.0                     0.0                     49919                                 15.927820652112793                2435
ENSMUSG00000046447  Camk2n1         Gene Expression  0.8112121614961633       0.0                     0.0                     126518                                44.058800706638436                2698
ENSMUSG00000021948  Prkcd           Gene Expression  0.8093848987347875       0.0                     0.0                     11675                                 4.552770117948635                 1430
ENSMUSG00000061808  Ttr             Gene Expression  0.8088005899881938       0.0                     0.0                     348686                                76.73215387483816                 2674
ENSMUSG00000041607  Mbp             Gene Expression  0.7965984861055619       0.0                     0.0                     258769                                112.84701279639039                2700
ENSMUSG00000035383  Pmch            Gene Expression  0.7847484395395488       0.0                     0.0                     67814                                 17.005396313242215                1718
ENSMUSG00000024985  Tcf7l2          Gene Expression  0.7769492292430982       0.0                     0.0                     6546                                  2.564212465278306                 1282
ENSMUSG00000032532  Cck             Gene Expression  0.7605729556575779       0.0                     0.0                     67935                                 21.68537496001758                 2585
barcode_fluorescence_intensity.csv: File in CSV format that is generated for any input image specified by --darkimage. This file contains the statistics about the fluorescence intensity which is calculated for every spot and every fluorescence channel in the input image.
If the channels were given custom names in the Loupe manual alignment session that produced the alignment JSON file, then the CSV header will use the given channel names. By default, channels are named channel1, channel2, etc. This file can be used for secondary analysis in R/Python and can also be combined with the tissue_positions.csv file.
$ cd /home/jdoe/runs/sampele345/outs/spatial
$ column -s, -t < barcode_fluorescence_intensity.csv | less -#2 -S

barcode             in_tissue  channel1_mean       channel1_stdev      channel2_mean       channel2_stdev
CGAGGATATTCAGAGC-1  0          4254.328631875882   59.72596599289198   2370.7574047954868  23.587614594004506
TCTGGTACTAATGCGG-1  0          4242.12976022567    61.31391702047626   2348.9830747531737  22.960436841214605
AGGTGACCATGACGCT-1  0          4237.420310296192   62.954555749425516  2330.277856135402   18.66240280182469
CAGAGGTGTACGTAGC-1  0          4219.421720733428   60.38810661890725   2323.2045133991537  20.876943016829802
TAGCTAGAAGATACAT-1  0          4202.056417489422   62.2343918192054    2309.320169252468   18.883665883691563
AGCACTGACCGGCTTA-1  0          4185.466854724965   61.848950071485     2300.589562764457   17.98861741514344
ATAACCTAAGGCGTCA-1  0          4149.37658674189    58.4482514520289    2292.1255289139635  19.824612785901802
TAGAACCTCAGTTAGA-1  0          4156.802538787024   64.86614573399514   2298.7390691114247  19.838300058320733
CCGACATAAGTATCAA-1  0          4194.483779971792   62.19636612986138   2313.277856135402   20.56714424032058
GACTACCAACTGGTCC-1  0          4204.746121297602   62.91221526144468   2328.5232722143865  54.82377031240396
CytAssist enabled GEX analysis offers flexibility of using the CytAssist instrument captured image along with a microscope image of the same tissue section on a standard glass slide. The images of the spatial/ folder change depending on if a microscope image input was provided or not.
| The full resolution original image used for visualization corresponds to the microscope image (if one was provided) or to the CytAssist image. |
aligned_tissue_image.jpg: This image is generated when both CytAssist and microscope image inputs are provided. It captures the results of the image registration by merging the registered images in a checkerboard pattern with adjacent squares alternating between the two images. Successful image registration can be confirmed by assessing the continuity of tissue structures (e.g. tissue edges and interior tissue morphology). Note that dark background fluorescence microscope images are inverted to have a white background. An interactive version of these images is available in the Image panel of web_summary.html.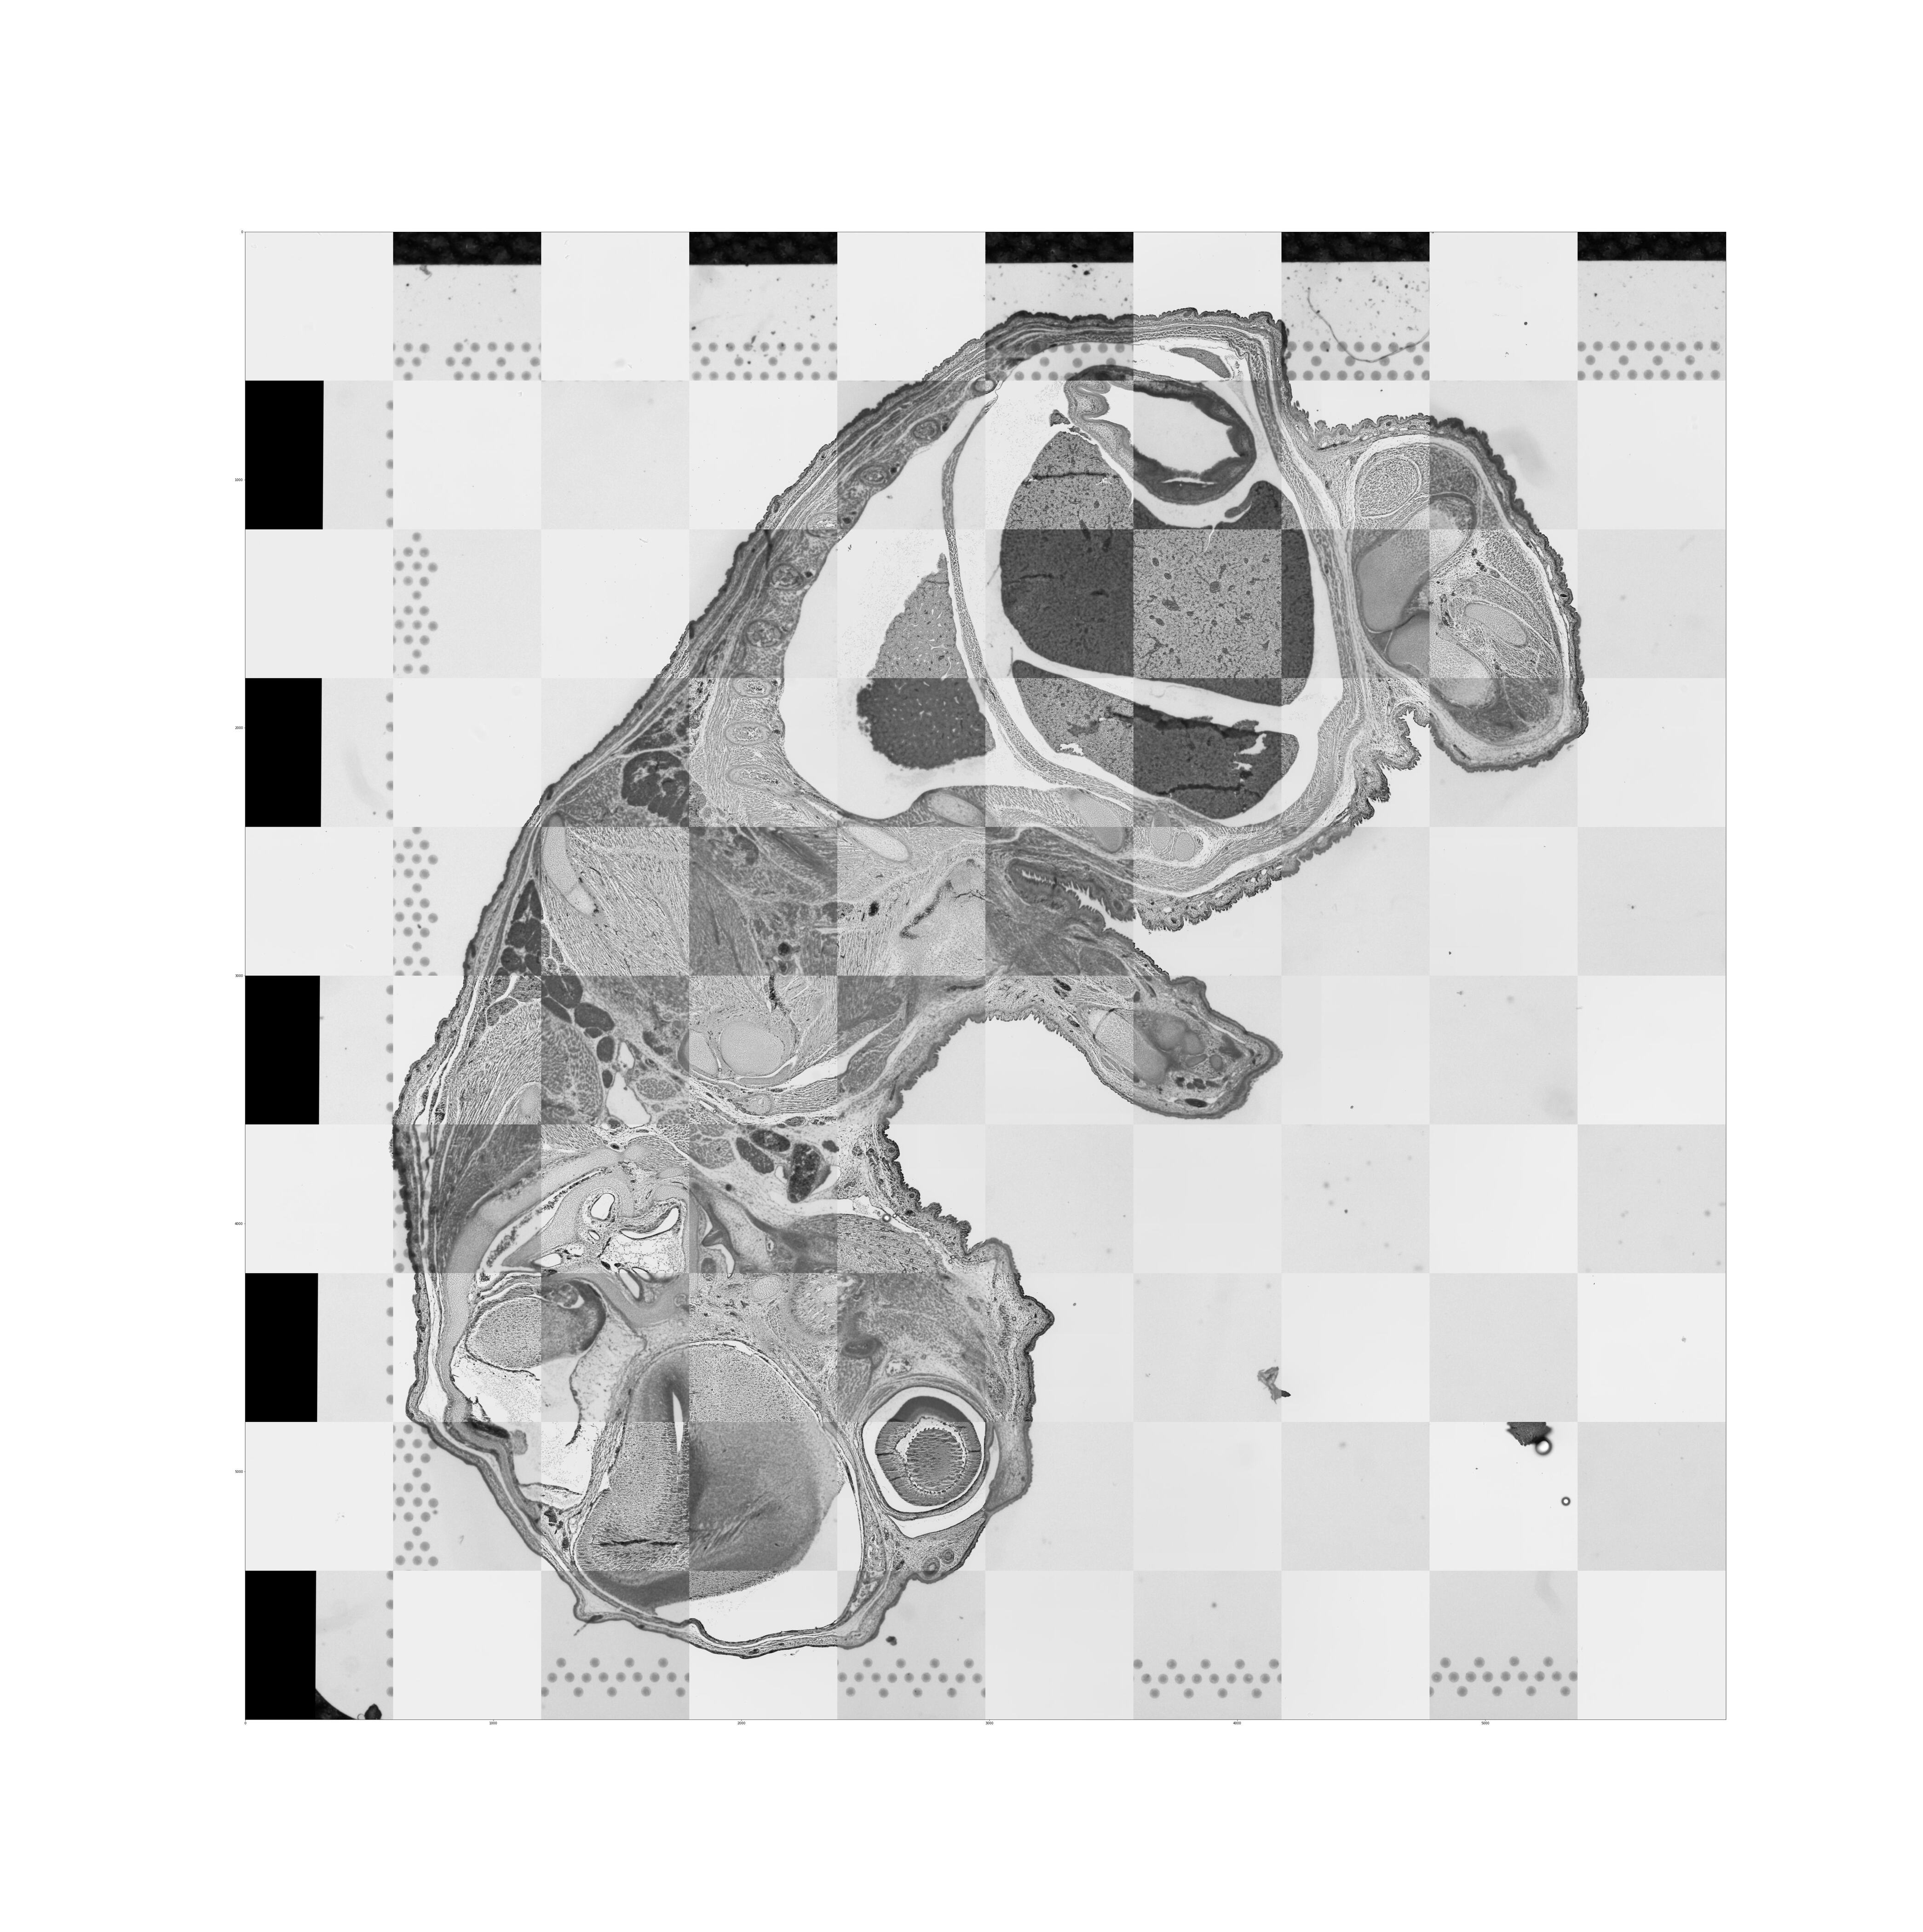
cytassist_image.tiff: Copy of the original CytAssist image input which is a eosin-stained brightfield image in TIFF format that contains the fiducial frame and has a fixed resolution of 3,000 pixels in both dimensions.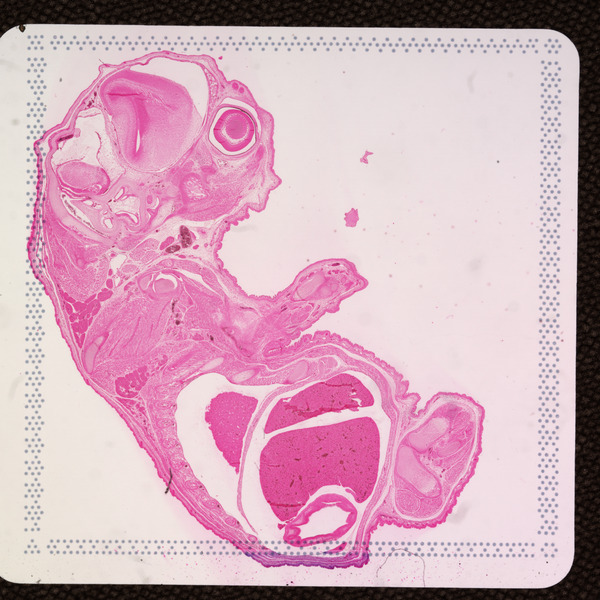
tissue_hires_image.png and tissue_lowres_image.png: These files are downsampled versions of the original, full-resolution image inputs provided by the user. Downsampling is accomplished by box filtering, which averages RGB values in patches of pixels in the full-resolution image to obtain an RGB value of one pixel in the downsampled image. Note that the downsampled images maintain the aspect ratio of the original image.
tissue_hires_image.png image has 2,000 pixels in its largest dimension. The tissue_lowres_image.png is set at 600 pixels. Both images corresponds to the CytAssist image.tissue_hires_image.png image corresponds to the microscope image and has 2,000 pixels in its largest dimension. The tissue_lowres_image.png is set at 600 pixels and also corresponds to the microscope image.aligned_fiducials.jpg: This image is always the CytAssist image with a dimension of 3,000 pixels in each dimension. Fiducial spots detected by the fiducial alignment algorithm are highlighted in red. The aligned_fiducials.jpeg contains information from the red channel since the fiducial frame is visible in it, and thus, the lack of tissue section contrast is expected. This file is useful to verify that fiducial alignment was successful.
detected_tissue_image.jpg: This image is always the CytAssist image with a dimension of 3,000 pixels in each dimension and shows the following:
scalefactors_json.json: This file contains the following fields:
regist_target_img_scalef: A scaling factor that converts pixel positions in the original, full-resolution micrsocope image to the downsampled version used in image registration.tissue_hires_scalef: A scaling factor that converts pixel positions in the original, full-resolution image to
pixel positions in tissue_hires_image.png.tissue_lowres_scalef: A scaling factor that converts pixel positions in the original, full-resolution image to
pixel positions in tissue_lowres_image.png.fiducial_diameter_fullres: The number of pixels that span the diameter of a fiducial spot in the original,
full-resolution image.spot_diameter_fullres: The number of pixels that span the diameter of a theoretical 65µm spot in the original, full-resolution image.$ cd /home/jdoe/runs/sampele345/outs/spatial $ cat scalefactors_json.json {"regist_target_img_scalef": 0.45004502, "tissue_hires_scalef": 0.150015, "tissue_lowres_scalef": 0.045004502, "fiducial_diameter_fullres": 146.4305300684766, "spot_diameter_fullres": 97.62035337898439}
Assuming a microscope image with dimensions of 13332 x 11757. The scalefactor is calculated as scalefactor=target sizemax(original image width, original image height)
For image registration, the microscope image is downscaled to 6000 pixels in the largest dimension, so the scalefactor will be regist_target_img_scalef=600013332≈0.4500450
The regist_target_img_scalef will have a value of 1 if the microscope image resolution is < 6000 pixels as the original image input will be used in image registration.
Since the largest dimension for the tissue_hires_image.png is 2000 pixels, the scalefactor will be tissue_hires_scalef=200013332≈0.150015
Similarly for the tissue_lowres_image.png, the largest dimension is 600 pixels and the scalefactor is tissue_lowres_scalef=60011757≈0.04500450
The spot diameter and fiducial diameter are estimated fractional pixels of the spot diameter in the original CytAssist image. It is estimated based on the registration solution and the known size of the spots and fiducial frame and does not use prior knowledge of the image pixel sizes. For this example, the estimated pixel size was calculated from the spot diameter for the full resolution image microns/pixels=6597.62035337898439≈0.66584475
tissue_positions.csv : This text file contains a table with rows that correspond to spots. From Space Ranger v2.0 onwards, this file, which was previously named tissue_positions_list.csv, is renamed and includes a header column. Excluding the header column, the file has 4,992 rows for Visium slides with a 6.5 mm Capture Area and 14,336 rows for Visium slides with an 11 mm Capture Area, which is the number of spots in the spatial array. Columns correspond to the
following fields:
barcode: The sequence of the barcode associated to the spot.in_tissue: Binary, indicating if the spot falls inside (1) or outside (0) of tissue.array_row: For Visium slide (6.5 mm Capture Area), the row coordinate of the spot in the array from 0 to 77. The array has 78 rows. For Visium slides (11 mm Capture Area), the row coordinate of the spot range from 0 to 127 as the array has 128 rows.array_col: The column coordinate of the spot in the array. In order to express the orange crate arrangement of the spots, for Visium slides (6.5 mm Capture Area) this column index uses even numbers from 0 to 126 for even rows, and odd numbers from 1 to 127 for odd
rows with each row (even or odd) resulting in 64 spots. For Visium slides (11 mm Capture Area) this column index uses even numbers from 0 to 222 for even rows, and odd numbers from 1 to 223 for odd
rows with each row (even or odd) resulting in 111 spots.pxl_row_in_fullres: The row pixel coordinate of the center of the spot in the full resolution image.pxl_col_in_fullres: The column pixel coordinate of the center of the spot in the full resolution image.$ cd /home/jdoe/runs/sample345/outs/spatial $ column -s, -t < tissue_positions.csv | head -n 10 barcode in_tissue array_row array_col pxl_row_in_fullres pxl_col_in_fullres GTCACTTCCTTCTAGA-1 0 0 0 1832 11971 CACGGTCTCCTTACGA-1 0 0 2 1832 11833 ATAGCTGCGGATAAGA-1 0 0 4 1832 11695 GTCAGTATGTCCGGCG-1 0 0 6 1832 11556 ATGTACCAGTTACTCG-1 0 0 8 1831 11418 ACGCTCAGTGCACCGT-1 0 0 10 1831 11280 TCACTAACGTATAGTT-1 0 0 12 1831 11142 CGGTTAGGCCTGGACG-1 0 0 14 1831 11004 GATATCACCAGCATGG-1 0 0 16 1831 10866
The spots are arranged using a orange crate packing to maximize packing density. Further explanation of this arrangement can be found in this article.
Note that the tissue_positions.csv contains the same information about the barcode whitelist and their slide coordinates as that contained in the barcodes folder that comes bundled with Space Ranger (spaceranger-x.y.z/lib/python/cellranger/barcodes where x.y.z represent the version number).
spatial_enrichment.csv: File in CSV format that contains table of Moran's I values for each feature when specific conditions are met:
The Moran's I value can be anywhere between -1 (perfectly dispersed) to 1 (perfectly enriched) but in biological samples values significantly below 0 are unexpected. A p-value is provided, as well as an adjusted p-value which is corrected using the Benjamini-Hochberg method for multiple comparisons.
From Space Ranger 2.0 onwards, the spatial_enrichment.csv file includes a Feature Type column the value for which is Gene Expression for single-library analysis.
# Gene Expression output
$ cd /home/jdoe/runs/sampele345/outs/spatial
$ column -s, -t < spatial_enrichment.csv | less -#2 -S

Feature ID          Feature Name    Feature Type     I                        P value                 Adjusted p value        Feature Counts in Spots Under Tissue  Median Normalized Average Counts  Barcodes Detected per Feature
ENSMUSG00000053310  Nrgn            Gene Expression  0.849230495400066        0.0                     0.0                     140702                                42.22927672729207                 2645
ENSMUSG00000070570  Slc17a7         Gene Expression  0.8228828454463434       0.0                     0.0                     49919                                 15.927820652112793                2435
ENSMUSG00000046447  Camk2n1         Gene Expression  0.8112121614961633       0.0                     0.0                     126518                                44.058800706638436                2698
ENSMUSG00000021948  Prkcd           Gene Expression  0.8093848987347875       0.0                     0.0                     11675                                 4.552770117948635                 1430
ENSMUSG00000061808  Ttr             Gene Expression  0.8088005899881938       0.0                     0.0                     348686                                76.73215387483816                 2674
ENSMUSG00000041607  Mbp             Gene Expression  0.7965984861055619       0.0                     0.0                     258769                                112.84701279639039                2700
ENSMUSG00000035383  Pmch            Gene Expression  0.7847484395395488       0.0                     0.0                     67814                                 17.005396313242215                1718
ENSMUSG00000024985  Tcf7l2          Gene Expression  0.7769492292430982       0.0                     0.0                     6546                                  2.564212465278306                 1282
ENSMUSG00000032532  Cck             Gene Expression  0.7605729556575779       0.0                     0.0                     67935                                 21.68537496001758                 2585
barcode_fluorescence_intensity.csv: File in CSV format that is generated for any input image specified by --darkimage. This file contains the statistics about the fluorescence intensity which is calculated for every spot and every fluorescence channel in the input image.
If the channels were given custom names in the Loupe manual alignment session that produced the alignment JSON file, then the CSV header will use the given channel names. By default, channels are named channel1, channel2, etc.This file can be used for secondary analysis in R/Python and can also be combined with the tissue_positions.csv file.
$ cd /home/jdoe/runs/sampele345/outs/spatial
$ column -s, -t < barcode_fluorescence_intensity.csv | less -#2 -S

barcode             in_tissue  channel1_mean       channel1_stdev      channel2_mean       channel2_stdev
CGAGGATATTCAGAGC-1  0          4254.328631875882   59.72596599289198   2370.7574047954868  23.587614594004506
TCTGGTACTAATGCGG-1  0          4242.12976022567    61.31391702047626   2348.9830747531737  22.960436841214605
AGGTGACCATGACGCT-1  0          4237.420310296192   62.954555749425516  2330.277856135402   18.66240280182469
CAGAGGTGTACGTAGC-1  0          4219.421720733428   60.38810661890725   2323.2045133991537  20.876943016829802
TAGCTAGAAGATACAT-1  0          4202.056417489422   62.2343918192054    2309.320169252468   18.883665883691563
AGCACTGACCGGCTTA-1  0          4185.466854724965   61.848950071485     2300.589562764457   17.98861741514344
ATAACCTAAGGCGTCA-1  0          4149.37658674189    58.4482514520289    2292.1255289139635  19.824612785901802
TAGAACCTCAGTTAGA-1  0          4156.802538787024   64.86614573399514   2298.7390691114247  19.838300058320733
CCGACATAAGTATCAA-1  0          4194.483779971792   62.19636612986138   2313.277856135402   20.56714424032058
GACTACCAACTGGTCC-1  0          4204.746121297602   62.91221526144468   2328.5232722143865  54.82377031240396