Cell Ranger5.0, printed on 03/30/2025
The cellranger vdj pipeline outputs a summary HTML file containing summary metrics and automated secondary analysis results.
The run summary can be viewed by clicking "Summary" in the top left corner. The summary metrics describe sequencing quality and various characteristics of the detected cells.
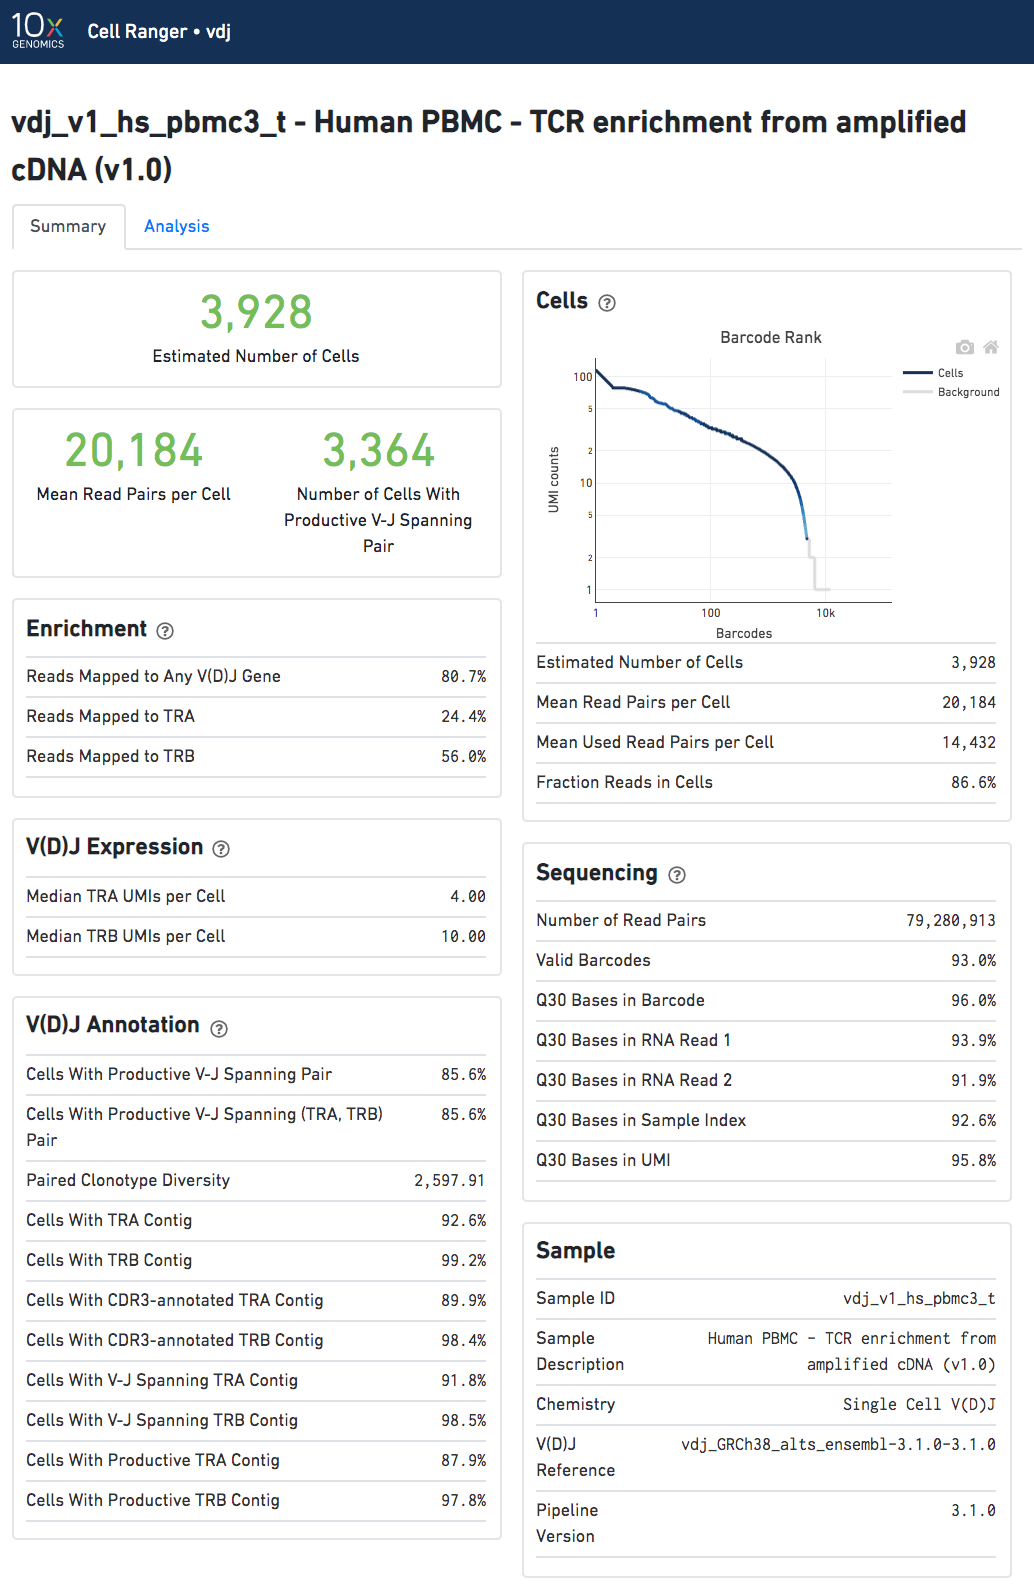
The number of cells detected, the mean read pairs per cell, and the number of V-J spanning productive paired cells are prominently displayed near the top of the page.
Click the '?' in the upper right corner of each dashboard for more information on each metric.
The Barcode Rank Plot under the "Cells" dashboard shows the count of filtered UMIs mapped to each barcode. A barcode must have a contig that aligns to a V segment to be identified as a targeted cell. (In the denovo case, the only requirement is a contig's presence.) There must also be at least three filtered UMIs with at least two read pairs each. It is possible that a barcode with at least as many filtered UMIs as another cell-associated barcode is not identified as a targeted cell. The color of the graph is based on the local density of cell-associated barcodes.
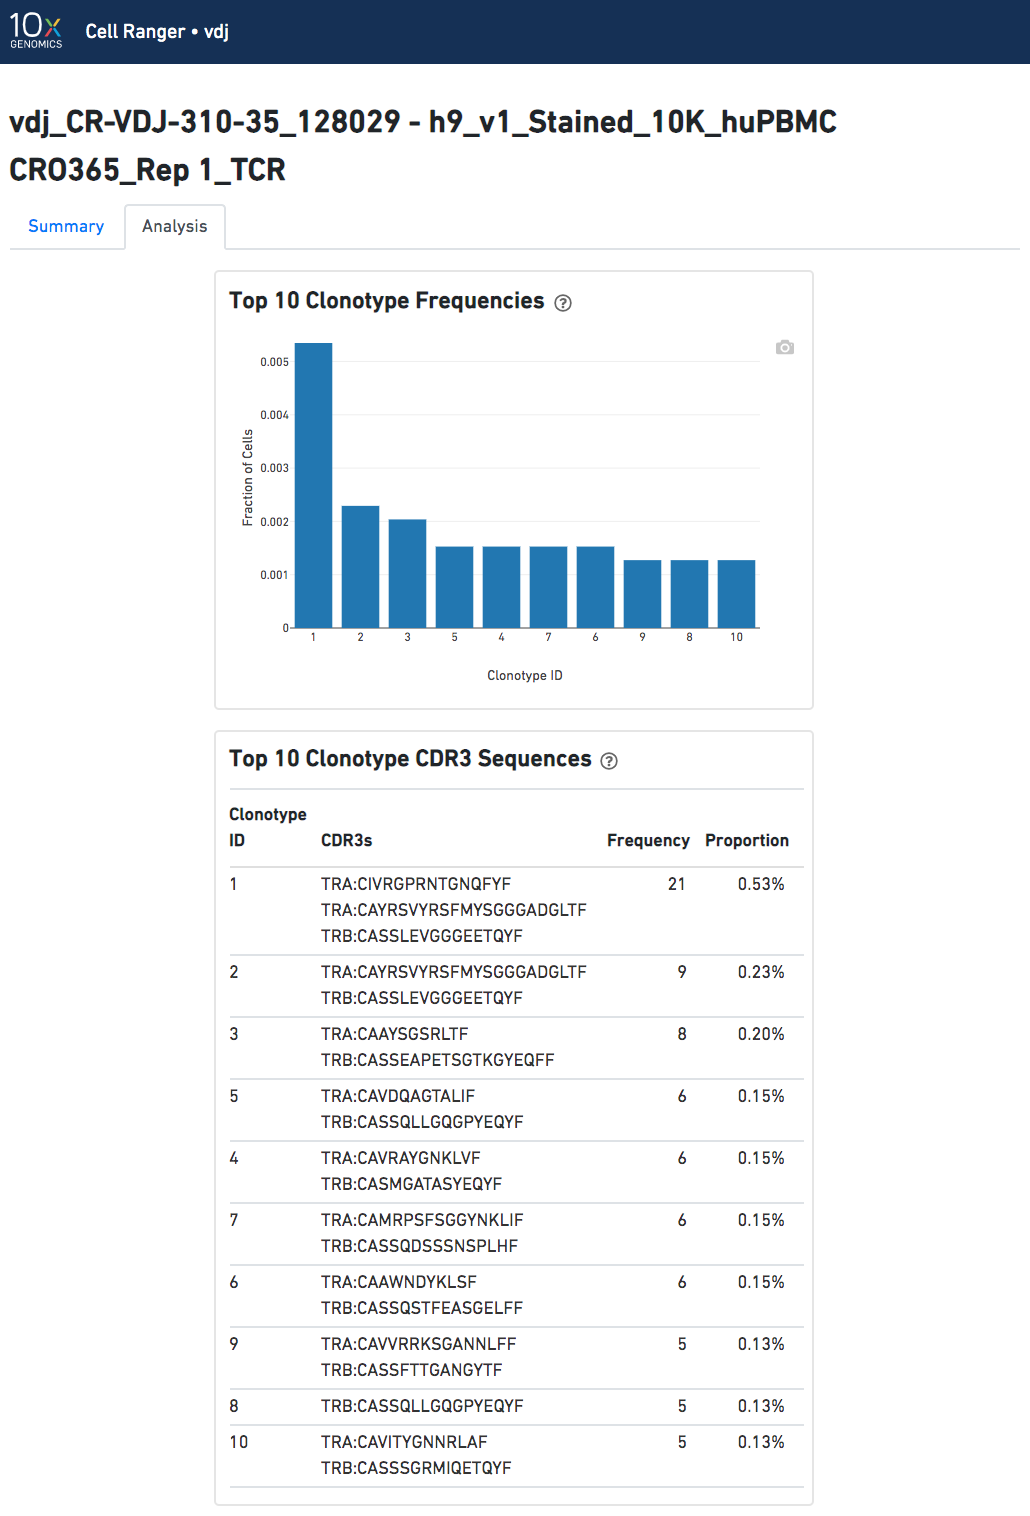
The automated secondary analysis results can be viewed by clicking "Analysis" in the top left corner. The secondary analysis provides the following:
Note that because clonotypes are defined by productive sequences only, there are additional sequences that may not be displayed in the web summary. A more complete set of sequences associated with each cell can be found in the filtered contig files.