Cell Ranger7.0, printed on 02/01/2025
The cellranger aggr pipeline outputs an interactive summary HTML file named web_summary.html that contains summary metrics and automated secondary analysis results. If an issue was detected during the pipeline run, an alert appears on this page. More information about alerts is provided in the Cell Ranger troubleshooting documentation.
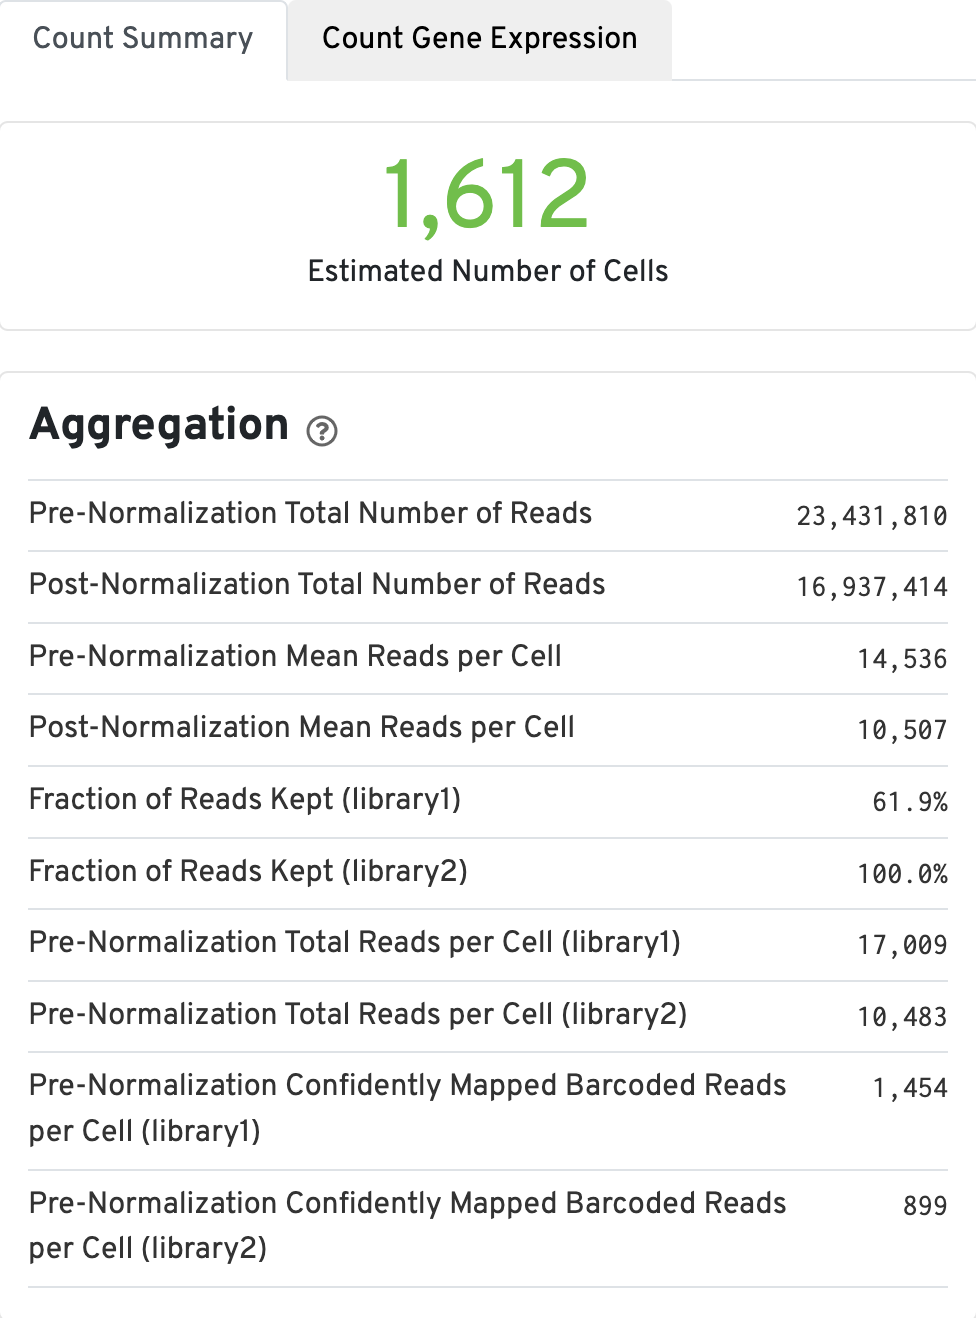
Here is an example aggr web summary from a dataset consisting of two Gene Expression and CRISPR Guide Capture libraries run on different GEM wells. The aggr web summary consists of two tabs:
The Count Summary tab contains the aggregation metrics, including the estimated number of cells. Click the ? icons next to each section title to display information about metrics. The first box called Aggregation, displays Gene Expression aggregation metics:
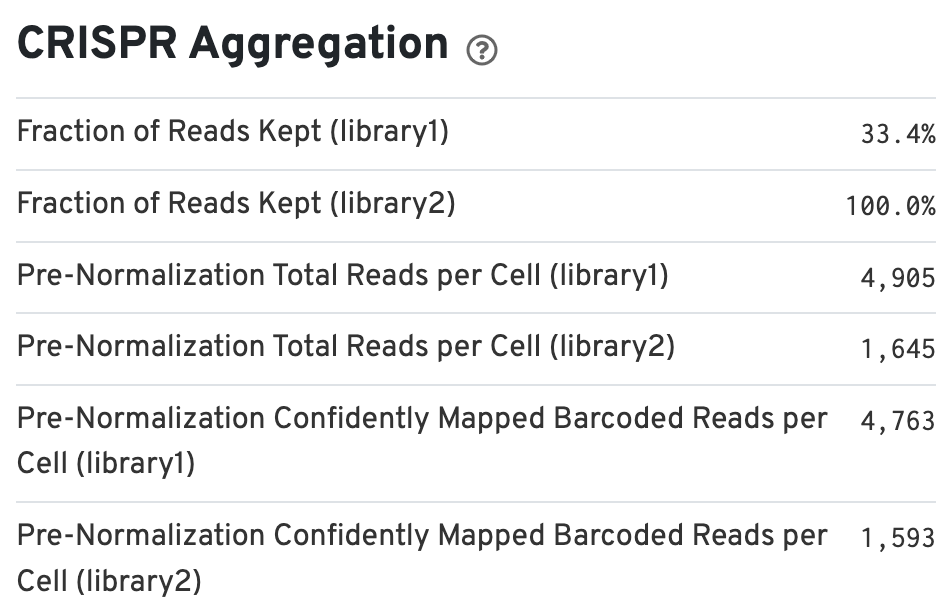
If the experimental design includes CRISPR Guide Capture libraries, the web summary includes a section called CRISPR Aggregation (bottom left):
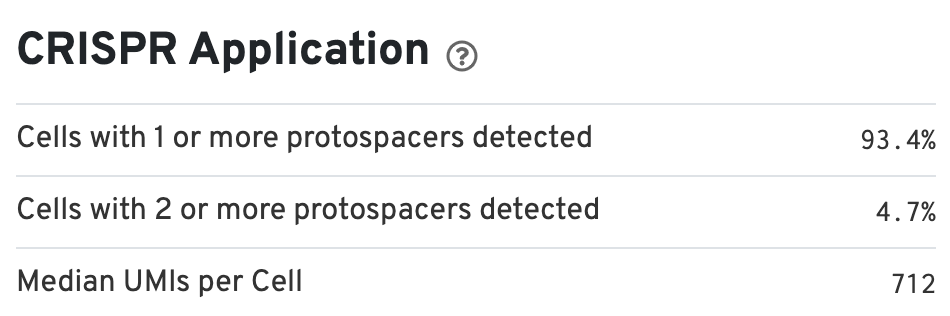
There is also a CRISPR Applications section (bottom right) that provides information about the percentage of cells containing one or more protospacers:
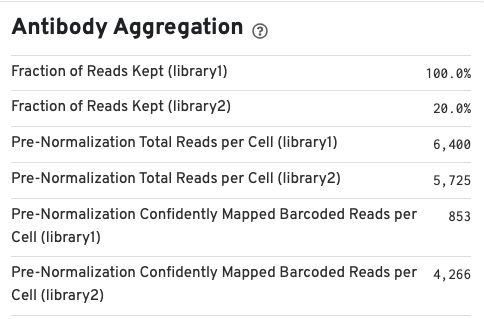
If your run included an Antibody Capture (cell surface protein) library, Antibody Aggregation metrics are available below the Gene Expression aggregation metrics:
The Count Summary tab also provides a t-SNE projections plot displaying cells colored by library.
The Cell and Sample panels on the right-hand side are similar to the corresponding panels in the web_summary.html produced by the cellranger count pipeline.
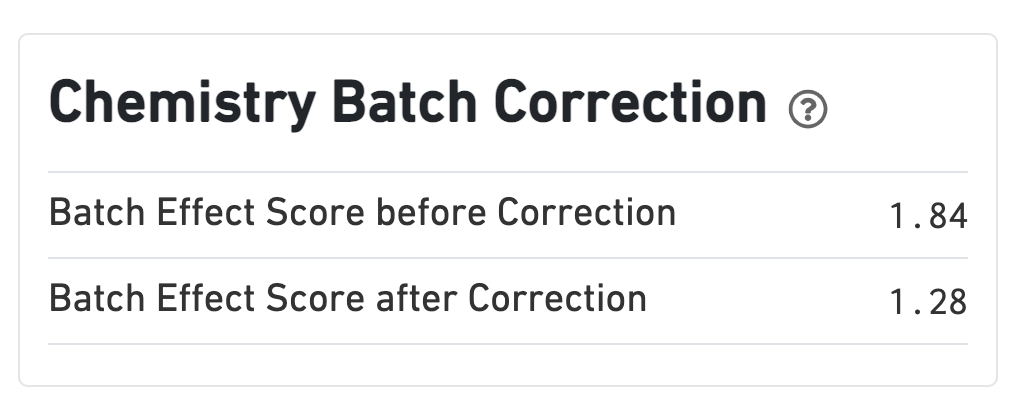
If chemistry batch correction was specified (batch column in input aggregation CSV file), there will be an additional Chemistry Batch Correction section with batch effect scores before and after correction. Batch effect scores indicate whether there is a batch effect (greater than one) or no batch effect (closer to one) (read more on the algorithm page).
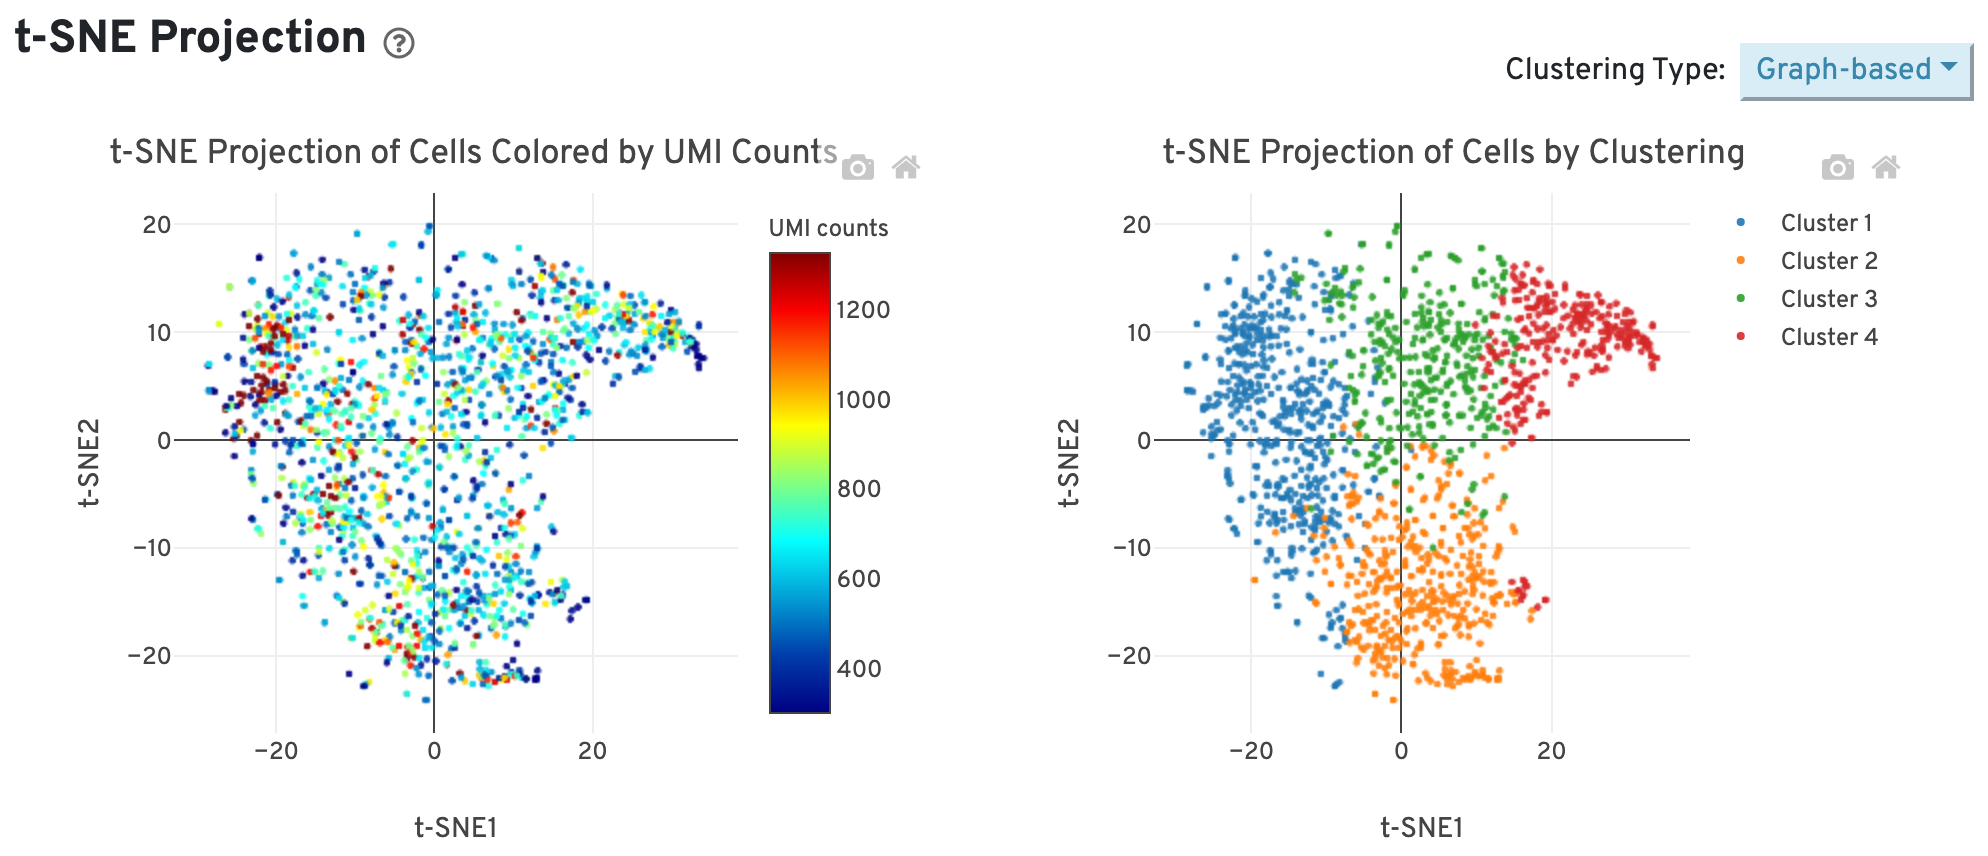
The t-SNE Projection section shows the data reduced to two dimensions, colored by UMI count or clustering (Graph-based by default). It is a good starting point to explore structure in the data.
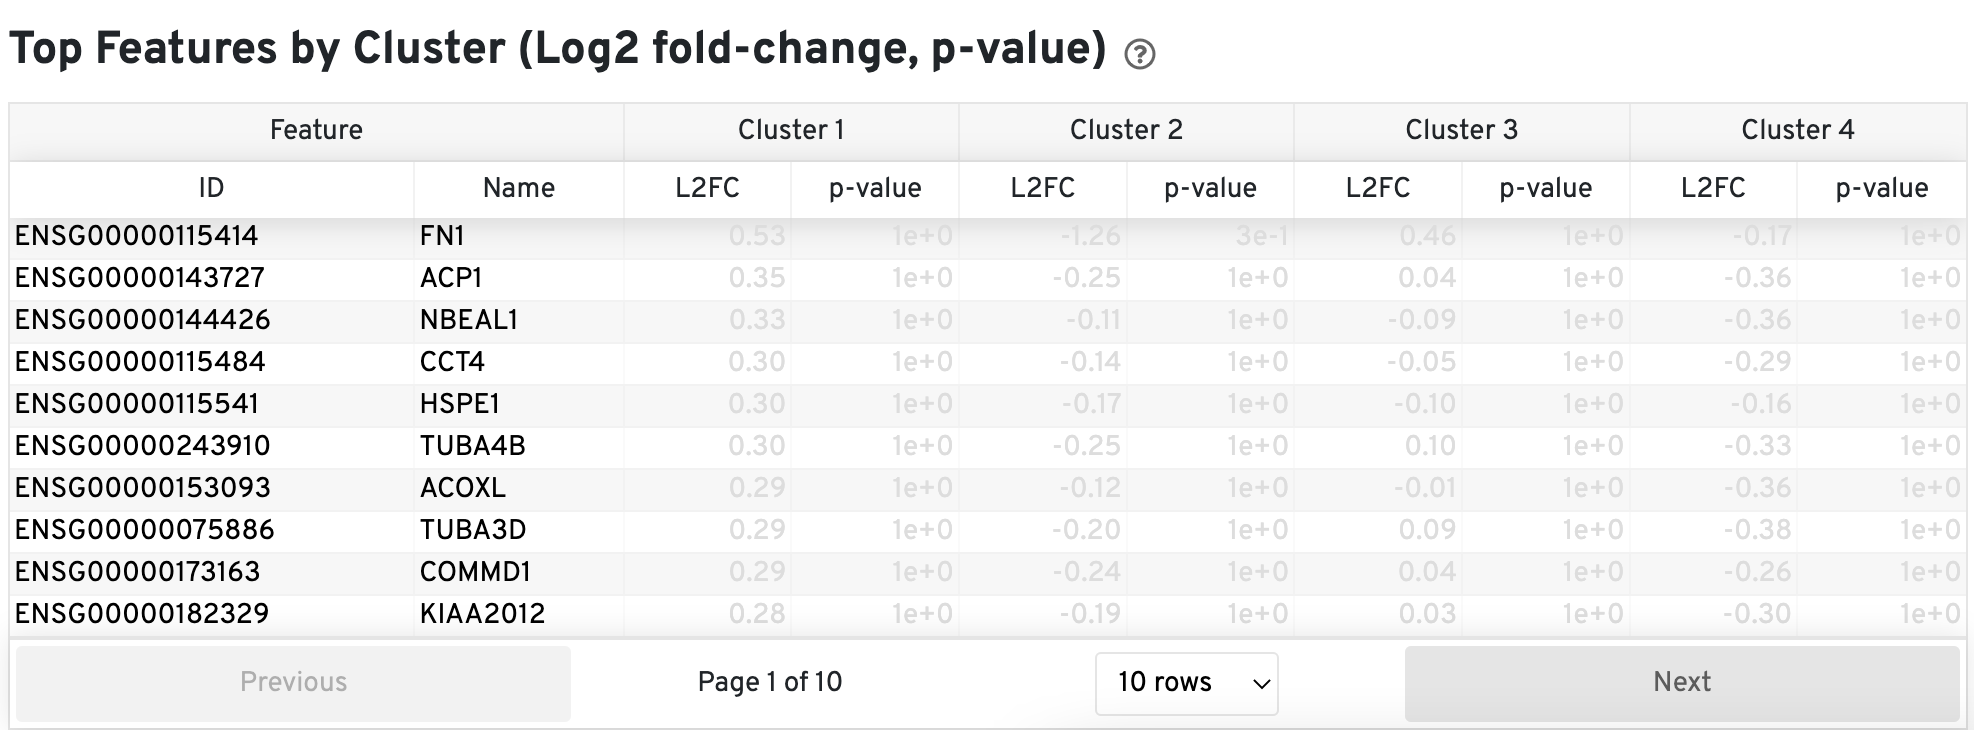
The Top Features by Cluster (Log2 fold-change, p-value) section summarizes the results of differential gene expression analysis to help users find, for each cluster, features that are more highly expressed in that cluster relative to the rest of the sample.