Cell Ranger6.1, printed on 03/11/2025
This page describes the output file structure from the cellranger multi subcommand specifically for 3' Cell Multiplexing data. This subcommand was introduced in Cell Ranger 5.0 for joint analysis of 5' gene expression and V(D)J (GEX + VDJ) data, and in Cell Ranger 6.0 for 3' Cell Multiplexing data.
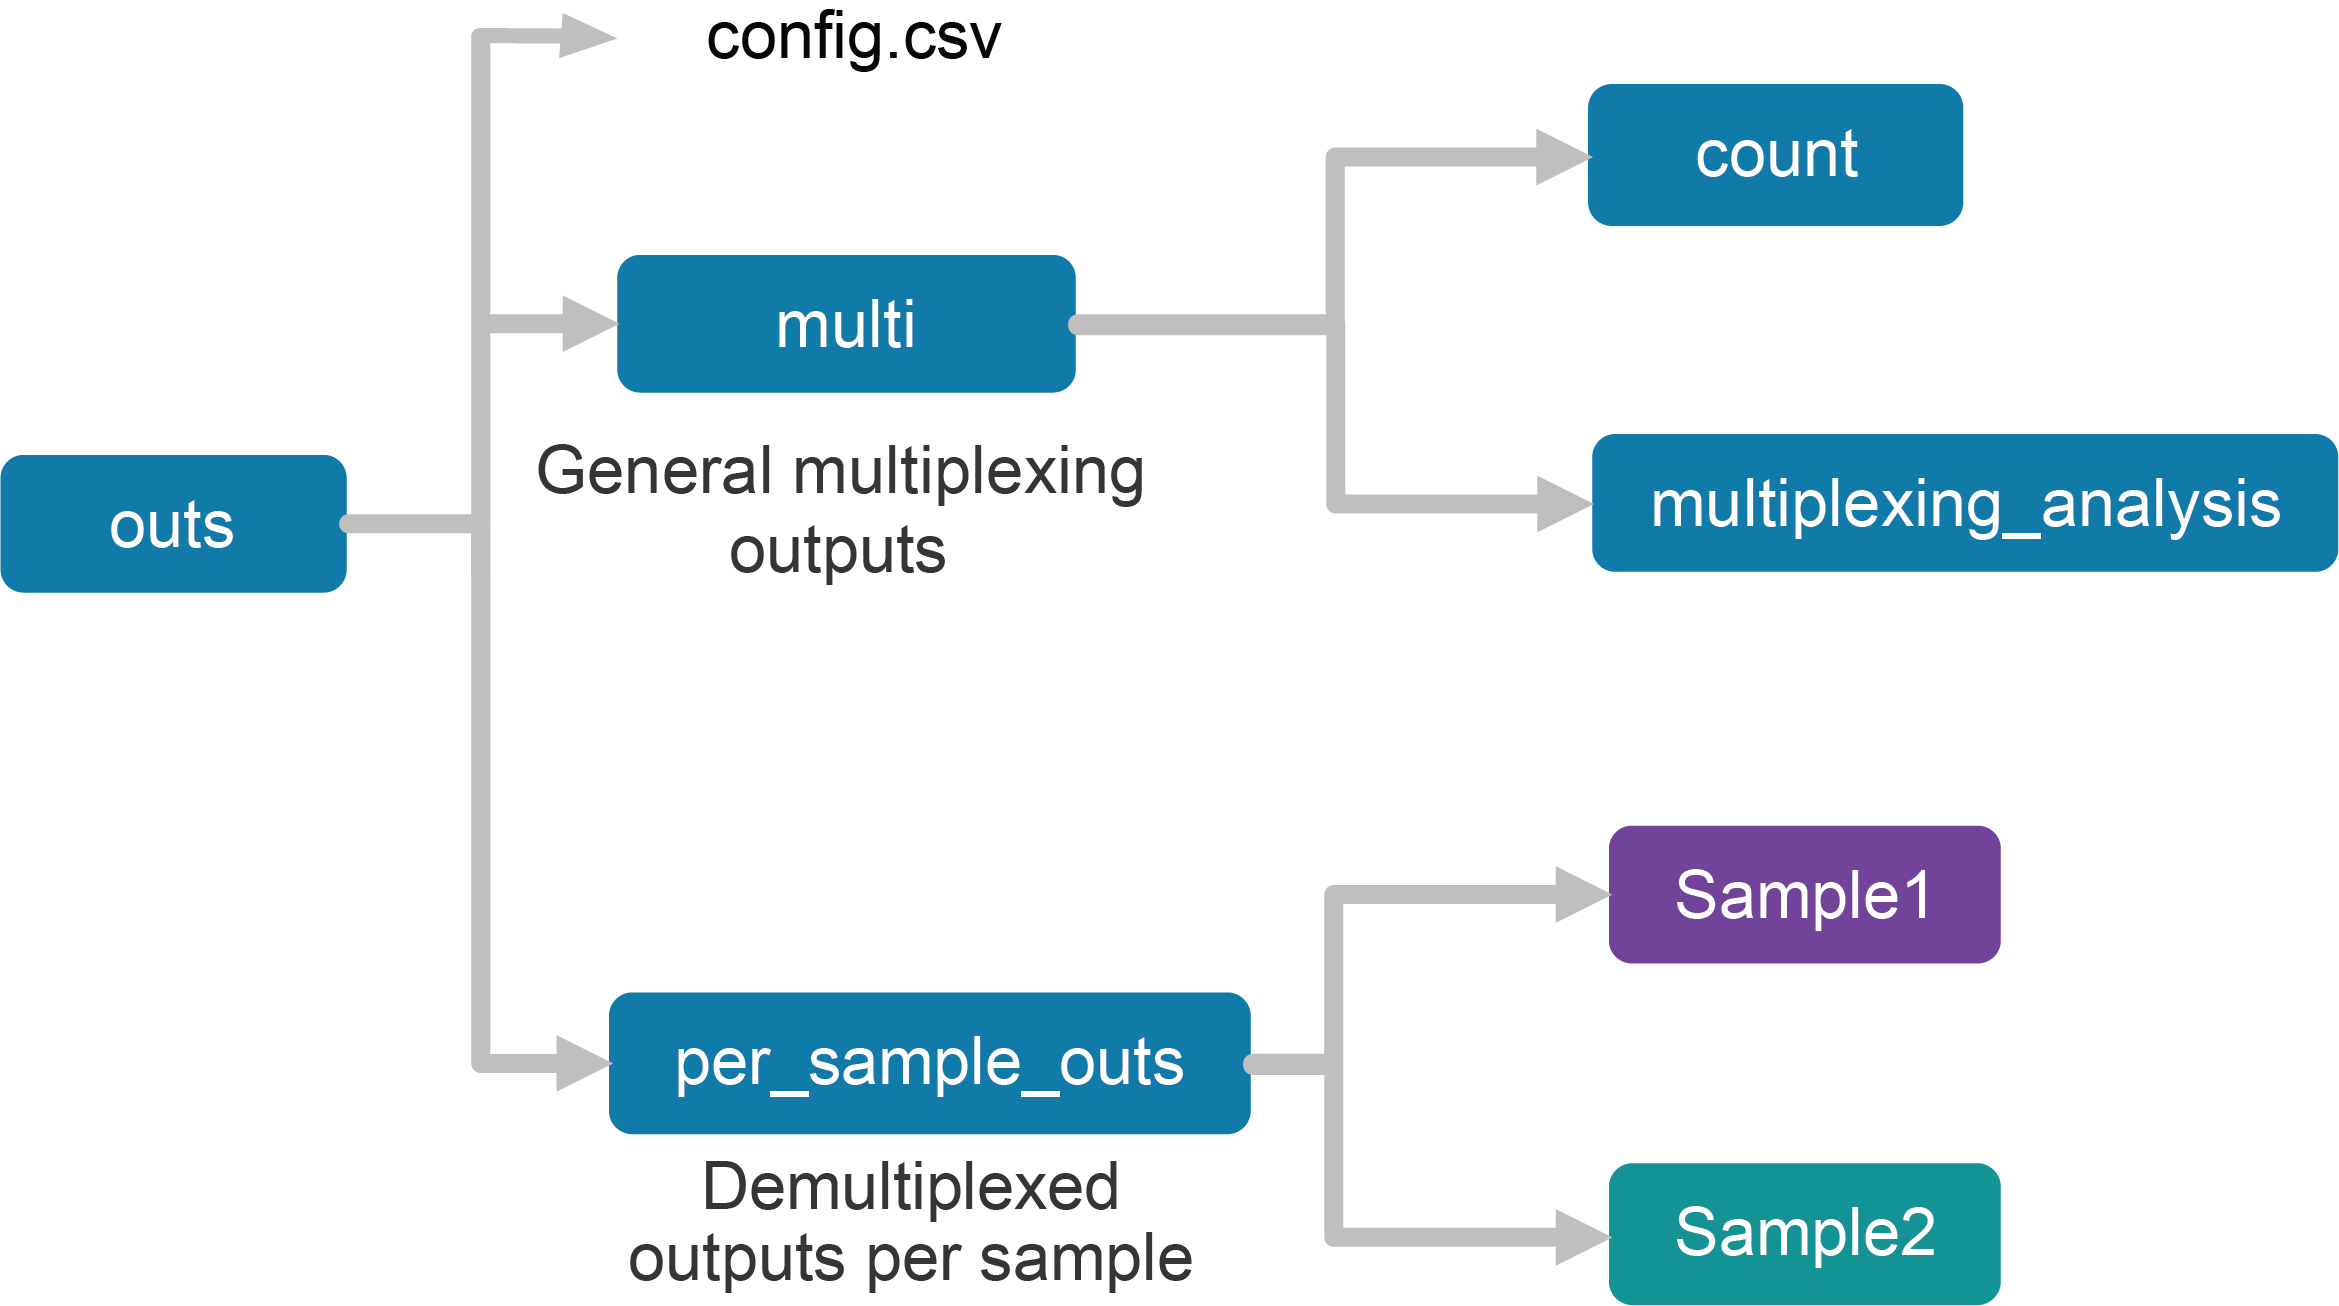
Upon completion, the cellranger multi subcommand will produce an outs/ directory with the following structure:
Using the tree Linux command, the file structure looks like this:
├── config.csv
├── multi
│   ├── count
│   └── multiplexing_analysis
└── per_sample_outs
    ├── Sample1
    └── Sample2
The first section of the outputs contains the config.csv file, a duplicate of the input config CSV file. The files in the multi folder are generic to the entire Cell Multiplexing experiment, while the files in the per_sample_outs directory have been demultiplexed to single samples.
Within the multi directory, there are count and multiplexing_analysis directories:
└─ multi
   ├── count
   │   ├── feature_reference.csv
   │   ├── raw_cloupe.cloupe
   │   ├── raw_feature_bc_matrix
   │   │   ├── barcodes.tsv.gz
   │   │   ├── features.tsv.gz
   │   │   └── matrix.mtx.gz
   │   ├── raw_feature_bc_matrix.h5
   │   ├── raw_molecule_info.h5
   │   ├── unassigned_alignments.bam
   │   └── unassigned_alignments.bam.bai
   └── multiplexing_analysis
       ├── assignment_confidence_table.csv
       ├── cells_per_tag.json
       ├── tag_calls_per_cell.csv
       └── tag_calls_summary.csv
The count directory contains raw files that include cells and background data:
| Output File | Description |
|---|---|
feature_reference.csv |
Feature reference (contains both CMO and Feature Barcode) used for this sample |
raw_cloupe.cloupe |
A Loupe-readable file containing all cell-associated barcodes in the experiment. This cloupe file also contains UMI counts for all tags (prior to tag assignments), which could be useful for troubleshooting Cell Multiplexing library issues. |
raw_feature_bc_matrix |
A matrix of UMI counts per (feature, barcode) pair, in MEX format. This matrix contains every barcode from the fixed list of known good barcode sequences that has at least one read. This includes background and cell-associated barcodes. |
raw_feature_bc_matrix.h5 |
A matrix of UMI counts per (feature, barcode) pair, in H5 format. This matrix contains every barcode from the fixed list of known good barcode sequences that has at least one read. This includes background and cell-associated barcodes. |
raw_molecule_info.h5 |
Information about all molecules in the experiment. This file includes background and cell-associated barcodes, and cannot be used as input for cellranger aggr pipeline. |
unassigned_alignments.bam |
Alignments from barcodes not assigned to any sample. |
unassigned_alignments.bam.bai |
Alignments from barcodes not assigned to any sample (index). |
The multiplexing_analysis directory contains:
| Output File | Description |
|---|---|
assignment_confidence_table.csv |
A table that contains all information from the tag assignment algorithm for each cell-associated barcode, in CSV format. More details below. |
cells_per_tag.json |
Lists the cell-associated barcodes that were assigned a given tag, for each tag, in JSON format. |
tag_calls_summary.csv |
A table that summarizes the multiplexing results, including the number of cells assigned no tag, one tag, and more than one tag, in CSV format. More details below. |
tag_calls_per_cell.csv |
For each cell-associated barcode assigned a tag, this table summarizes the tags assigned and the UMI counts per tag, in CSV format. More details below. |
The assignment_confidence_table.csv table provides a summary of all the information from the tag-assignment algorithm for each cell-associated barcode, including the probability that a given barcode belongs to a given state. The user may modify the confidence threshold for assigning tags to barcodes on their own in a data-science environment like Python or R to enable further downstream analysis.
Row,CMO301,CMO302,Barcodes,Multiplet,Blanks,Assignment,Assignment_Probability
1,1.7492220542497986e-10,0.999994,AAACCCAAGATTCGAA-1,5.0927025002342424e-06,7.880223262070917e-07,CMO302,0.999994
2,0.9936742,1.95217130055954e-09,AAACCCAAGCAACAGC-1,0.0063257301365501695,7.021953108383088e-09,CMO301,0.9936742
13,2.3960595409731583e-08,0.0064328,AAACCCATCATTCGGA-1,0.993567110839031,3.554702514325053e-12,Multiplet,0.9935671
35,2.74875783854256e-12,0.00021014,AAACGCTGTCCAAGAG-1,1.3255406427923249e-17,0.9997898543154408,Blanks,0.999789
39,1.4235671575612072e-05,0.55488715,AAACGCTGTTCTTCAT-1,4.071660981663313e-07,0.44509820,Unassigned,0.55488715
Column descriptions:
The tag_calls_summary.csv summarizes multiplexing results by providing statistics about categories including the number of cells assigned no tag, one tag, more than one tag, etc. The category No tag assigned includes both cells that were considered Blanks and cells considered Unassigned.
Category,num_cells,pct_cells,median_umis,stddev_umis
No tag molecules,0,0.0,None,None
No tag assigned,386,2.9,None,None
1 tag assigned,12465,93.6,None,None
More than 1 tag assigned,472,3.5,None,None
CMO301,6437,48.3,3442.0,7988.3
CMO302,6028,45.2,3515.5,5167.2
CMO301|CMO302,472,3.5,12414.0,9696.0
Column descriptions:
The tag_calls_per_cell.csv file contains tag calls per cell, one line for each barcode.
cell_barcode,num_features,feature_call,num_umis
AAACCCAAGCAACAGC-1,1,CMO301,16778
AAACCCAAGCTCGTGC-1,1,CMO301,1735
AAACCCACATGACTGT-1,1,CMO301,1625
AAACCCAGTCCACAGC-1,1,CMO301,19323
AAACCCAGTCGCGGTT-1,1,CMO301,1678
Column descriptions:
The per_sample_outs directory contains sample-level files with data from cells only (background data filtered out):
├── count
│   ├── analysis
│   │   ├── clustering
│   │   ├── diffexp
│   │   ├── pca
│   │   ├── tsne
│   │   └── umap
│   ├── cloupe.cloupe
│   ├── feature_reference.csv
│   ├── sample_alignments.bam
│   ├── sample_alignments.bam.bai
│   ├── sample_barcodes.csv
│   ├── sample_feature_bc_matrix
│   │   ├── barcodes.tsv.gz
│   │   ├── features.tsv.gz
│   │   └── matrix.mtx.gz
│   ├── sample_feature_bc_matrix.h5
│   └── sample_molecule_info.h5
├── metrics_summary.csv
└── web_summary.html
Note that the sample_feature_bc_matrix directory and sample_feature_bc_matrix.h5 file are similar to the filtered_feature_bc_matrix and filtered_feature_bc_matrix.h5, respectively, generated by cellranger count. For more information about these files, see the Feature Barcode matrices section. These are the key files that contain expression levels, which can be used for downstream analysis and data interpretation.
|
The analysis/ directory contains files with the results of: graph-based clusters and K-means clustering from K=2-10; differential expression analysis between clusters; and PCA, t-SNE, and UMAP dimensionality reduction.
The remaining outputs are essentially the same as from cellranger count, and are described in the Gene Expression Outputs section. Learn more about the multi web summary file here.