Cell Ranger4.0, printed on 04/14/2025
Exciting research is being done using the 10x Genomics Single Cell Gene Expression solution. This guide outlines how to perform the analysis, and what results 10x assays and software produce using data from a recent Nature publication “Single-cell transcriptomes of the regenerating intestine reveal a revival stem cell” (2019; doi: 10.1038/s41586-019-1154-y).
The Nature publication used an older version of Cell Ranger (2.0.0) for initial analysis. The raw data generated by Cell Ranger were loaded into third-party tools for secondary analysis. However, in this guide, the new version of Cell Ranger (3.1.0) and Loupe Cell Browser (3.1.1) is used to perform initial and secondary analysis. Using these tools with default settings, some major results reported in the Nature publication were reproduced.
Intestinal tissue can repair itself after an injury such as irradiation. However, the molecular mechanisms that underlie the process are not fully understood. The LGR5+ crypt base columnar cells are thought to drive intestinal epithelium regeneration, but these cells are lost after injury, while regeneration still takes place.
To identify the cells responsible for the regeneration process, a group of researchers in Toronto used 10x Genomics Single Cell 3’ Gene Expression solution to profile mouse intestine cells, with and without irradiation.
This guide focuses on two samples, crypts (enriched from the whole epithelia) from normal and irradiated mice. See the figure below.
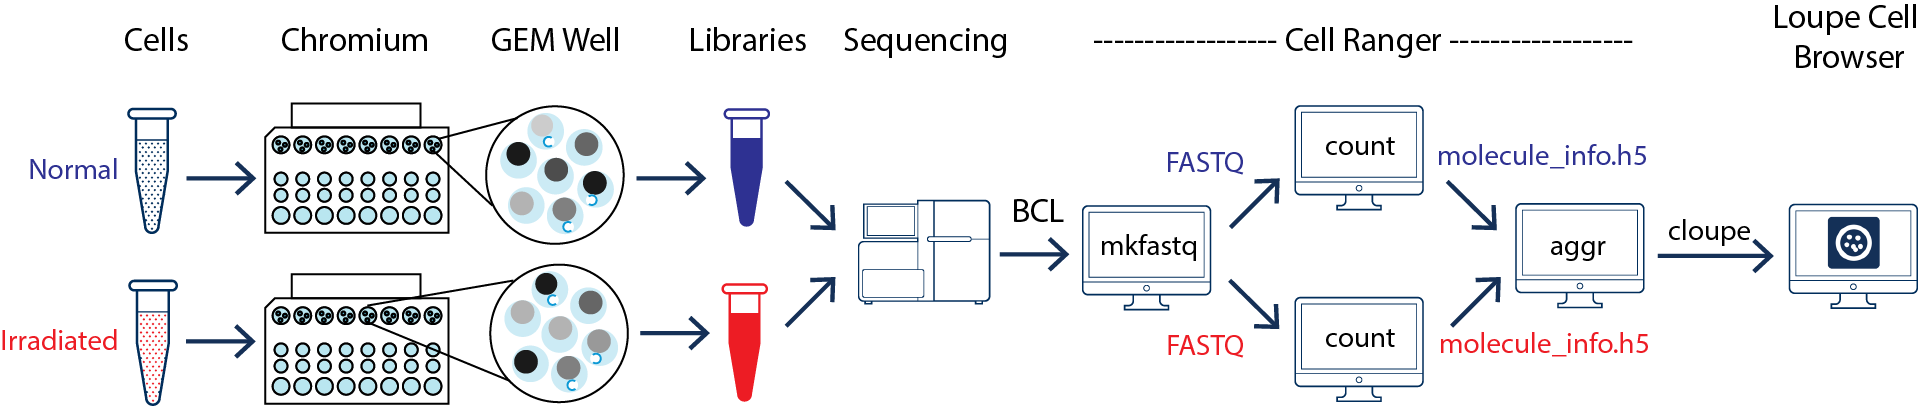
As illustrated above, the two samples were processed through two GEM wells on the 10x Chromium™ Controller. The two libraries were then prepared following the user guide and sequenced on a recommended Illumina sequencer.
The sequencer generates raw data in the base call (BCL) format, which contains sequencing data of all the libraries in the sequencing run. The cellranger mkfastq pipeline can be used to demultiplex BCL files into FASTQ files of individual library. If the sequencing provider already completed this step, the FASTQ files of each library can be directly used for data analysis.
For this guide, the Barcoded BAM files for the two samples was downloaded from the Data access tab of the Run Browser from these two Sequence Read Archive (SRA) pages: SRR7611046 and SRR7611048. The Barcoded BAM files are covered to FASTQ files with the 10x Genomics bamtofastq tool as below:
bamtofastq C05.bam.1 normal
bamtofastq C07.bam.1 irradiated
After successfully completing the bamtofastq, both normal and irradiated folders contain two subfolders with FASTQ files in them.
Once the FASTQ files for each samples is generated, the data analysis begins. The cellranger count pipeline can perform read alignment, UMI counting, and secondary analysis (dimensionality reduction, clustering, and visualization) for a single sample. The two samples shown in the figure above require running cellranger count for each sample separately.
Given that these are mouse samples, the pre-built mouse reference is used. After determining the path to the reference folder and FASTQ files, run the cellranger count for the normal sample:
cd ./normal/
cellranger count --id=normal \
                 --transcriptome=/path/to/refdata-cellranger-mm10-3.0.0 \
                 --fastqs=./indepth_C05_MissingLibrary_1_HL5G3BBXX,./indepth_C05_MissingLibrary_1_HNNWNBBXX
Similarly, run the cellranger count for the irradiated sample in a separate command:
cd ./irradiated/
cellranger count --id=irradiated \
                 --transcriptome=/path/to/refdata-cellranger-mm10-3.0.0 \
                 --fastqs=./indepth_C07_MissingLibrary_1_HL5G3BBXX,./indepth_C07_MissingLibrary_1_HNNWNBBXX
After successfully completing the pipeline, find the outs/ directory for each run to review many useful result files. Start by checking the results using the following files:
For the example data here, both normal and irradiated samples showed no alerts. To identify the cells that contribute to the intestine regeneration, comparison between the normal versus irradiated cells need to be performed.
To compare two or more samples, use the cellranger aggr pipeline to aggregate outputs from multiple runs of cellranger count, normalize runs to the same effective sequencing depth, and then perform secondary analysis on the combined data.
In this example, there are two samples, so cellranger aggr pipeline requires a libraries.csv file that looks like this:
library_id,molecule_h5
normal,/path/to/count/normal/outs/molecule_info.h5
irradiated,/path/to/count/irradiated/outs/molecule_info.h5
Here is an example of the cellranger aggr command:
cellranger aggr --id=aggr --csv=libraries.csv
After the pipeline successfully completes, another set of results with combined data from the two samples is produced. Next, the cloupe.cloupe file can be used to visualize and explore the results.
The combined data from two samples can now be used for analysis using the Loupe Browser. Some key functions of the Loupe Browser are presented in this guide. For more detailed information, see the tutorial here.
In order to identify the cell type contributing to intestine regeneration, the major known cell types need to be first located in the results. This step heavily relies on understanding the gene markers in the tissue of interest. There are also third-party computational tools developed for automated identification of cell types. For this guide, the typical method is used, which involves utilizing the unsupervised clustering to identify the signature genes and associate them to known cell types based on literature.
First, review the clustering results. The graph-based clustering results from the combined normal and irradiated samples showed 22 clusters. See the screenshot below. This is not exactly the same as reported in the publication, mainly due to different software and versions used by the authors, versus the software used in this guide. Here the focus is on the default results generated by Cell Ranger (3.1.0) pipelines. Nevertheless, in the following sections of this guide, some major results reported in the publication were reproduced.
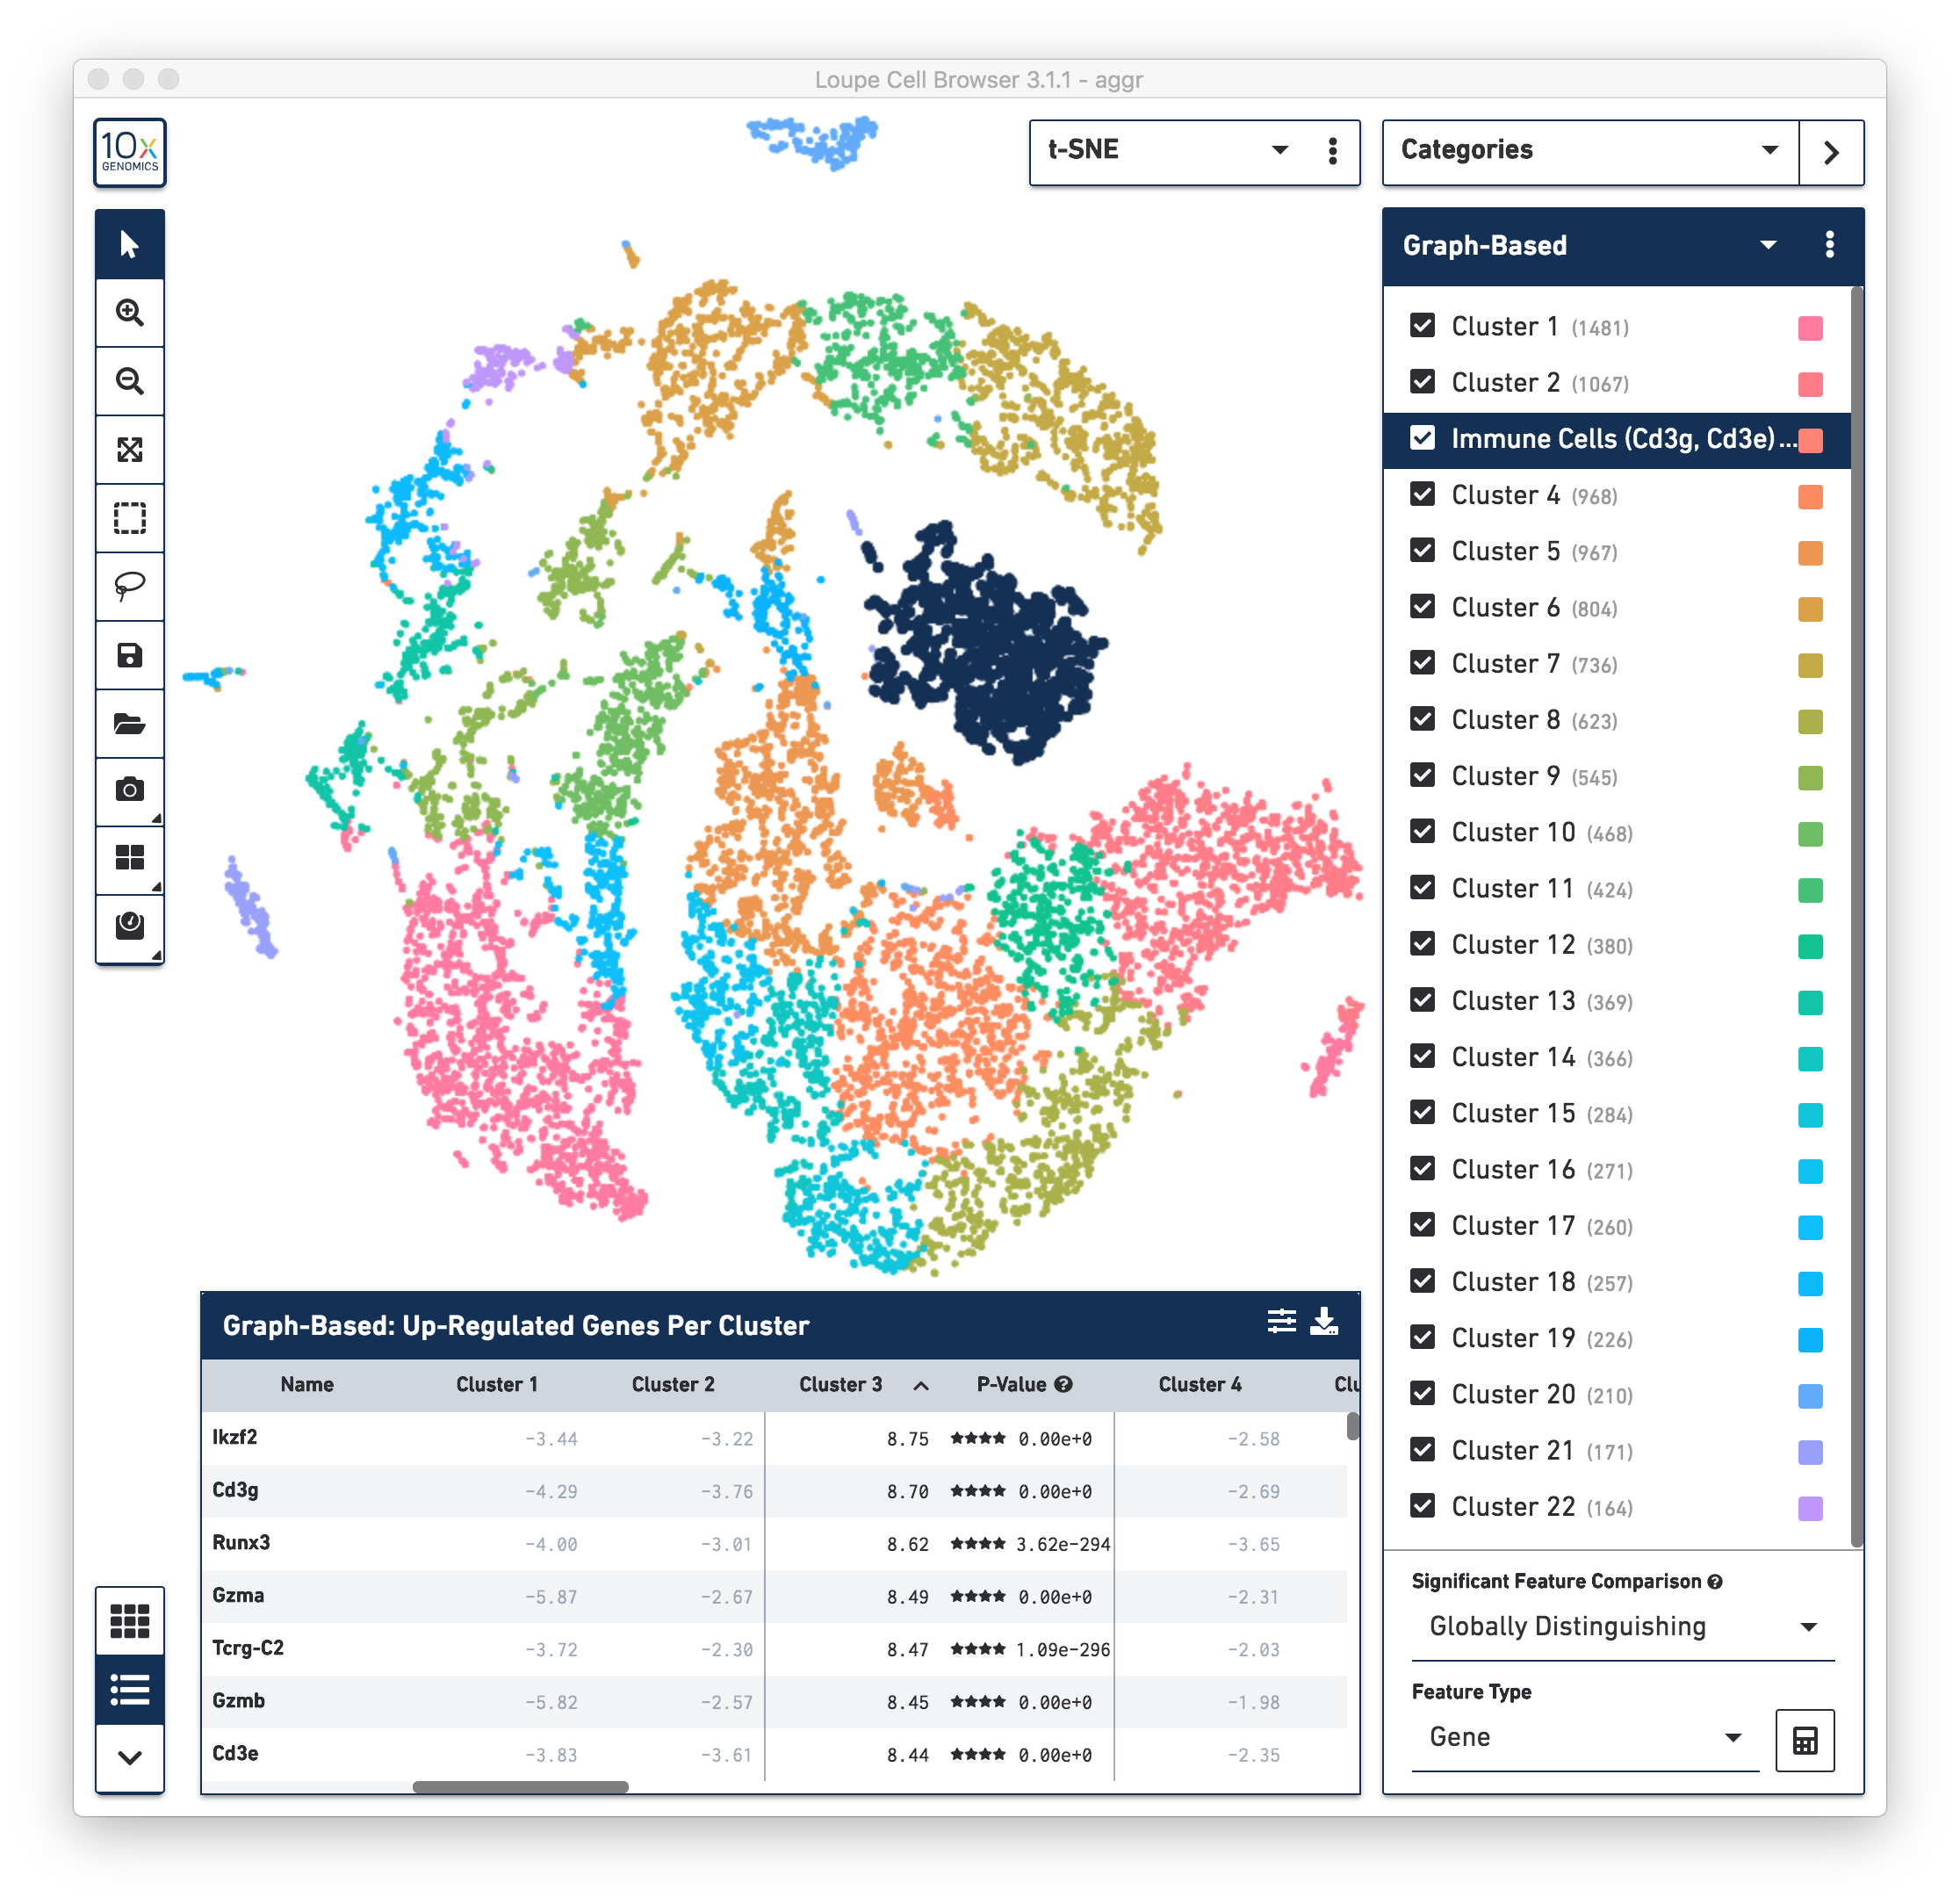
To identify the cell types of each cluster, use the differential expressed genes showing in the data panel on the bottom. For example, in the above screenshot, see the top up-regulated genes in Cluster 3. Some of the genes, such as Cd3g and Cd3e, are known immune cell markers, indicate that the cells in Cluster 3 are immune cells. Rename the Cluster 3 to “Immune Cells (Cd3g, Cd3e)”.
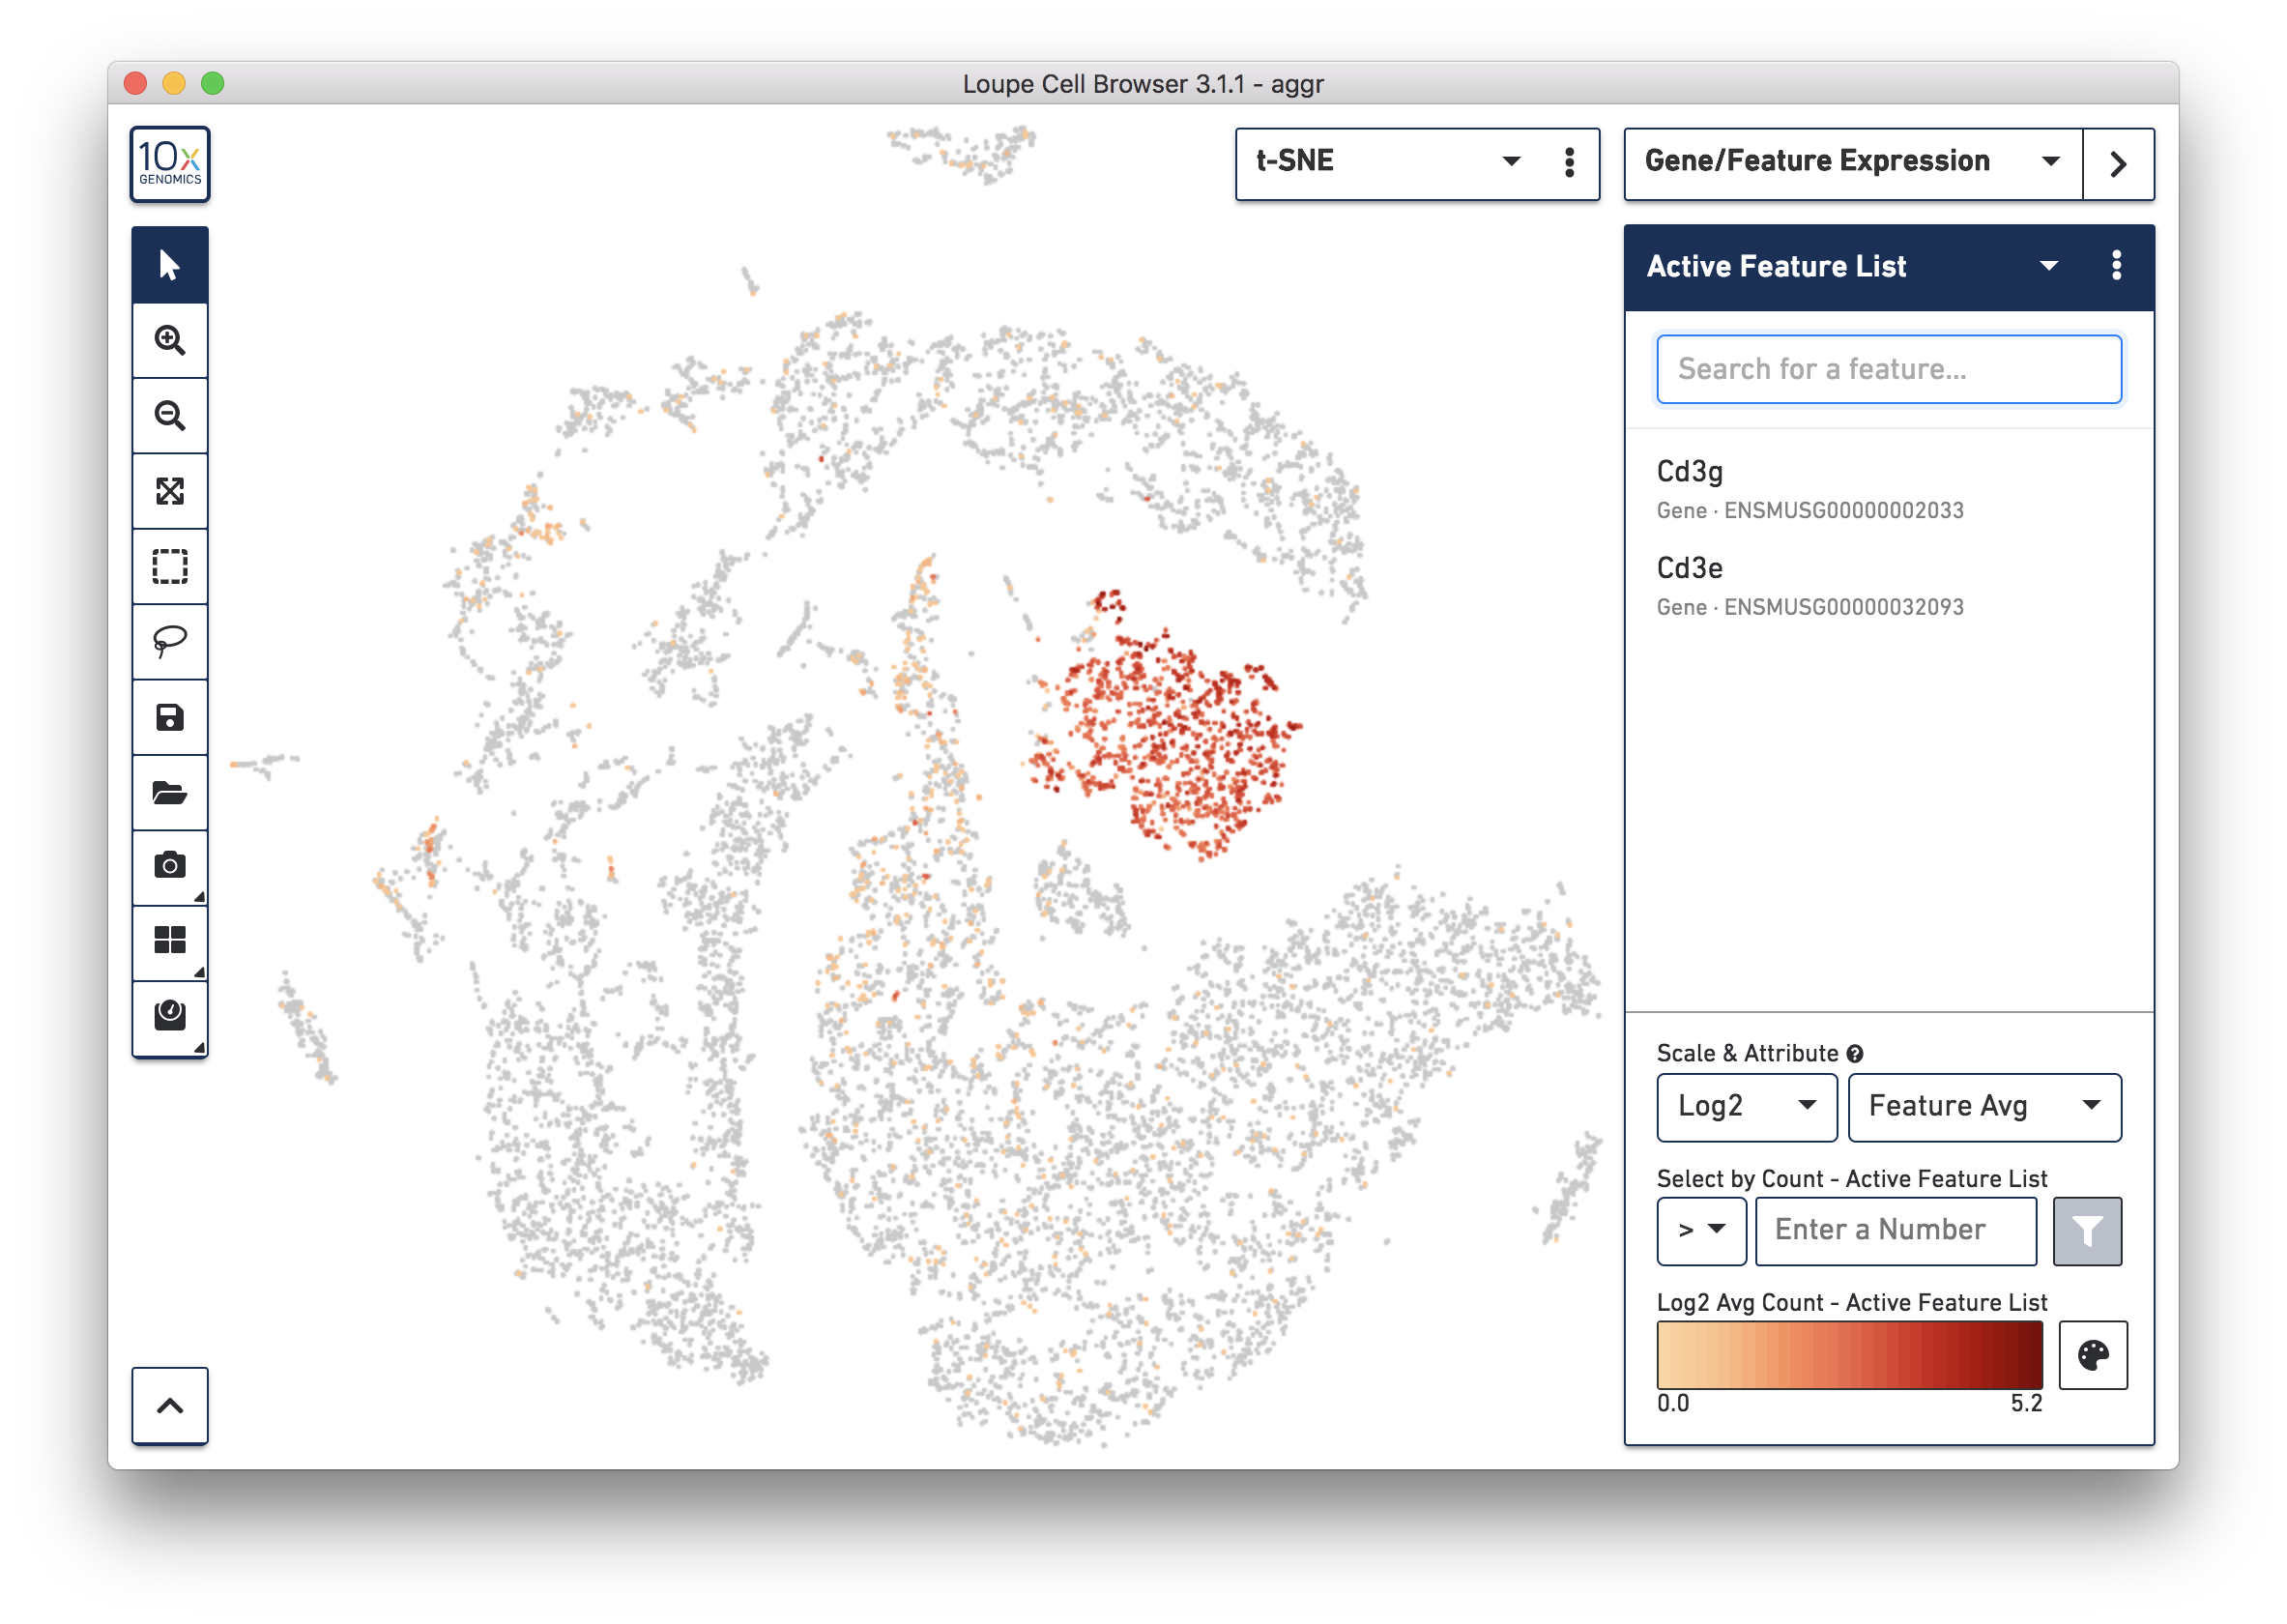
To further confirm that Cluster 3 are immune cells, using the Gene/Feature Expression mode, view the expression level of Cd3g and Cd3e across the dataset. See the screenshot below. The cells expressing these immune cell markers are neatly clustered into Cluster 3, indicating that this distinct region of cells represents immune cells.
Similarly, identify the cell types of all the other clusters based on the top up-regulated genes and associate them with known cell types based on literature. Depending on the complexity of the dataset and prior knowledge on the cell types, this process could be laborious and time-consuming.
Consistent with what was reported in the publication, all but one cluster was assigned to known cell types. The identified cell types and the markers genes are shown in the screenshot below that was exported from Loupe Browser.
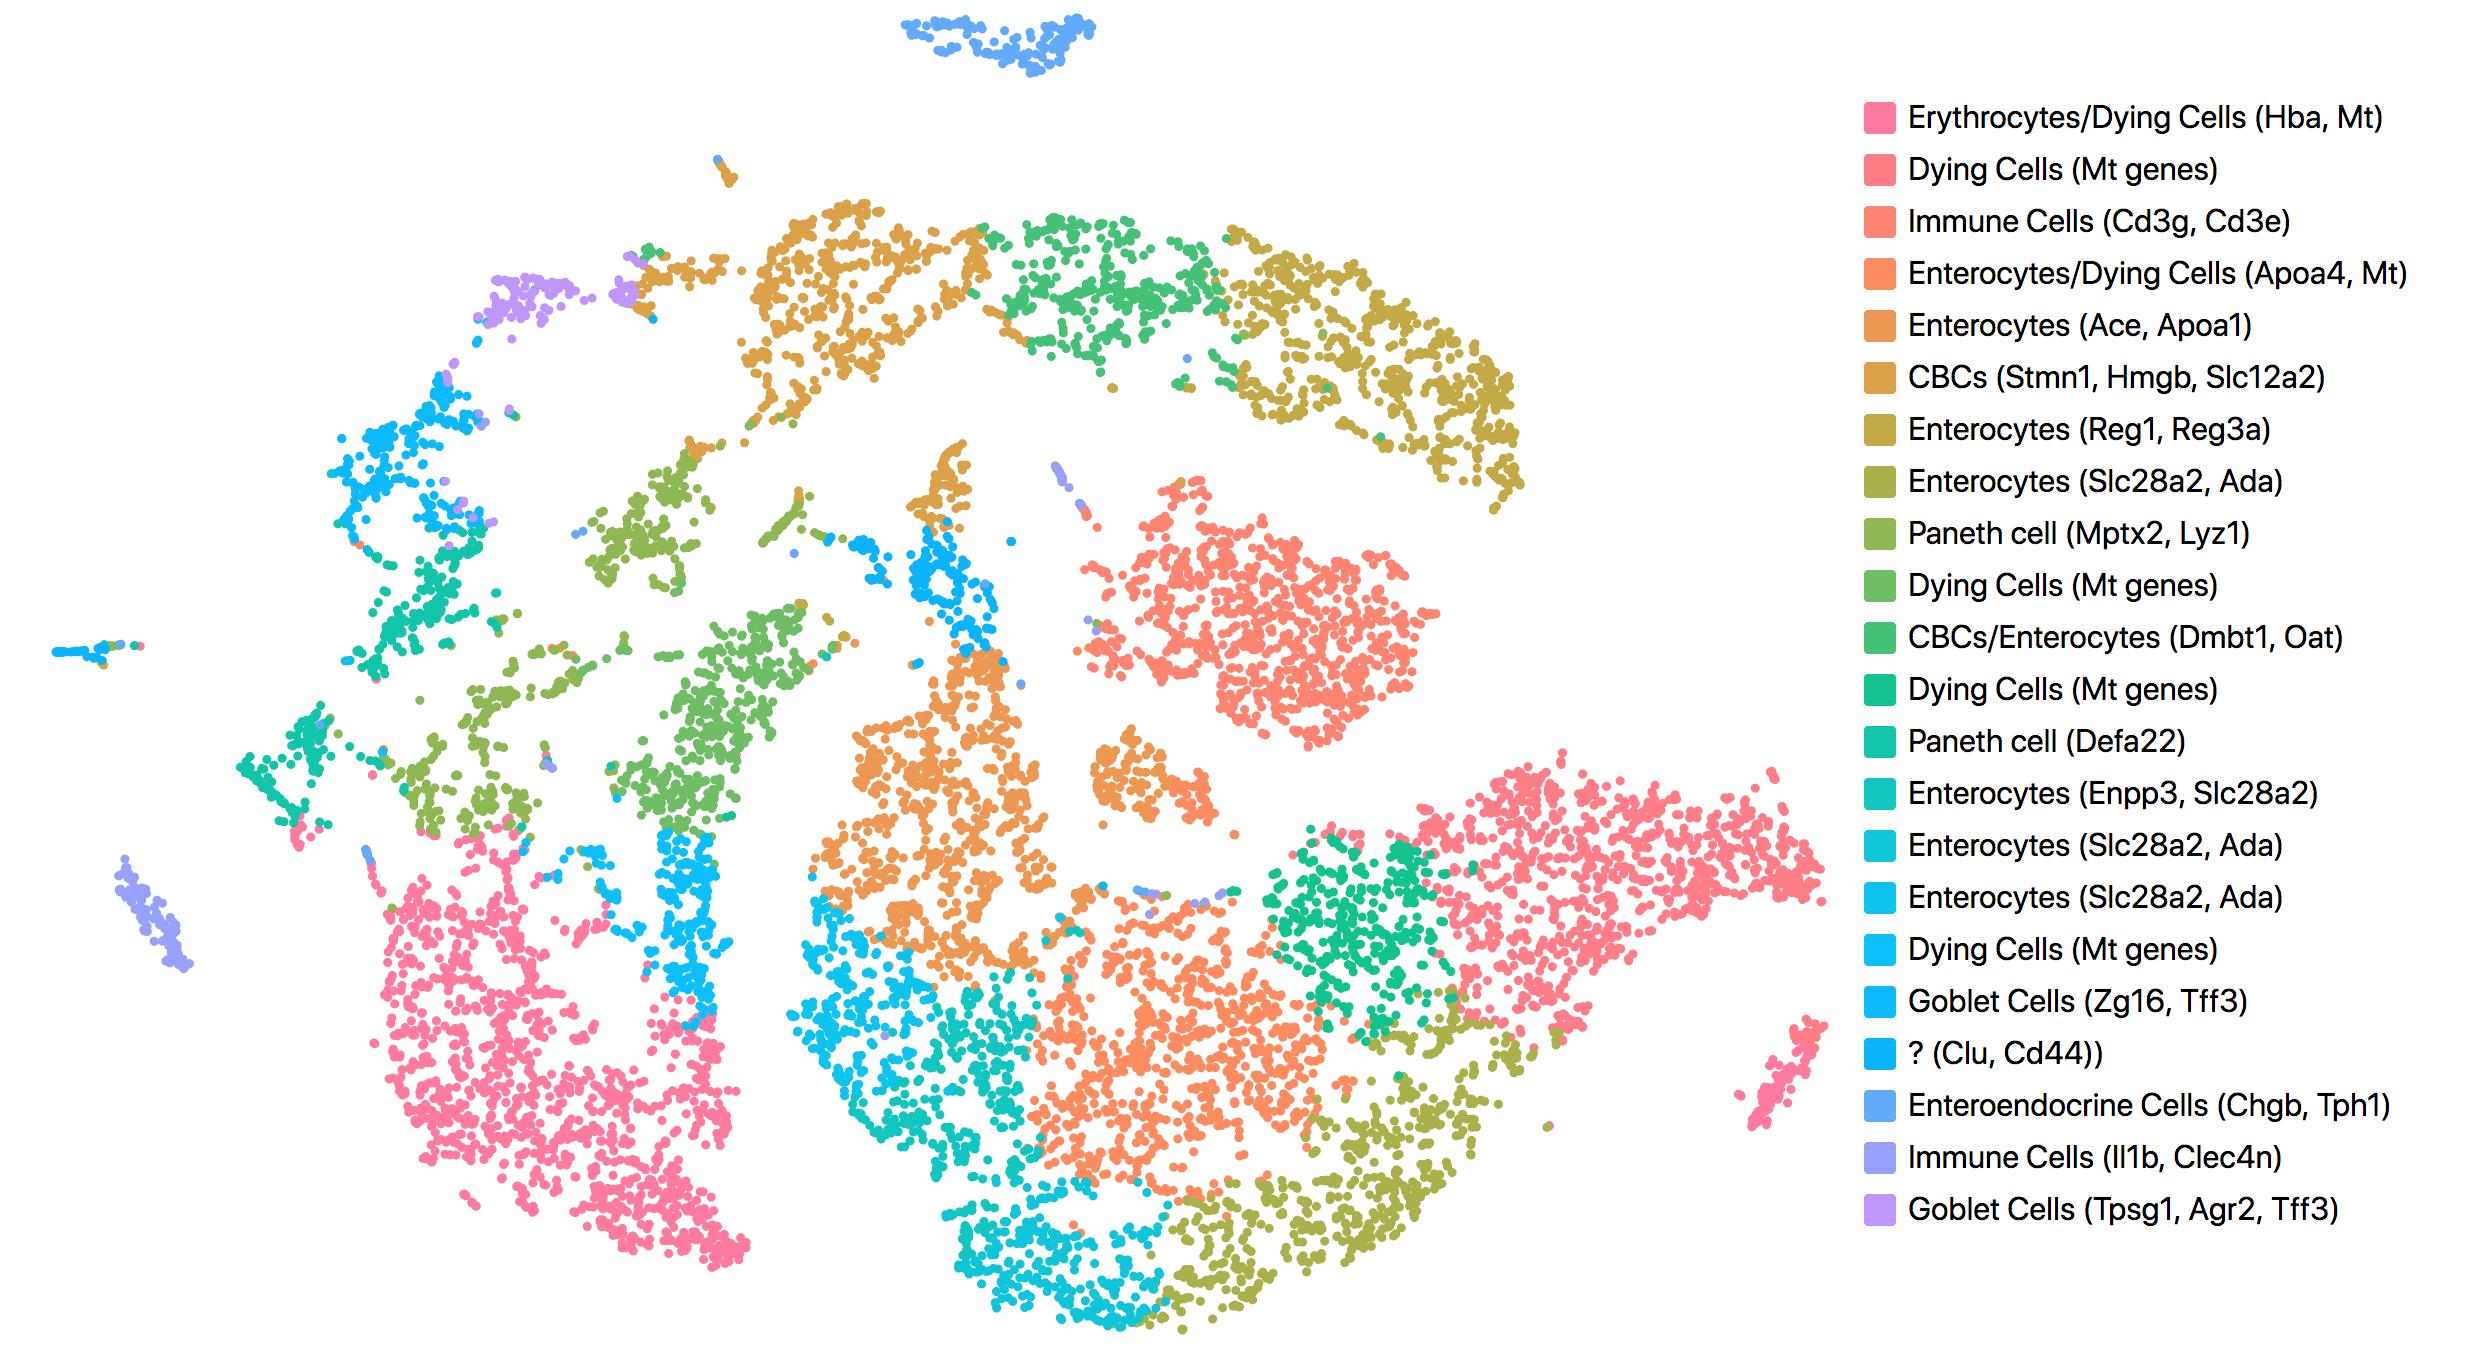
The most up-regulated gene in the unknown cluster is clusterin (Clu), which is consistent with the publication.
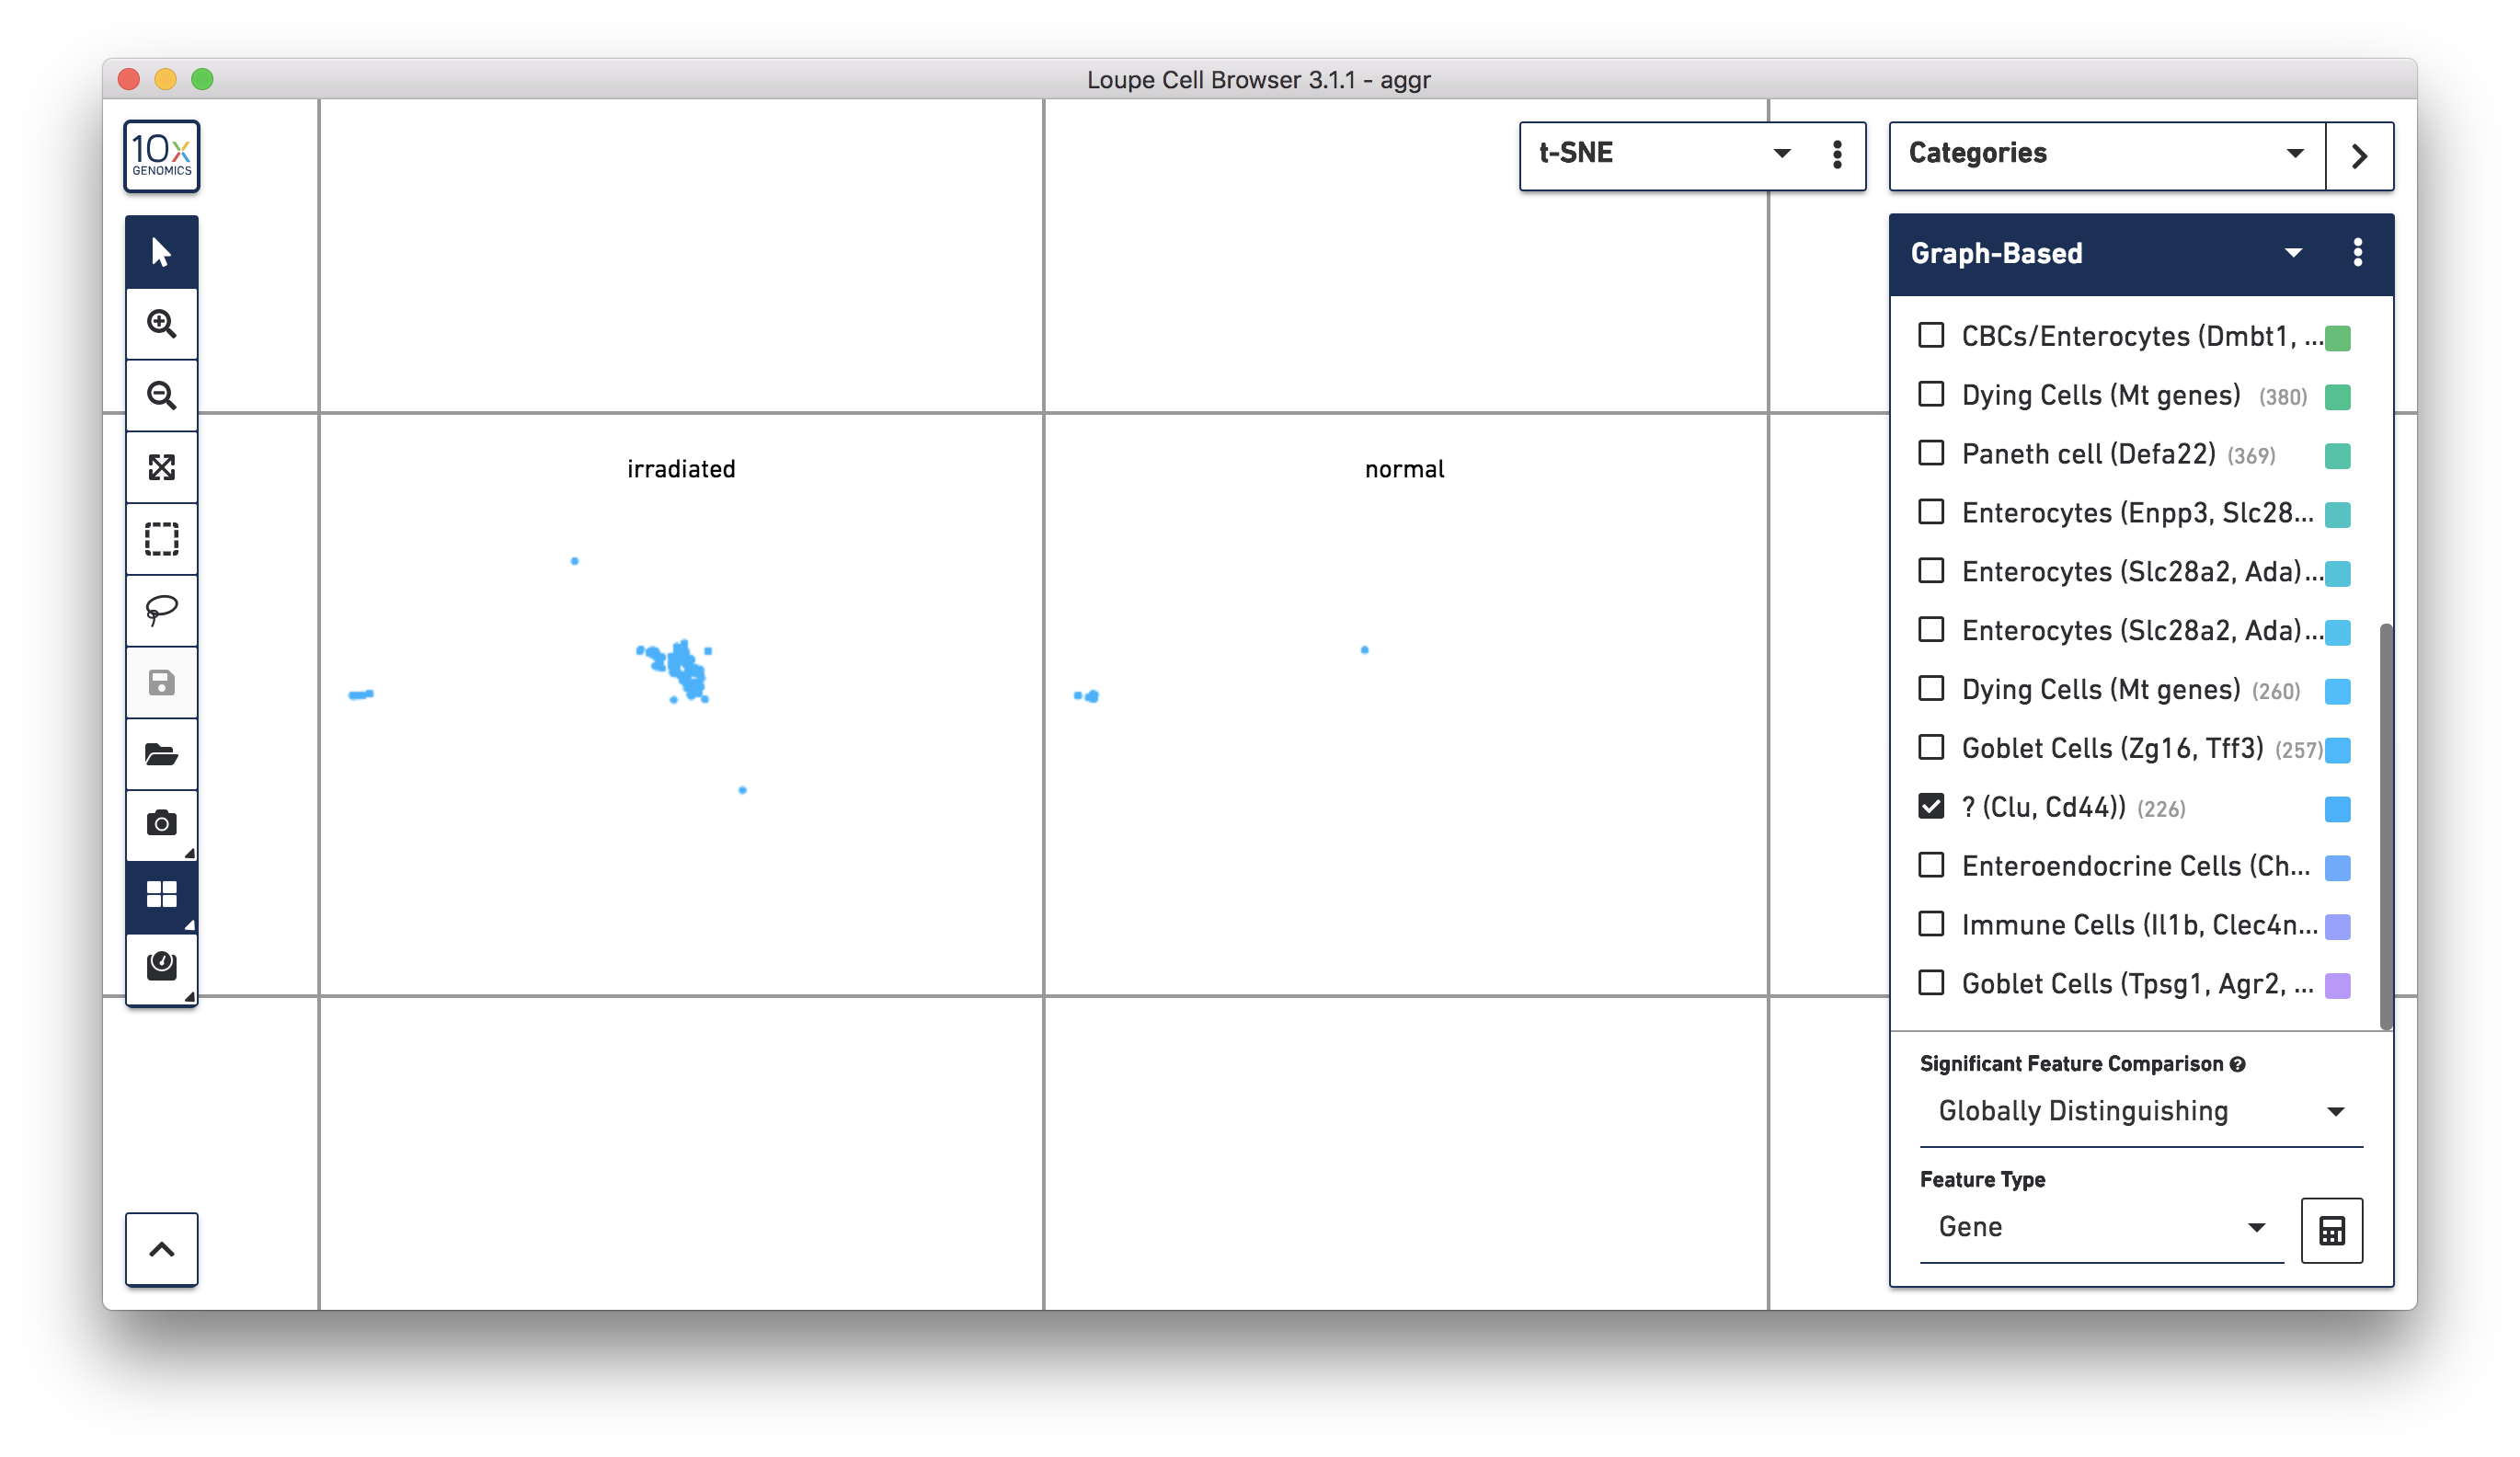
Next, continue to use Loupe Browser to explore if the cluster of unknown cells is enriched or lost in the irradiated sample compared to the normal one. By using the split view (see the screenshot below), based on the LibraryID Category, select only the unknown cluster to clearly see that more cells in this unknown cluster were from the irradiated sample.
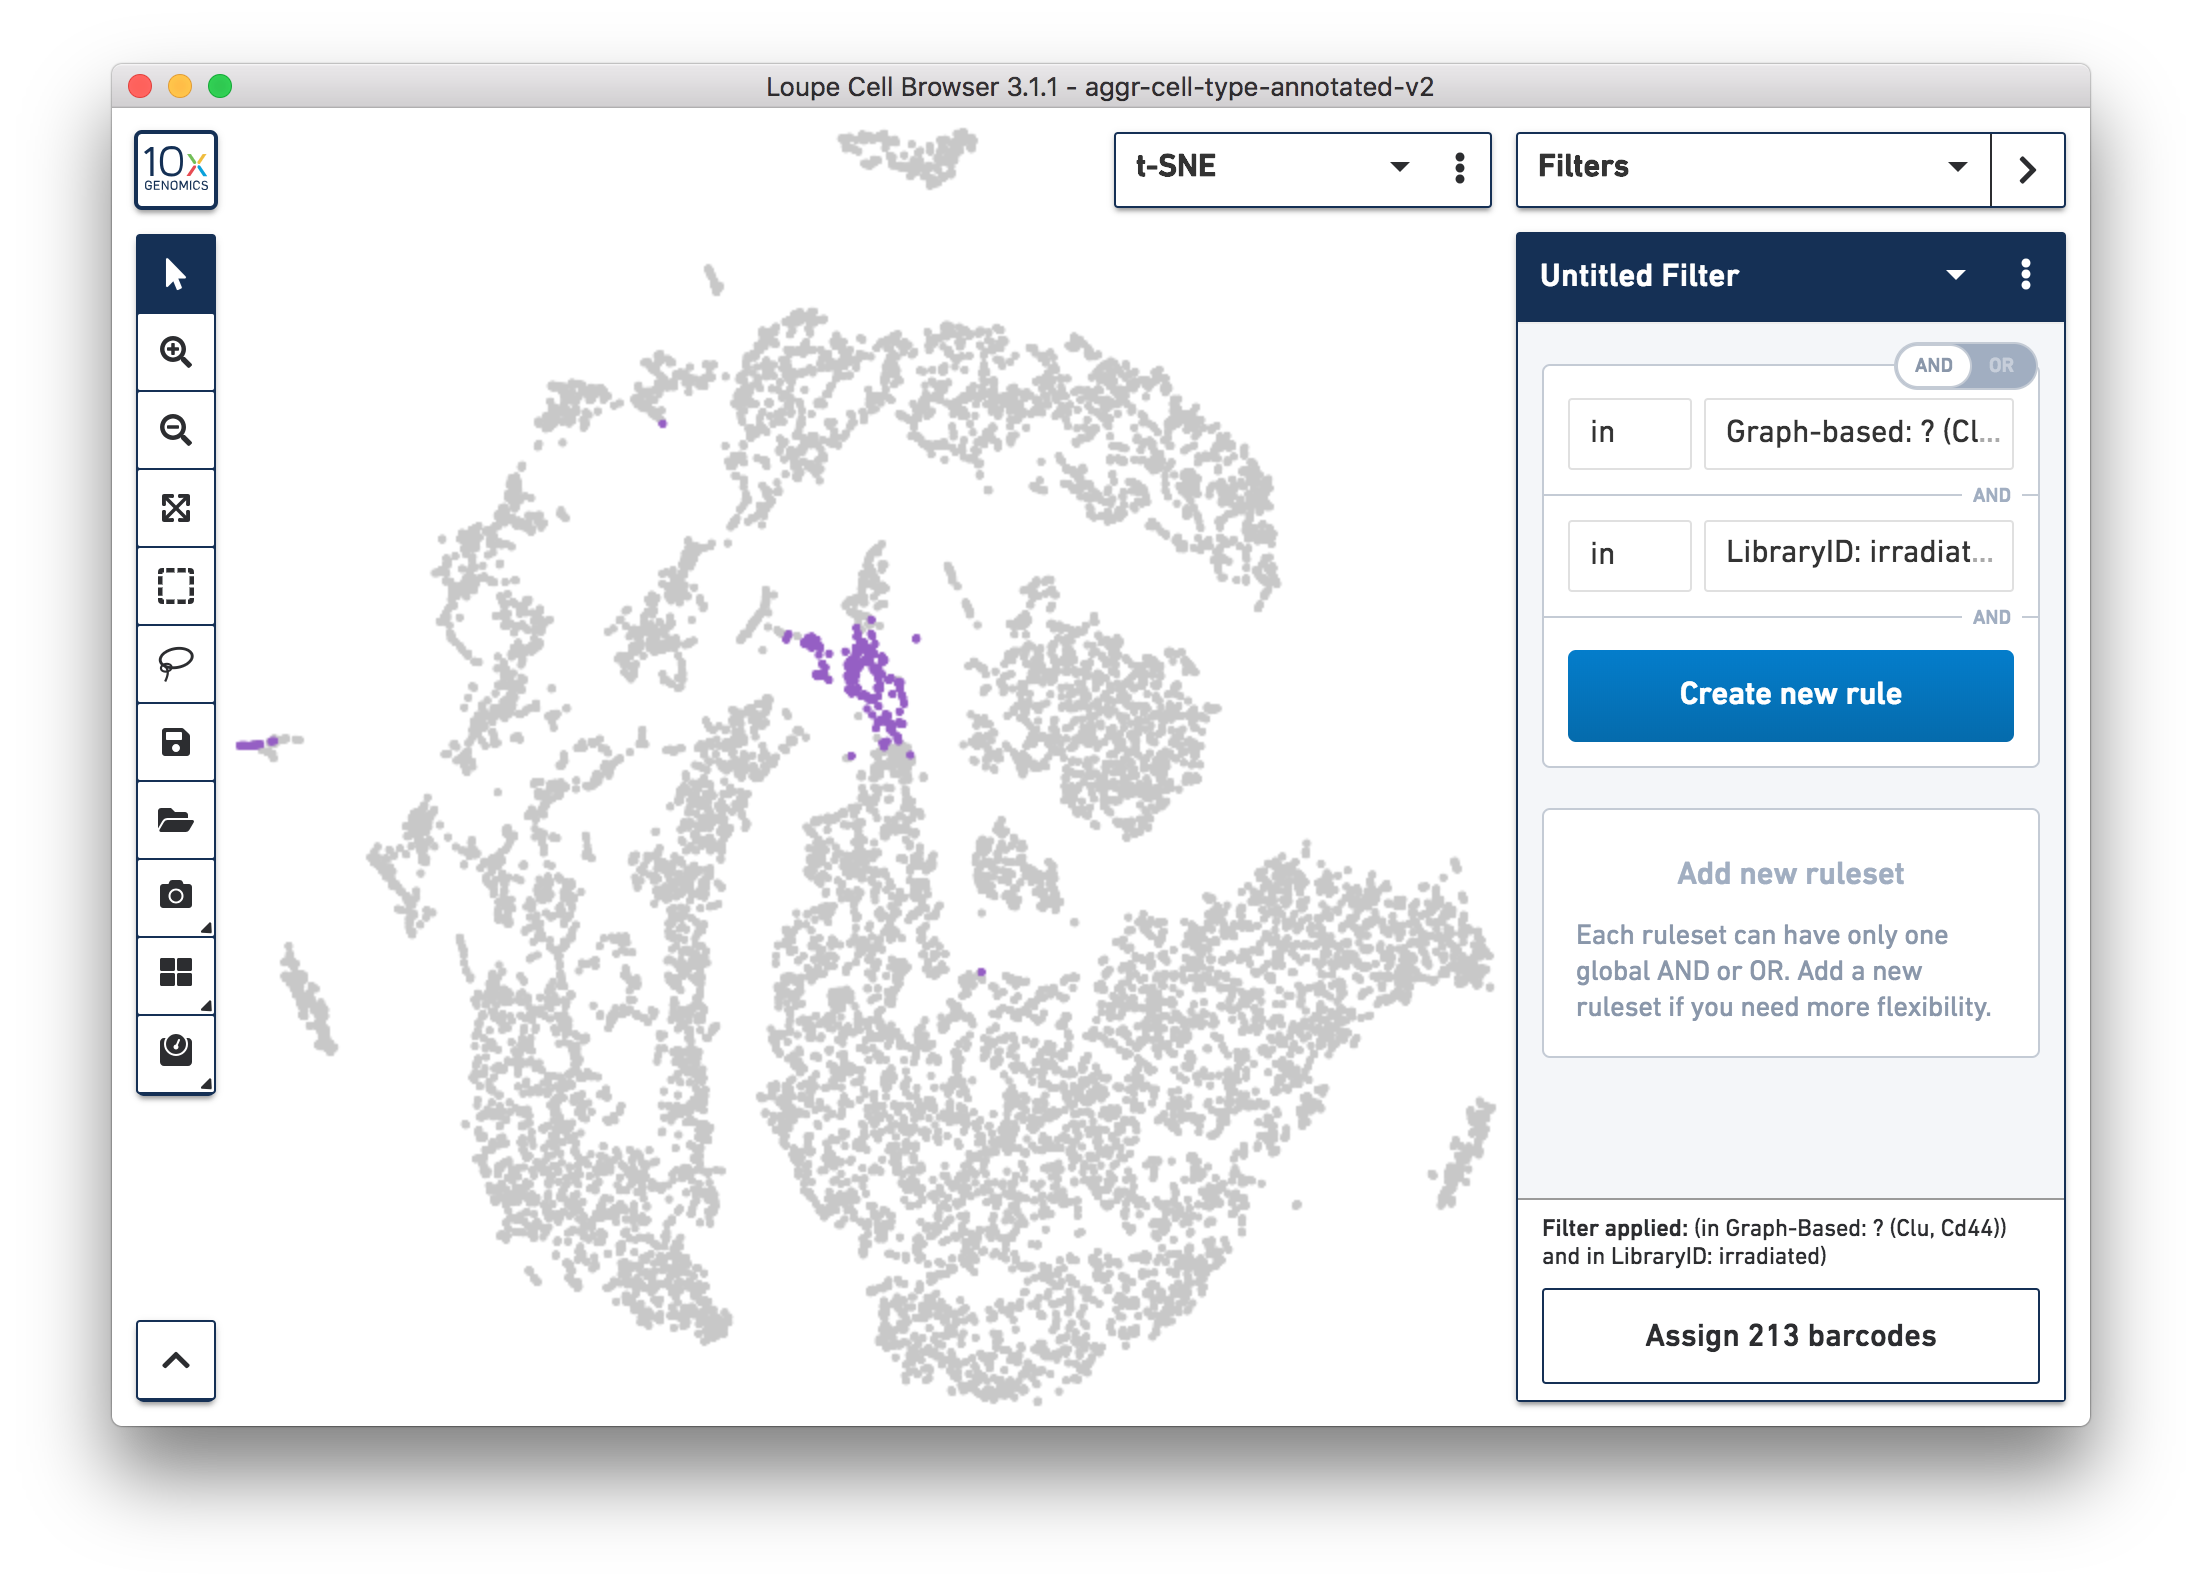
To get more accurate numbers, use the Filters panel (see the screenshot below). 213 cell barcodes from the irradiated sample were found in this unknown cluster, while only 13 cells from the normal sample were in this cluster. This result is also similar to what was reported in the publication.
Following these initial findings, the authors performed additional experiments and validated that the Clu+ cell induced by injury is essential for intestine regeneration.
This is a quick tour of how to use the 10x Single Cell Gene Expression assay and analysis tools to identify a novel cell type. There are many additional analyses that can be done using the 10x tools or third-party tools.
For example, in the results, several clusters of cells are enriched for mitochondrial (Mt) genes. They can be excluded in the secondary analysis by following the instructions in this article: How can I exclude cells that show enrichment of MT genes from secondary data analysis?
Output data from Cell Ranger can be loaded into third-party tools to perform trajectory analysis, which can be used to explore the role of the Clu+ cells in the dynamic process of intestine regeneration.
To get started with your own single cell gene expression experiments, visit our gene expression support website for more details on workflow and software.