Space Ranger1.0, printed on 03/26/2025
| Metric | Description |
|---|---|
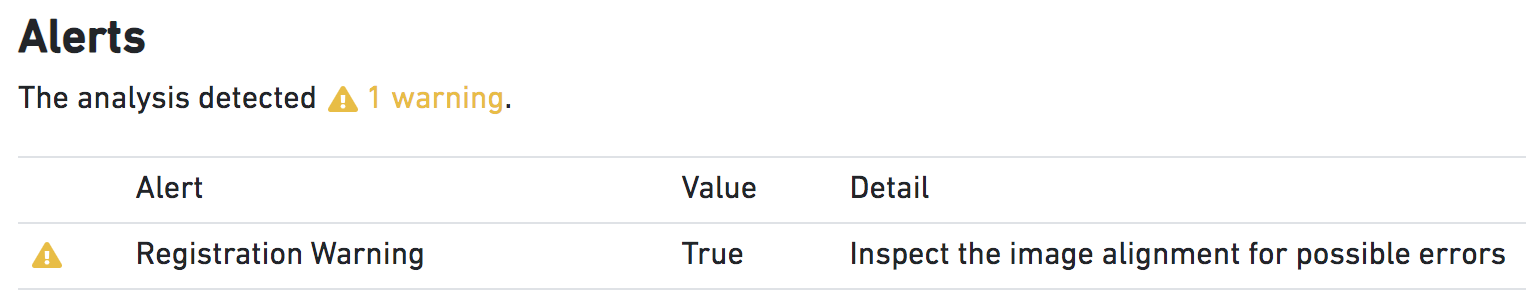
Suspect Alignment | Metric is True when the fiducial alignment algorithm fails. Alignment failure often manifests as a subtle rotation or translation that misplaces spots by a fraction of the spot diameter. These failures are difficult to automatically catch, as detection of the alignment failure is similar to the process of alignment itself. However, if the alignment process reports a scaling, rotation, or translation of the input image that seems truly implausible, the pipeline will issue a warning that the user should closely inspect the results of the fiducial alignment (see image below). The absence of such a warning is not a guarantee of success, so the user should always inspect the quality-control images from the pipeline for subtle errors. |
Space Ranger pipelines output key metrics in text format. Below are the definitions of the reported metrics.
The spaceranger count pipeline outputs metrics_summary.csv which contains a number of key metrics about the barcoding and sequencing process.
| Metric | Description |
|---|---|
Number of Spots Under Tissue | The number of barcodes associated with a spot under tissue. |
Mean Reads per Spot | The total number of sequenced reads divided by the number of barcodes associated with a spot under tissue. |
Median Genes per Spot | The median number of genes detected per spot under tissue-associated barcode. Detection is defined as the presence of at least 1 UMI count. |
Number of Reads | Total number of read pairs that were assigned to this library in demultiplexing. |
Valid Barcodes | Fraction of reads with barcodes that match the whitelist after barcode correction. |
Reads Mapped Confidently to Transcriptome | Fraction of reads that mapped to a unique gene in the transcriptome. The read must be consistent with annotated splice junctions. These reads are considered for UMI counting. |
Reads Mapped Confidently to Exonic Regions | Fraction of reads that mapped uniquely to an exonic region of the genome. |
Reads Mapped Confidently to Intronic Regions | Fraction of reads that mapped uniquely to an intronic region of the genome. |
Reads Mapped Confidently to Intergenic Regions | Fraction of reads that mapped uniquely to an intergenic region of the genome. |
Sequencing Saturation | The fraction of reads originating from an already-observed UMI. This is a function of library complexity and sequencing depth. More specifically, this is the fraction of confidently mapped, valid spot-barcode, valid UMI reads that had a non-unique (spot-barcode, UMI, gene). |
Q30 Bases in Barcode | Fraction of spot barcode bases with Q-score >= 30, excluding very low quality/no-call (Q <= 2) bases from the denominator. |
Q30 Bases in RNA Read | Fraction of RNA read bases with Q-score >= 30, excluding very low quality/no-call (Q <= 2) bases from the denominator. This is Read 2 for the Visium v1 chemistry. |
Q30 Bases in UMI | Fraction of UMI bases with Q-score >= 30, excluding very low quality/no-call (Q <= 2) bases from the denominator. |
Fraction Reads in Spots Under Tissue | The fraction of valid-barcode, confidently-mapped-to-transcriptome reads with spot-associated barcodes. |
Total Genes Detected | The number of genes with at least one UMI count in any tissue covered spot. |
Median UMI Counts per Spot | The median number of UMI counts per tissue covered spot. |