Cell Ranger ARC5.0, printed on 04/06/2025
To review features and common data specific to multiome ATAC + Gene Expression data, open the pbmc3k_multiome_annotated.cloupe dataset as instructed in the introduction. The dataset may take about 30 seconds to load on a typical laptop; this is expected. Once the data loads, you should see something like this:
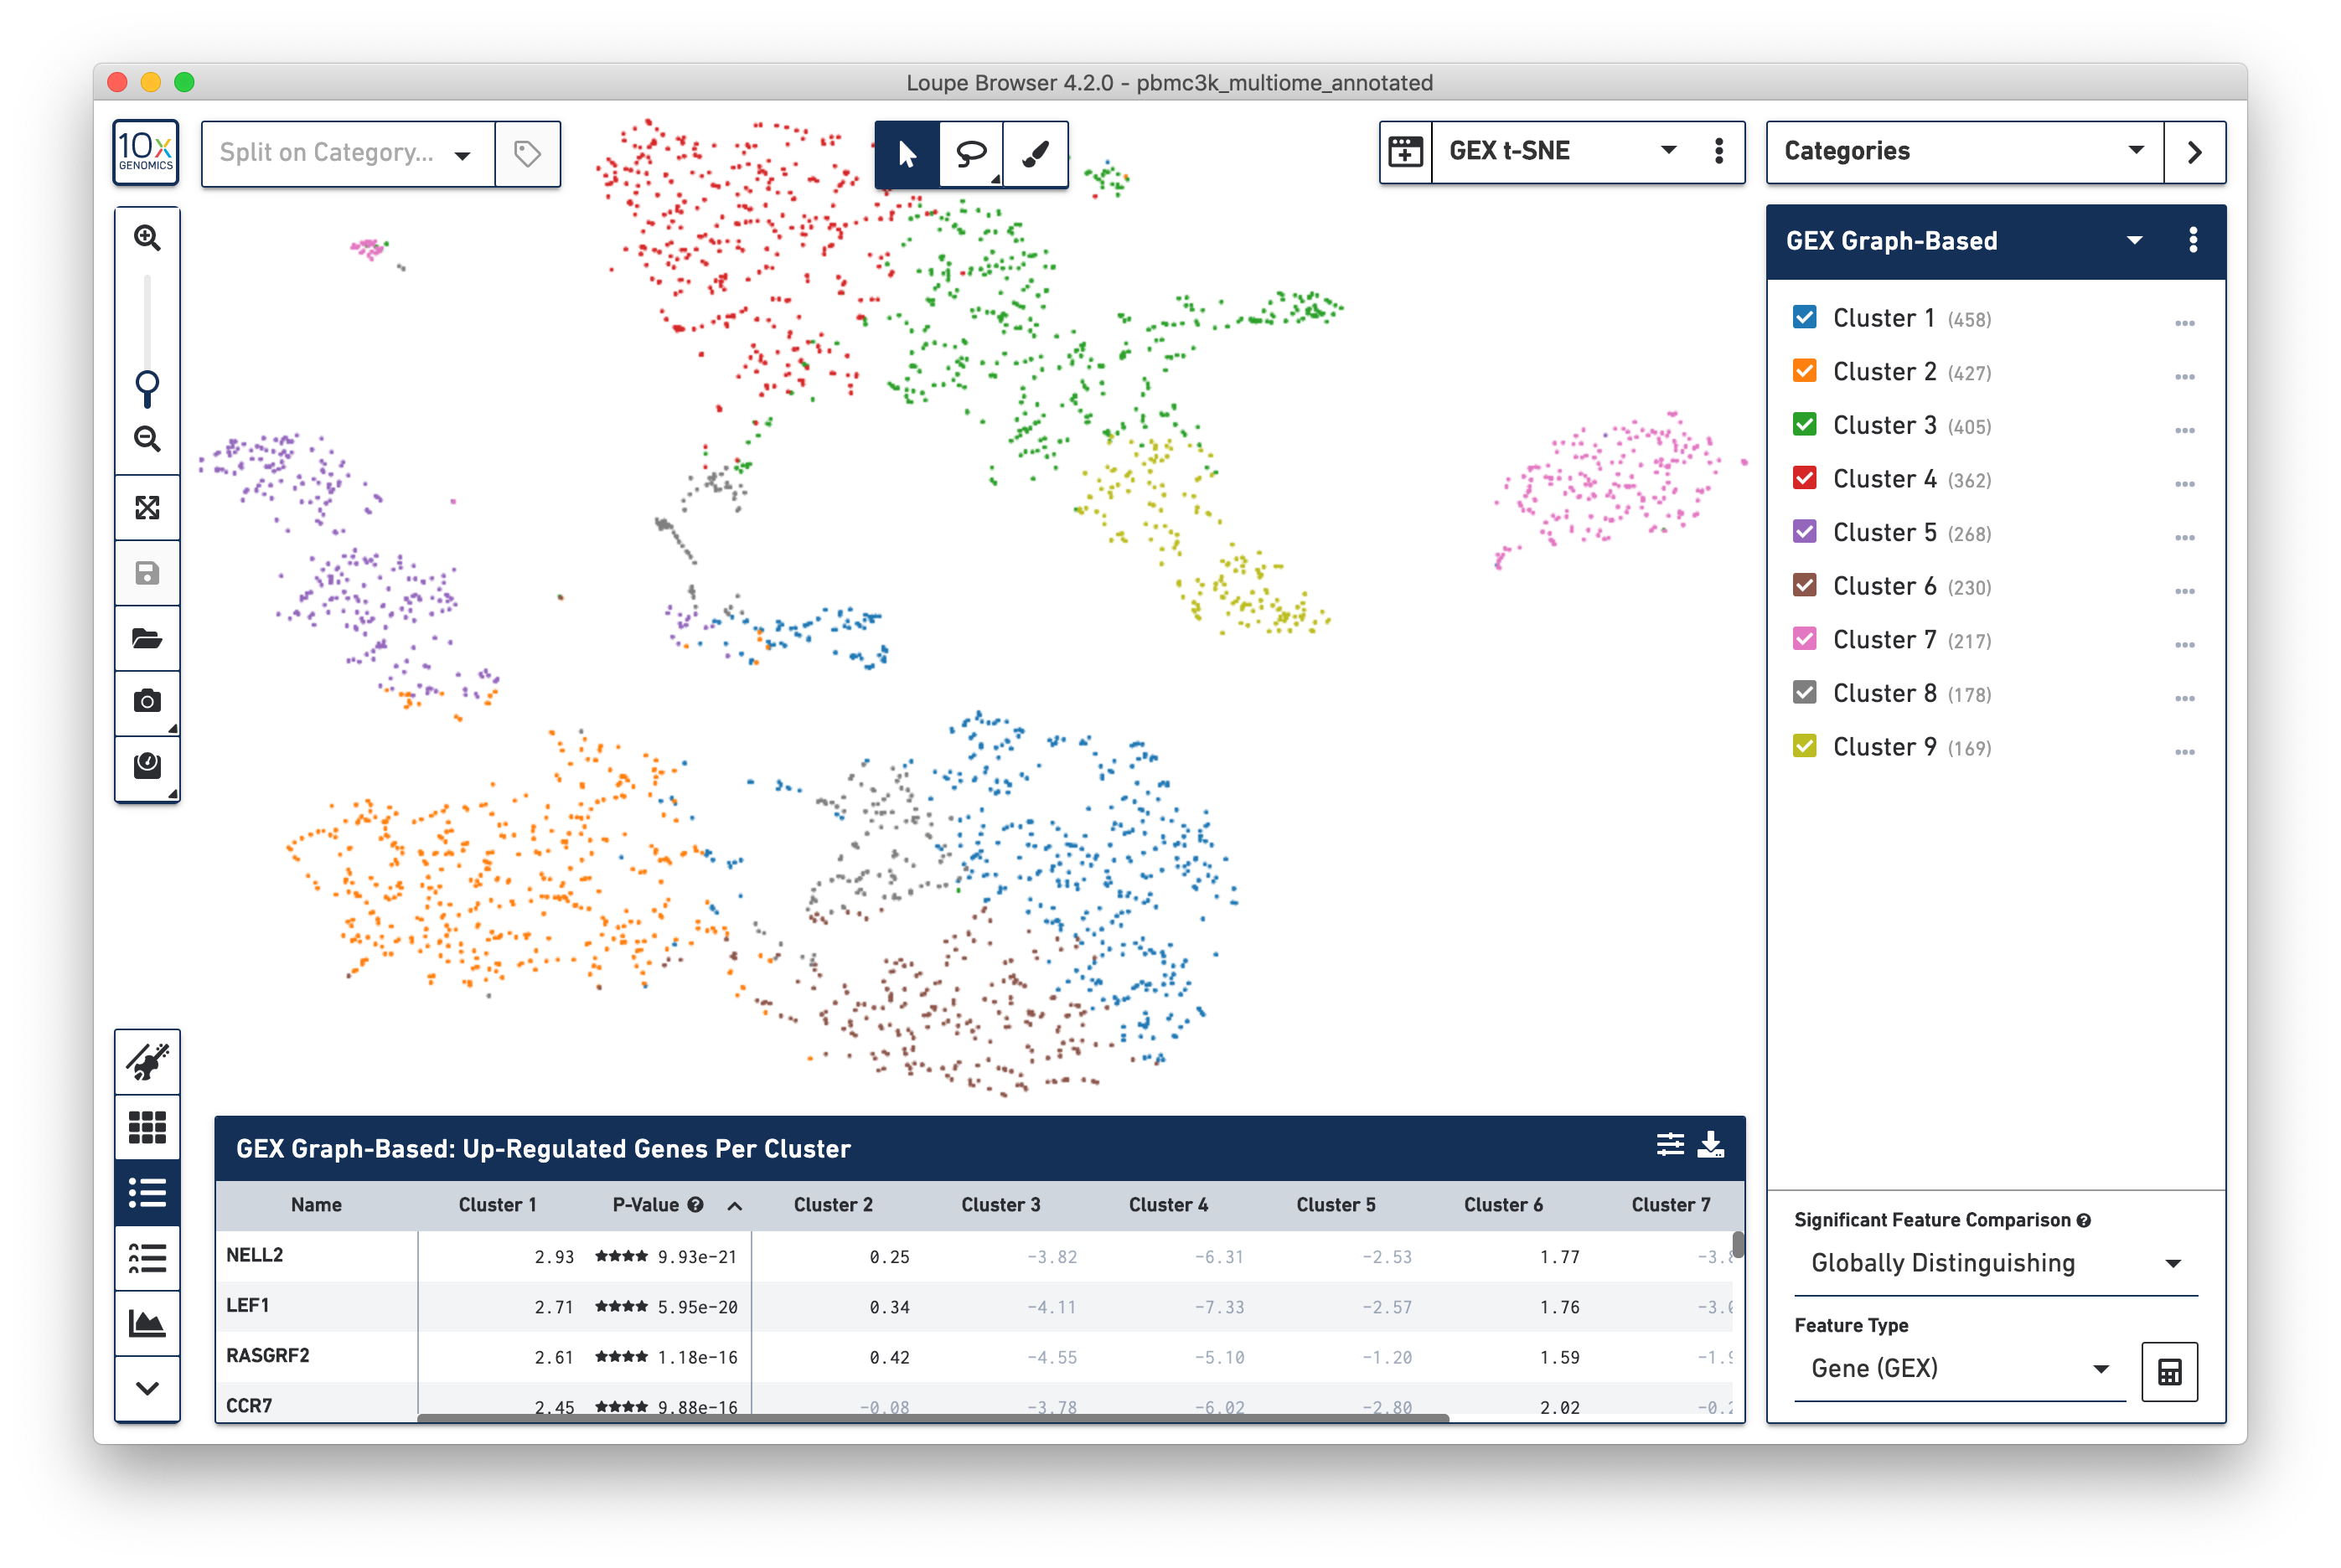
This default view should look fairly familiar to Gene Expression data. The default plot is a t-SNE plot of the gene expression arm of the multiome dataset, the default clustering is the Graph-Based clustering derived from Gene Expression data, and the data table shows the most significant genes per cluster. The first thing to cover is how to switch between Gene Expression-centric and ATAC-centric views.
Clicking on the Projection dropdown above the t-SNE plot reveals the different projections generated by the Cell Ranger ARC pipeline: a t-SNE and UMAP projection derived from gene expression data (GEX t-SNE and GEX UMAP) and t-SNE and UMAP projections derived from accessibility data (ATAC t-SNE and ATAC UMAP). Clicking on 'ATAC UMAP' changes the cell coordinates:
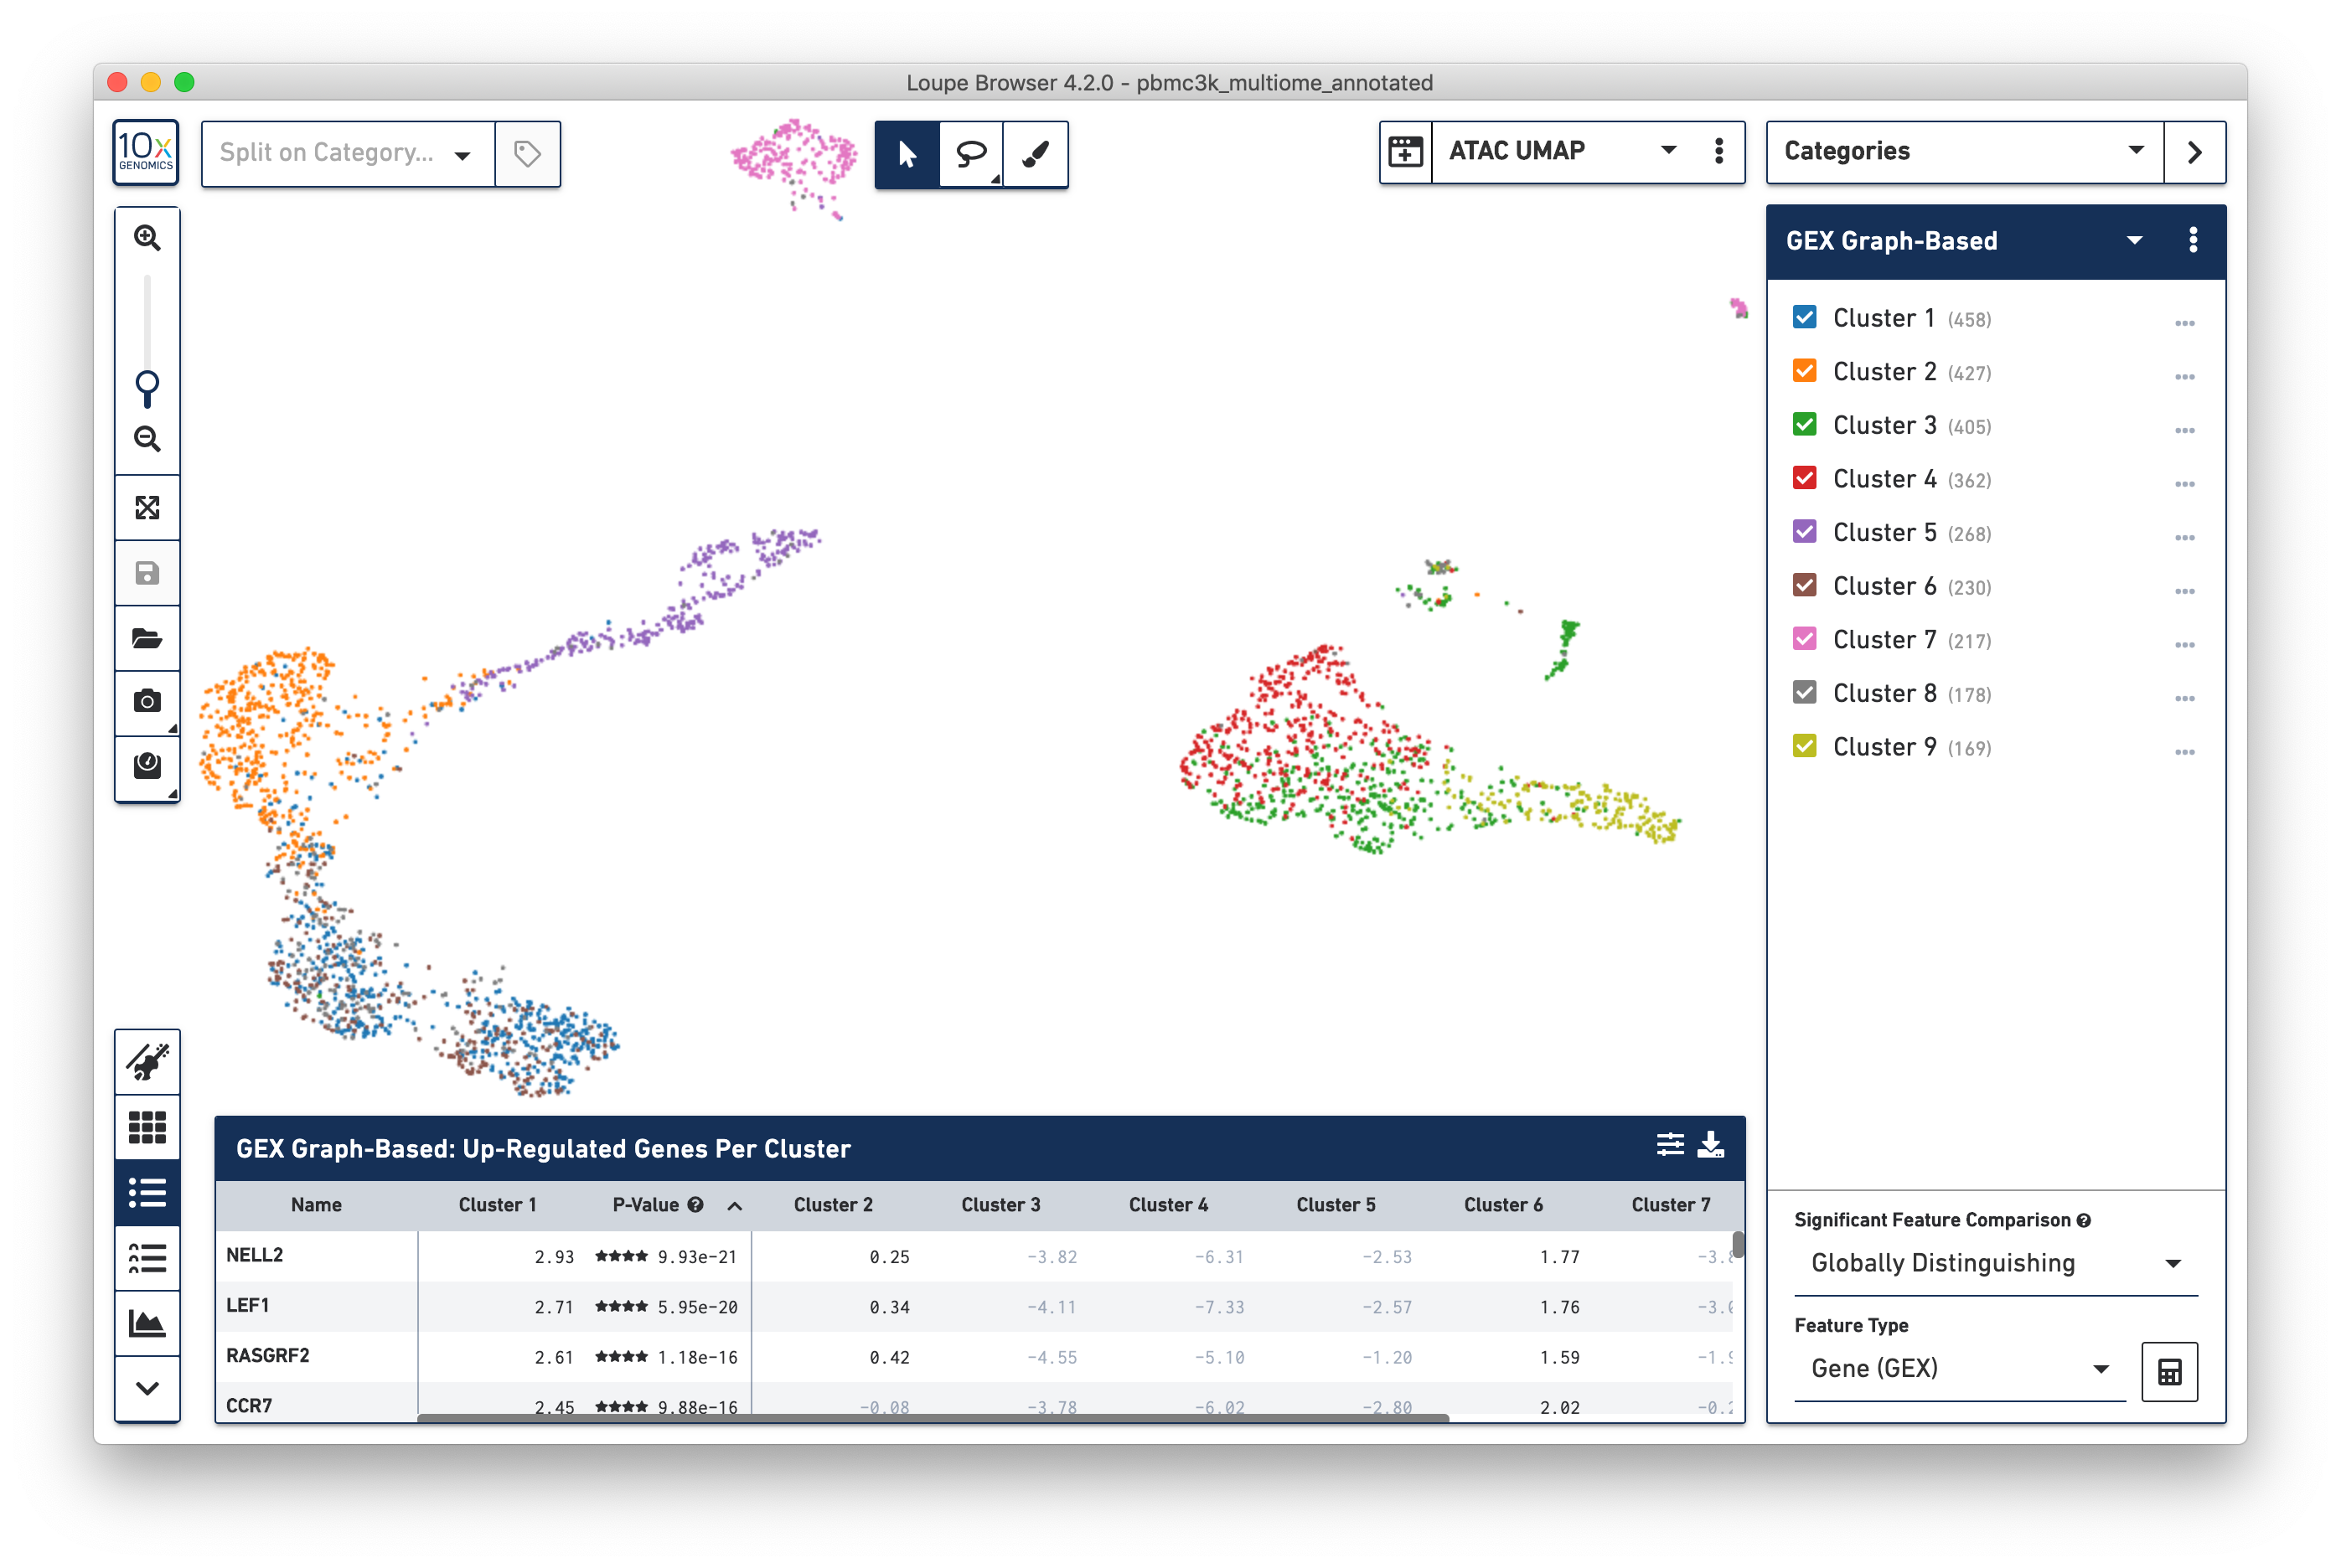
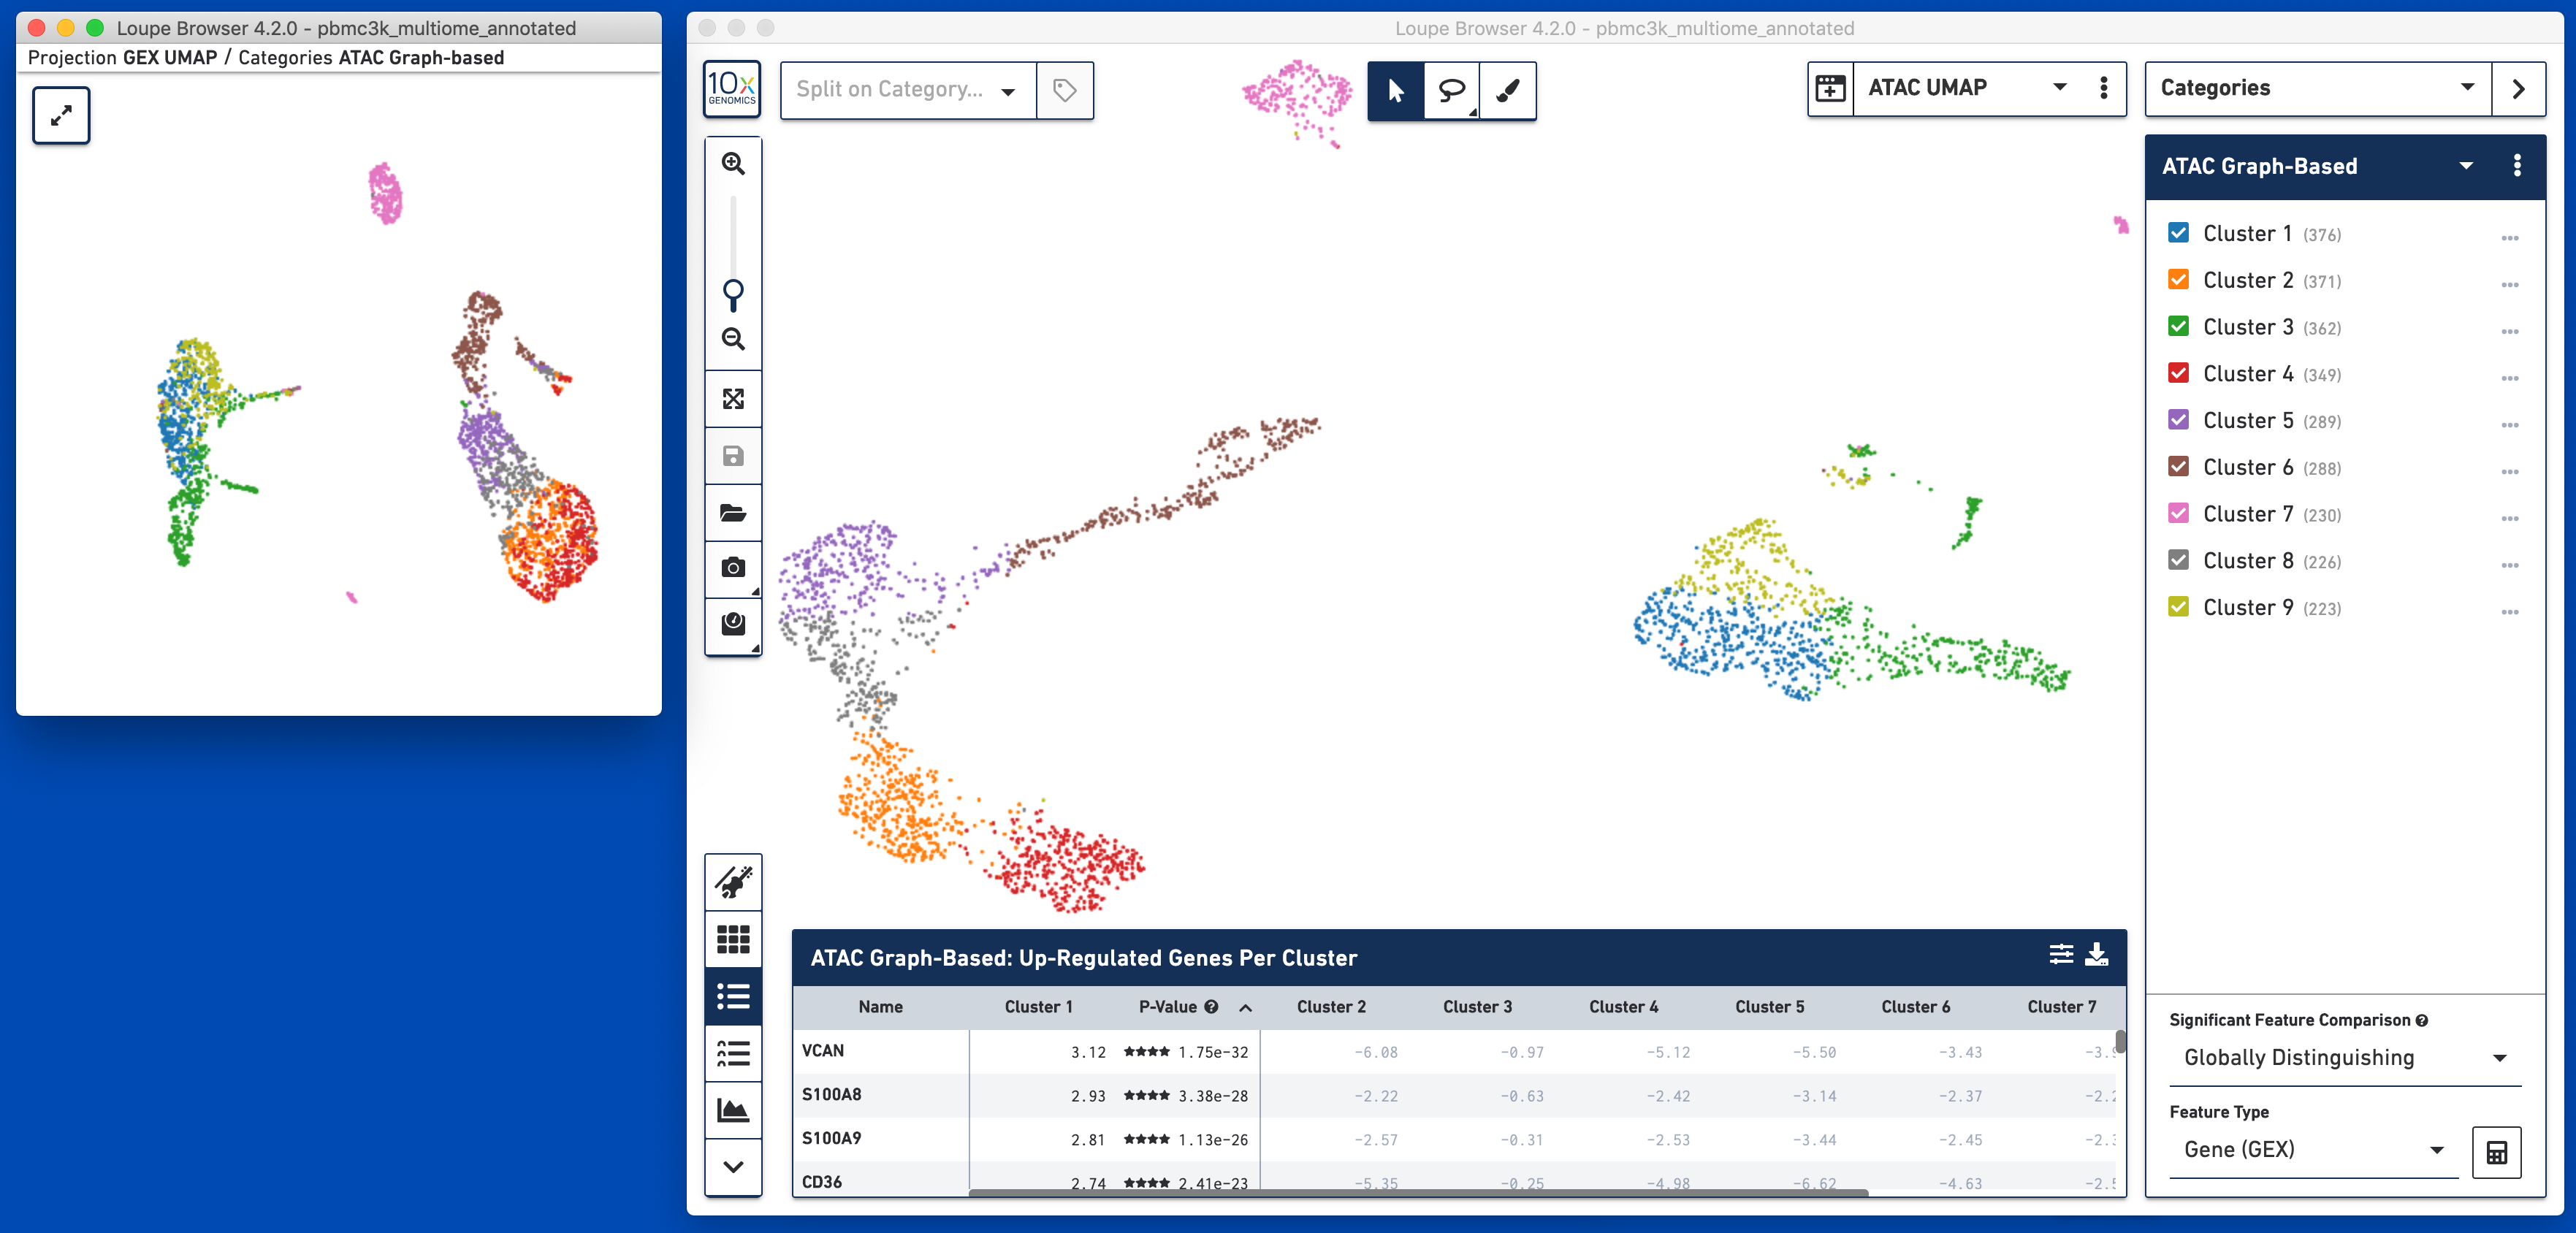
Note that changing the projection does not change the underlying clustering; the active category remains 'GEX Graph-Based'. However, it should be noted that the GEX-based clustering still maps fairly neatly onto the ATAC-derived datasets, though GEX Clusters 1 (blue) and 6 (brown) seem fairly inter-mixed in the ATAC data. To see the ATAC-derived clusters, click on the Category dropdown, and change the currently selected category from GEX Graph-Based to ATAC Graph-Based. The data is now colored by ATAC-derived clusters:
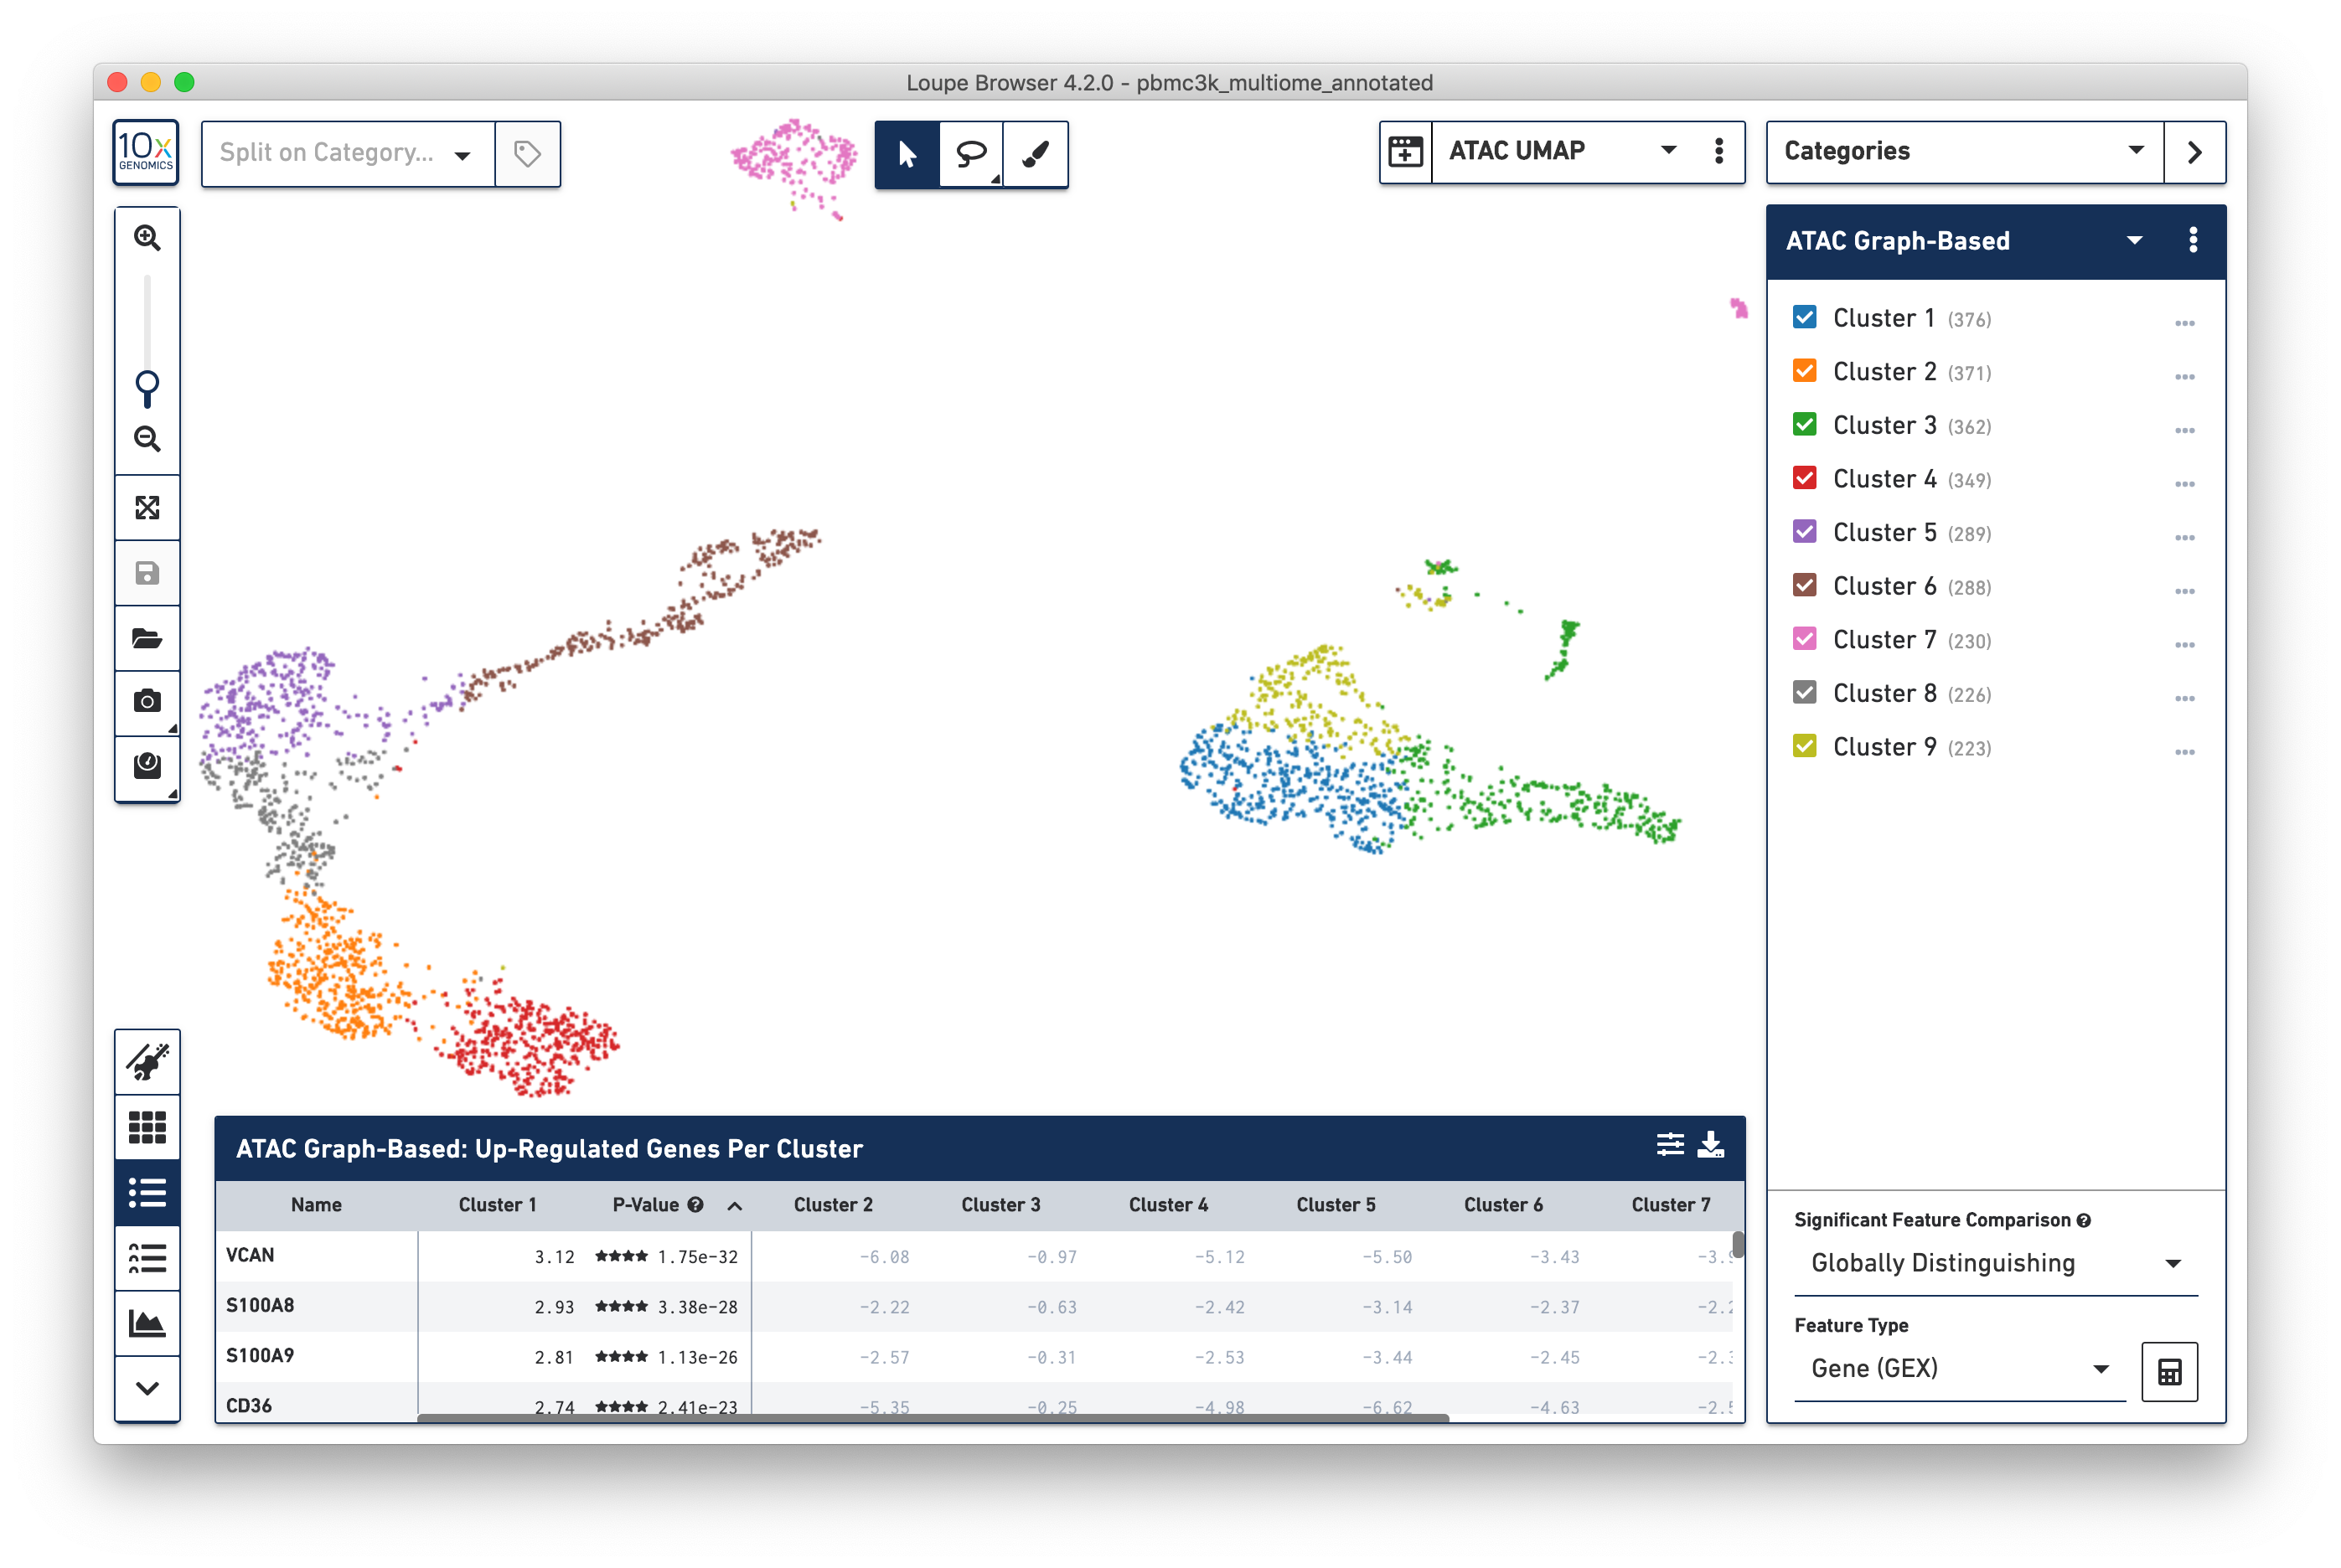
The significant genes per ATAC-derived cluster are now shown in the data table as well.
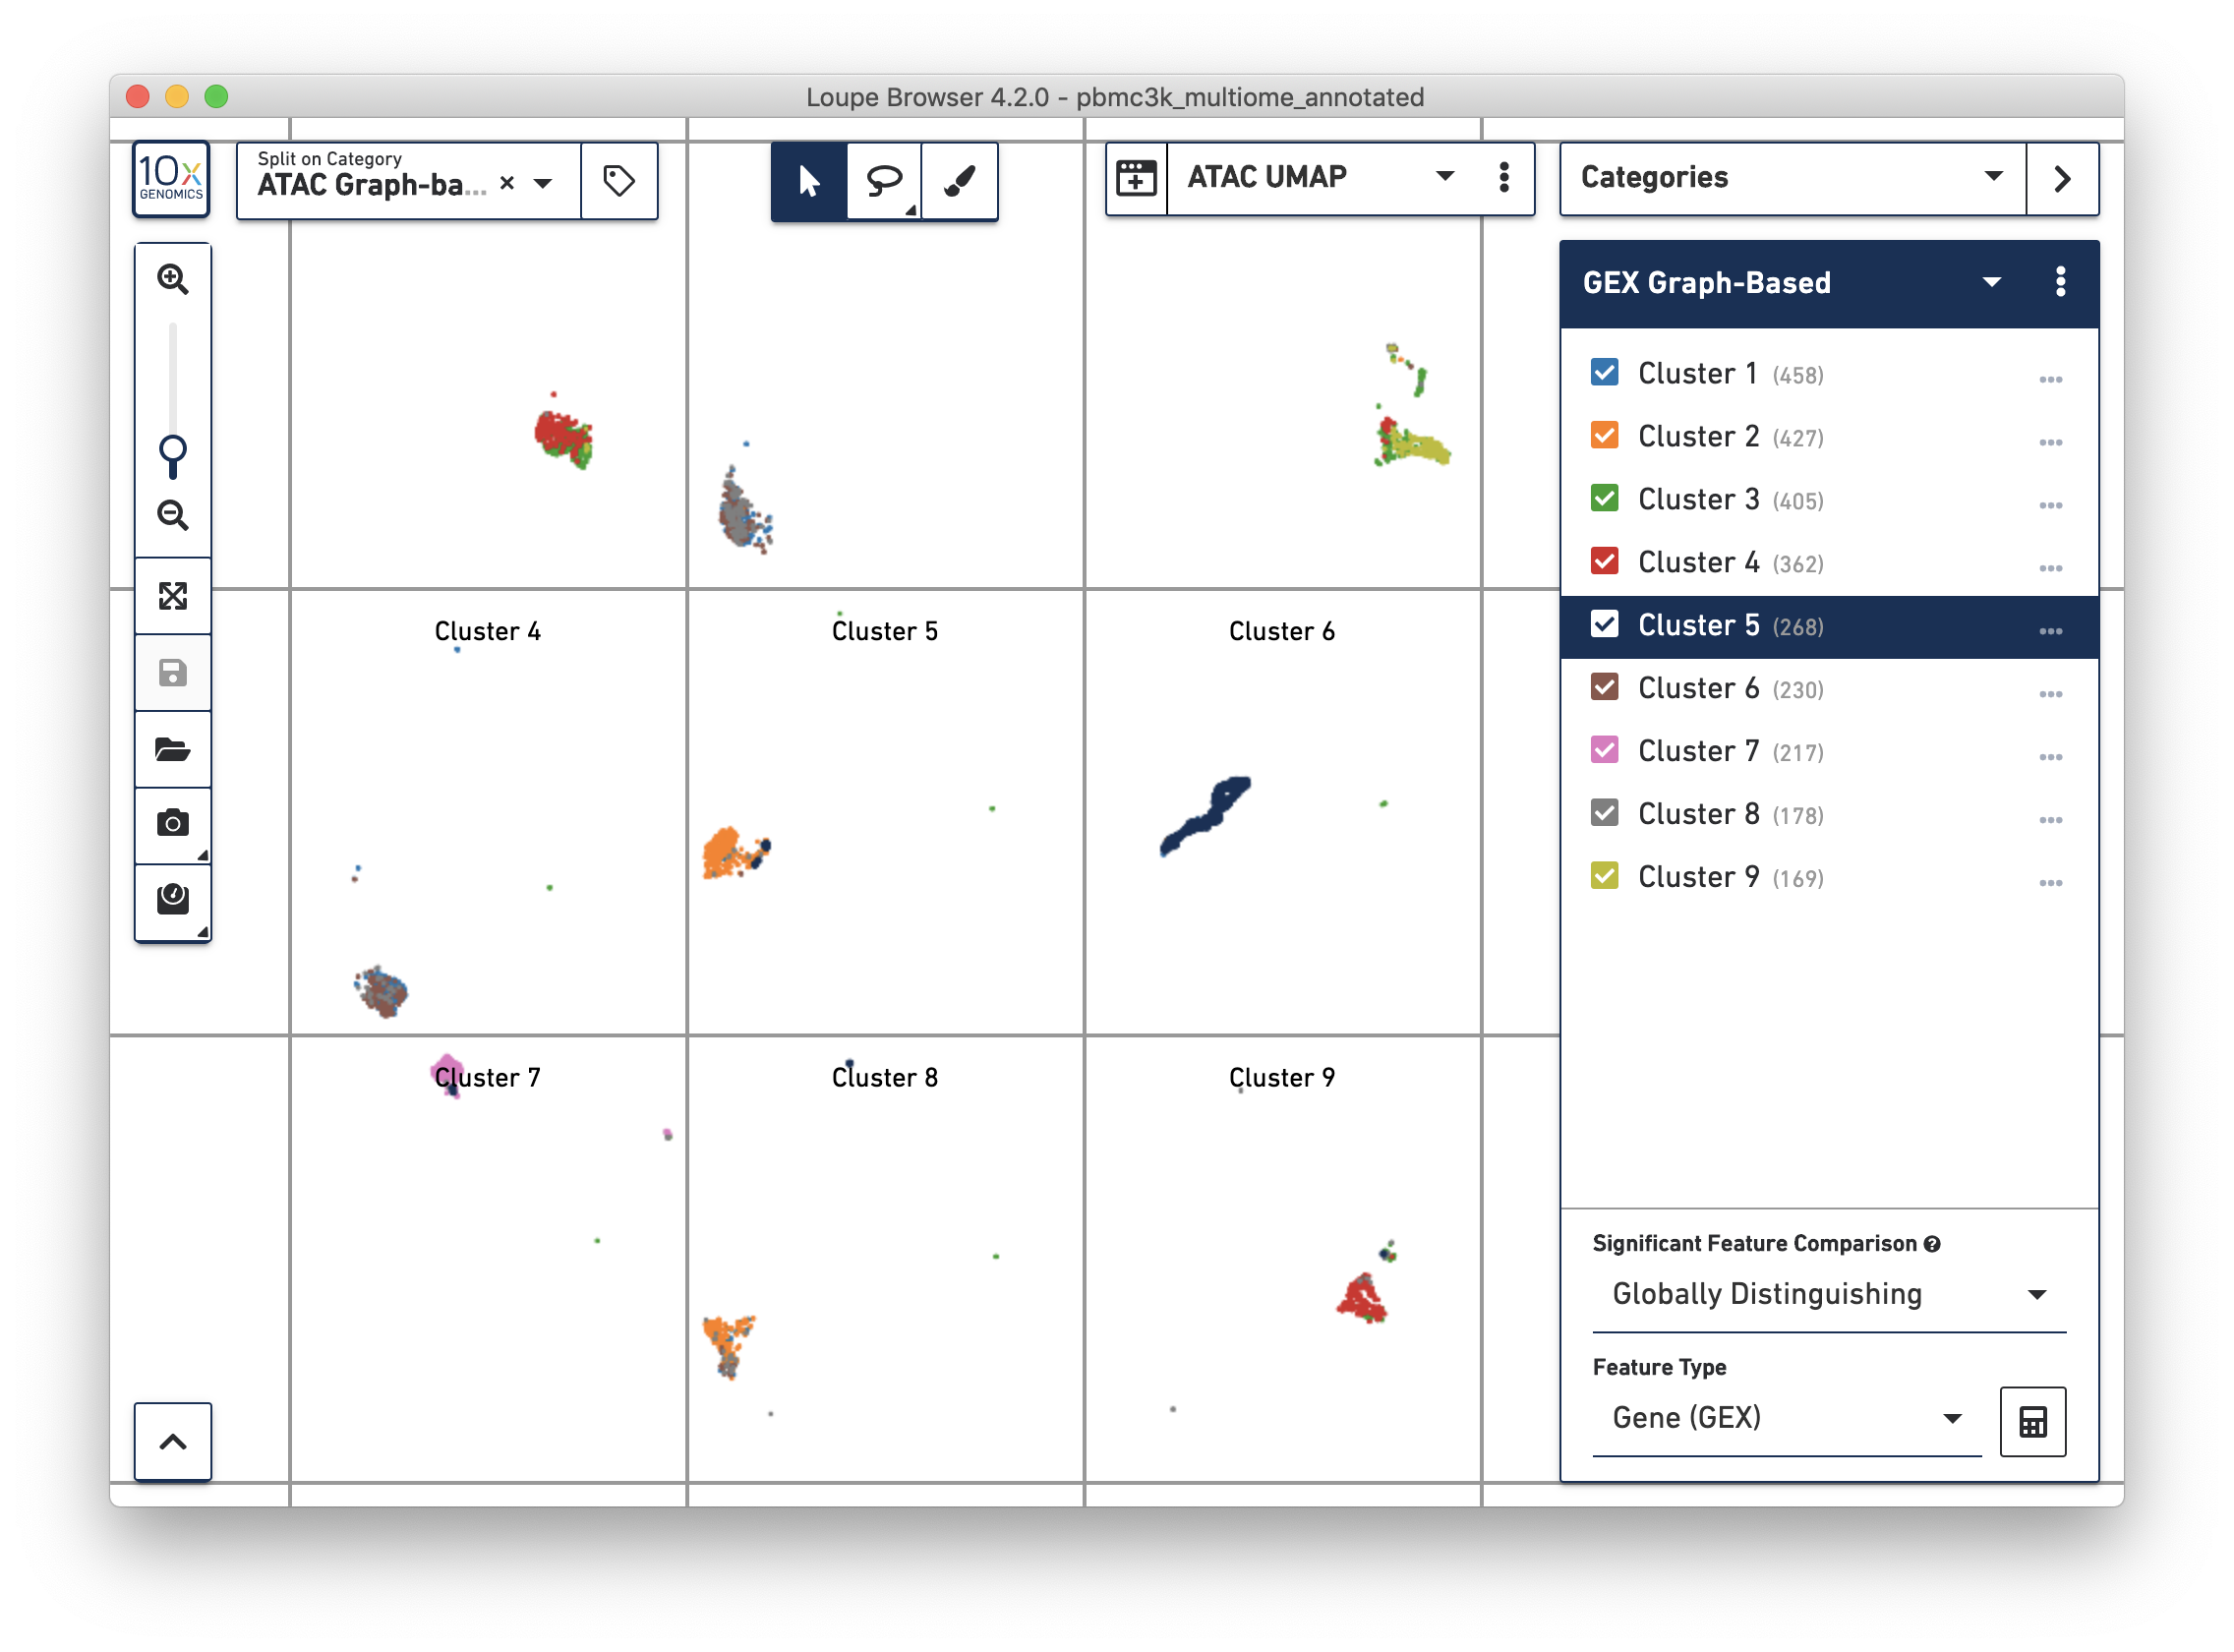
Alternatively, you may use Split View to explore the relationship between gene expression-derived and ATAC-derived clusters. In the graphic below, where the ATAC UMAP projection is split by ATAC Graph-Based clusters, the overlap between GEX Cluster 5 and ATAC Cluster 6 are apparent:
Loupe Browser 4.1 introduced linked windows, the ability to manipulate multiple views of the same data at the same time. Linked windows are very useful for multomic data, in order to look at how expression and accessibility patterns may be different across GEX- or ATAC-centered data. To open a linked window to show the GEX UMAP data, click on the Add Linked Window icon to the left of the active projection, and click on 'GEX UMAP'. This will open a GEX UMAP view of the data in a mini-window:
Most actions taken in one window will be reflected in all other windows. Hovering over a cell in GEX UMAP will reveal its position in ATAC UMAP; selecting a gene or peak in Expression/Accessibility View will be visible in all windows, and new clusters created in one window will be reflected in all linked windows. You may also choose to have a linked window open to make the Data Table, particularly the Peak Viewer, larger, while still having a full, large view of the underlying projection.
Clicking on the Category dropdown one more time will reveal a custom category -- "Annotated Cell Types". Select that category to reveal the cell type annotations derived from gene expression markers (see introduction for marker details). This category will be used for the remainder of the tutorial.
Changing the projection to Feature Plot in a multiomic dataset will by default show the relationship between the total number of UMI counts per cell (y-axis) and in-peak cut sites per cell (x-axis). This the same projection as the cross-sensitivity plot in the web summary, with non-cell barcodes excluded:
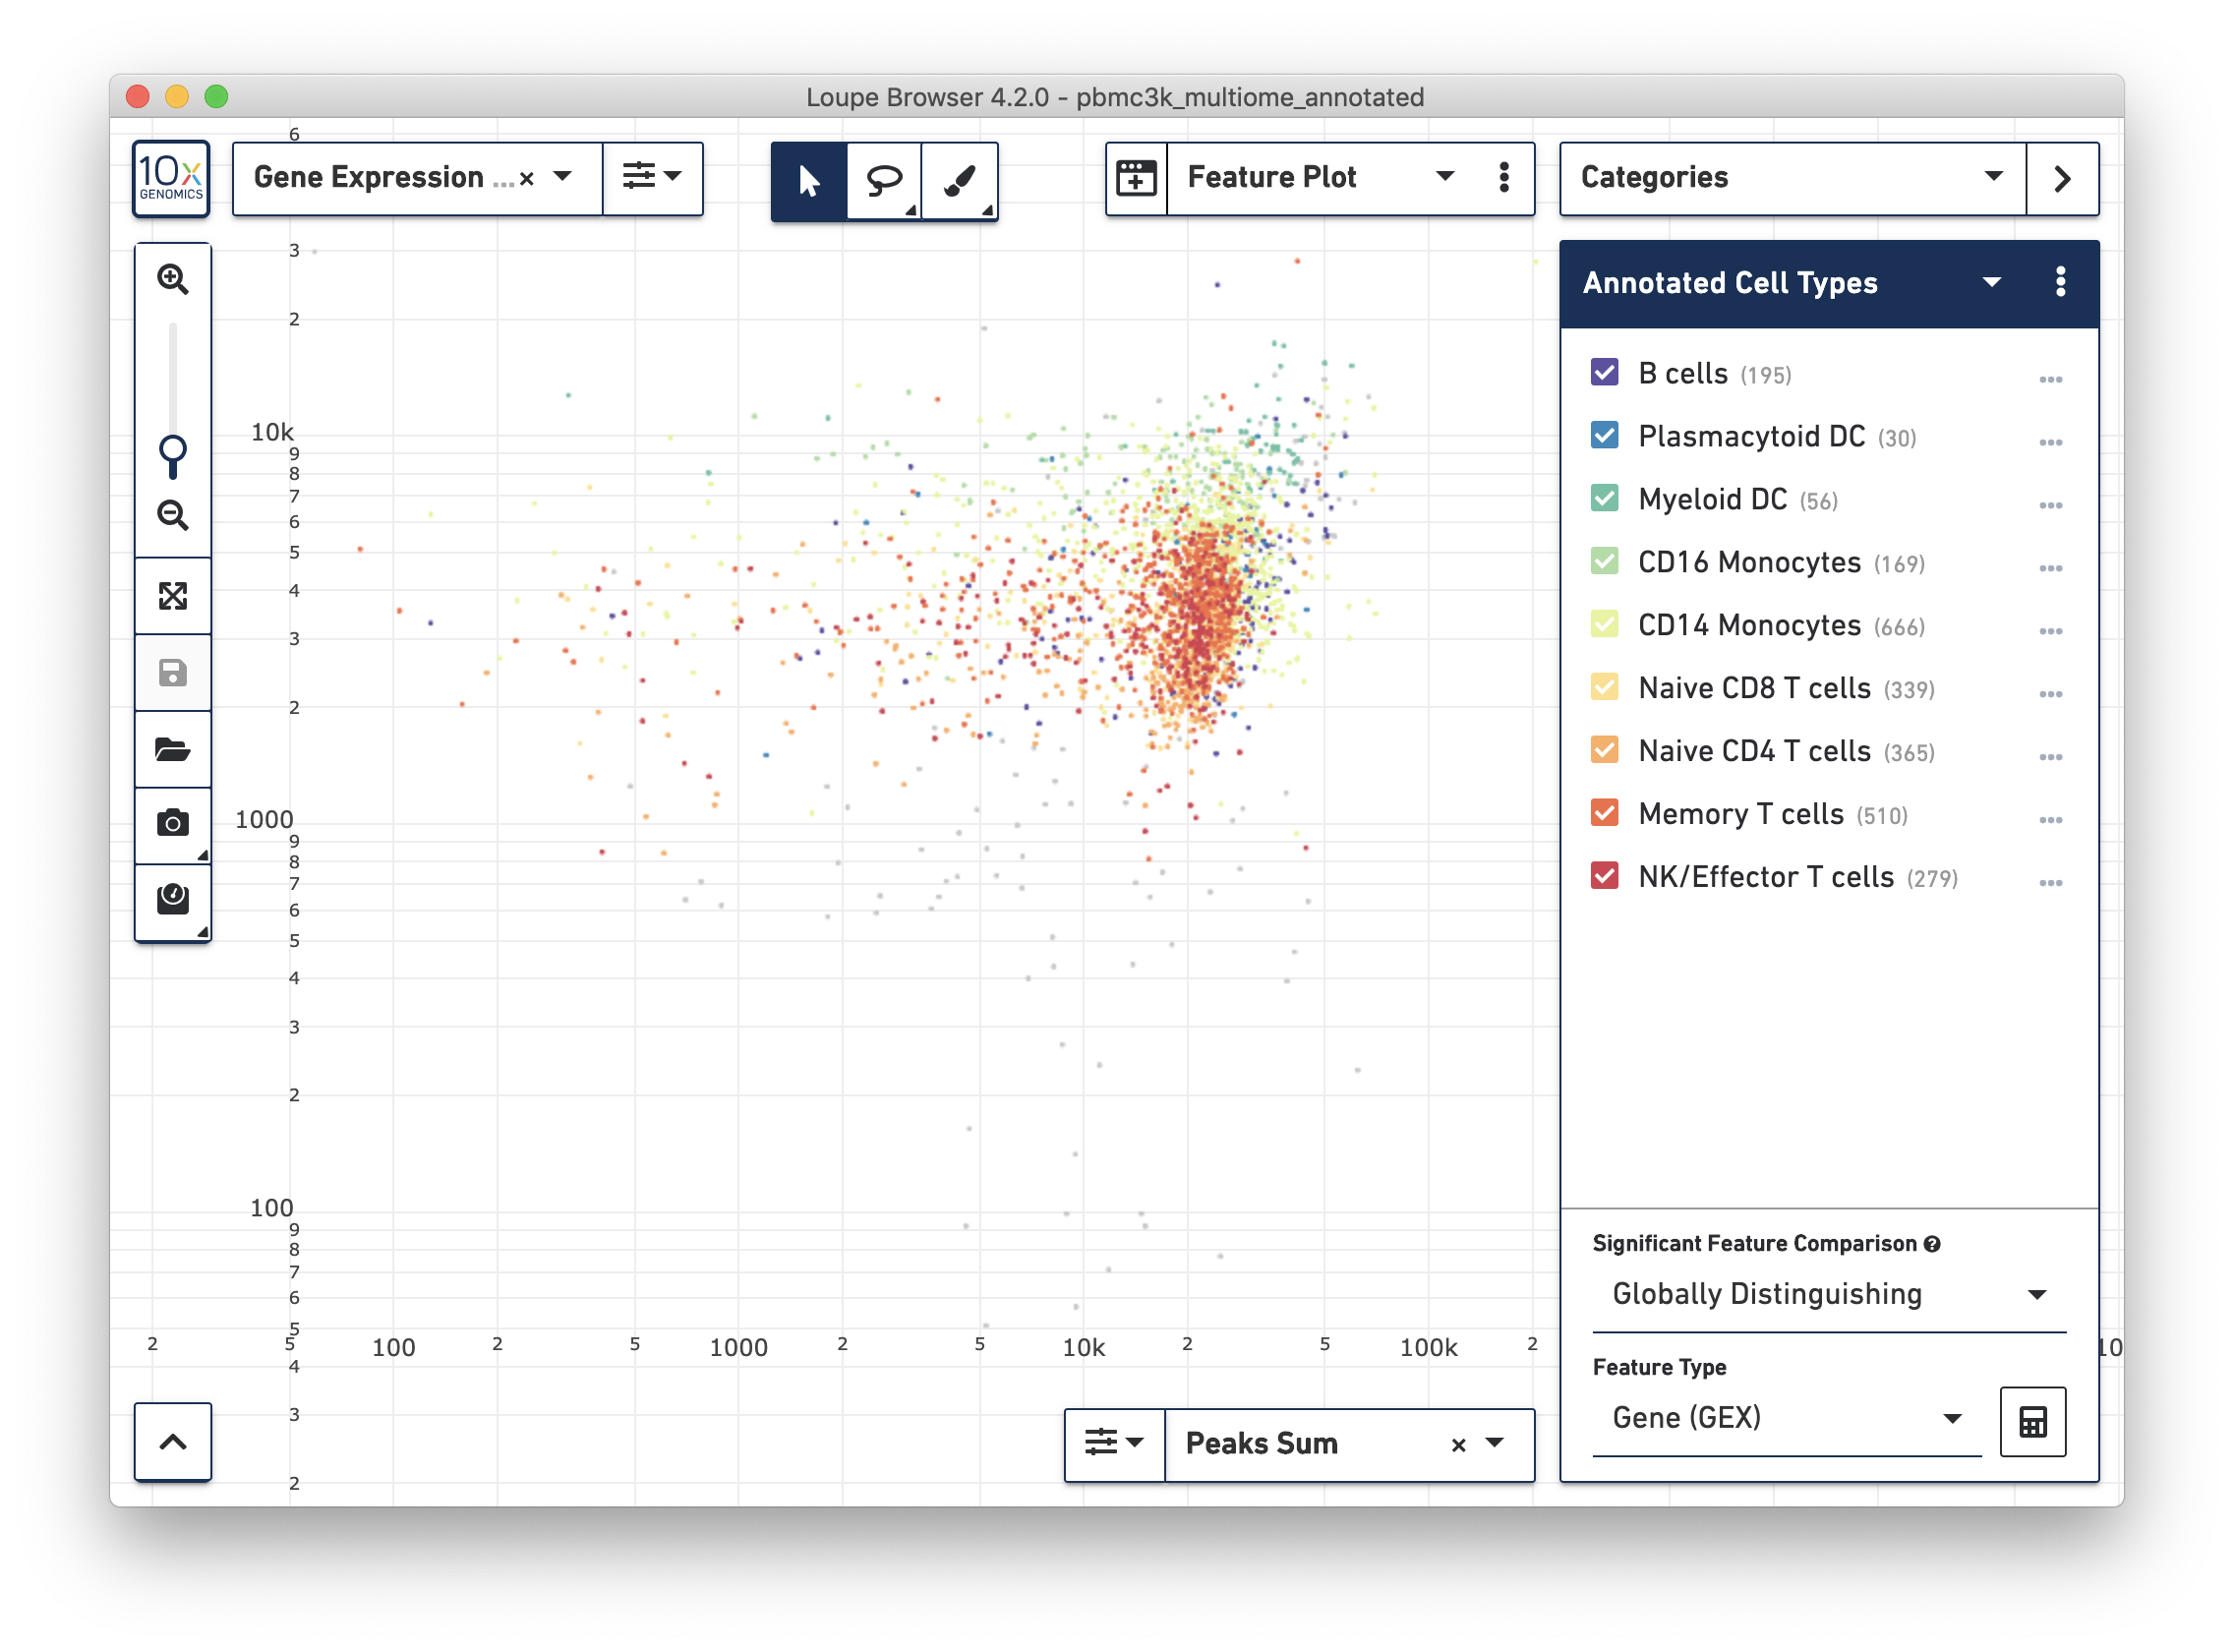
The example dataset is very clean in that most barcodes have both high UMI counts and number of cut sites. In noisier datasets, this plot will reveal whether any clusters are driven primarily by differential sensitivity in either the gene expression or ATAC assay.
The Peak Viewer is available for Multiome ATAC + Gene Expression data, just like Single Cell ATAC data. It is still possible to navigate to a region of the genome or a particular gene to see peaks surrounding that particular gene. However, there is now a third option. Clicking on the dropdown at the top of the Peak Viewer menu shows 'Feature Links':
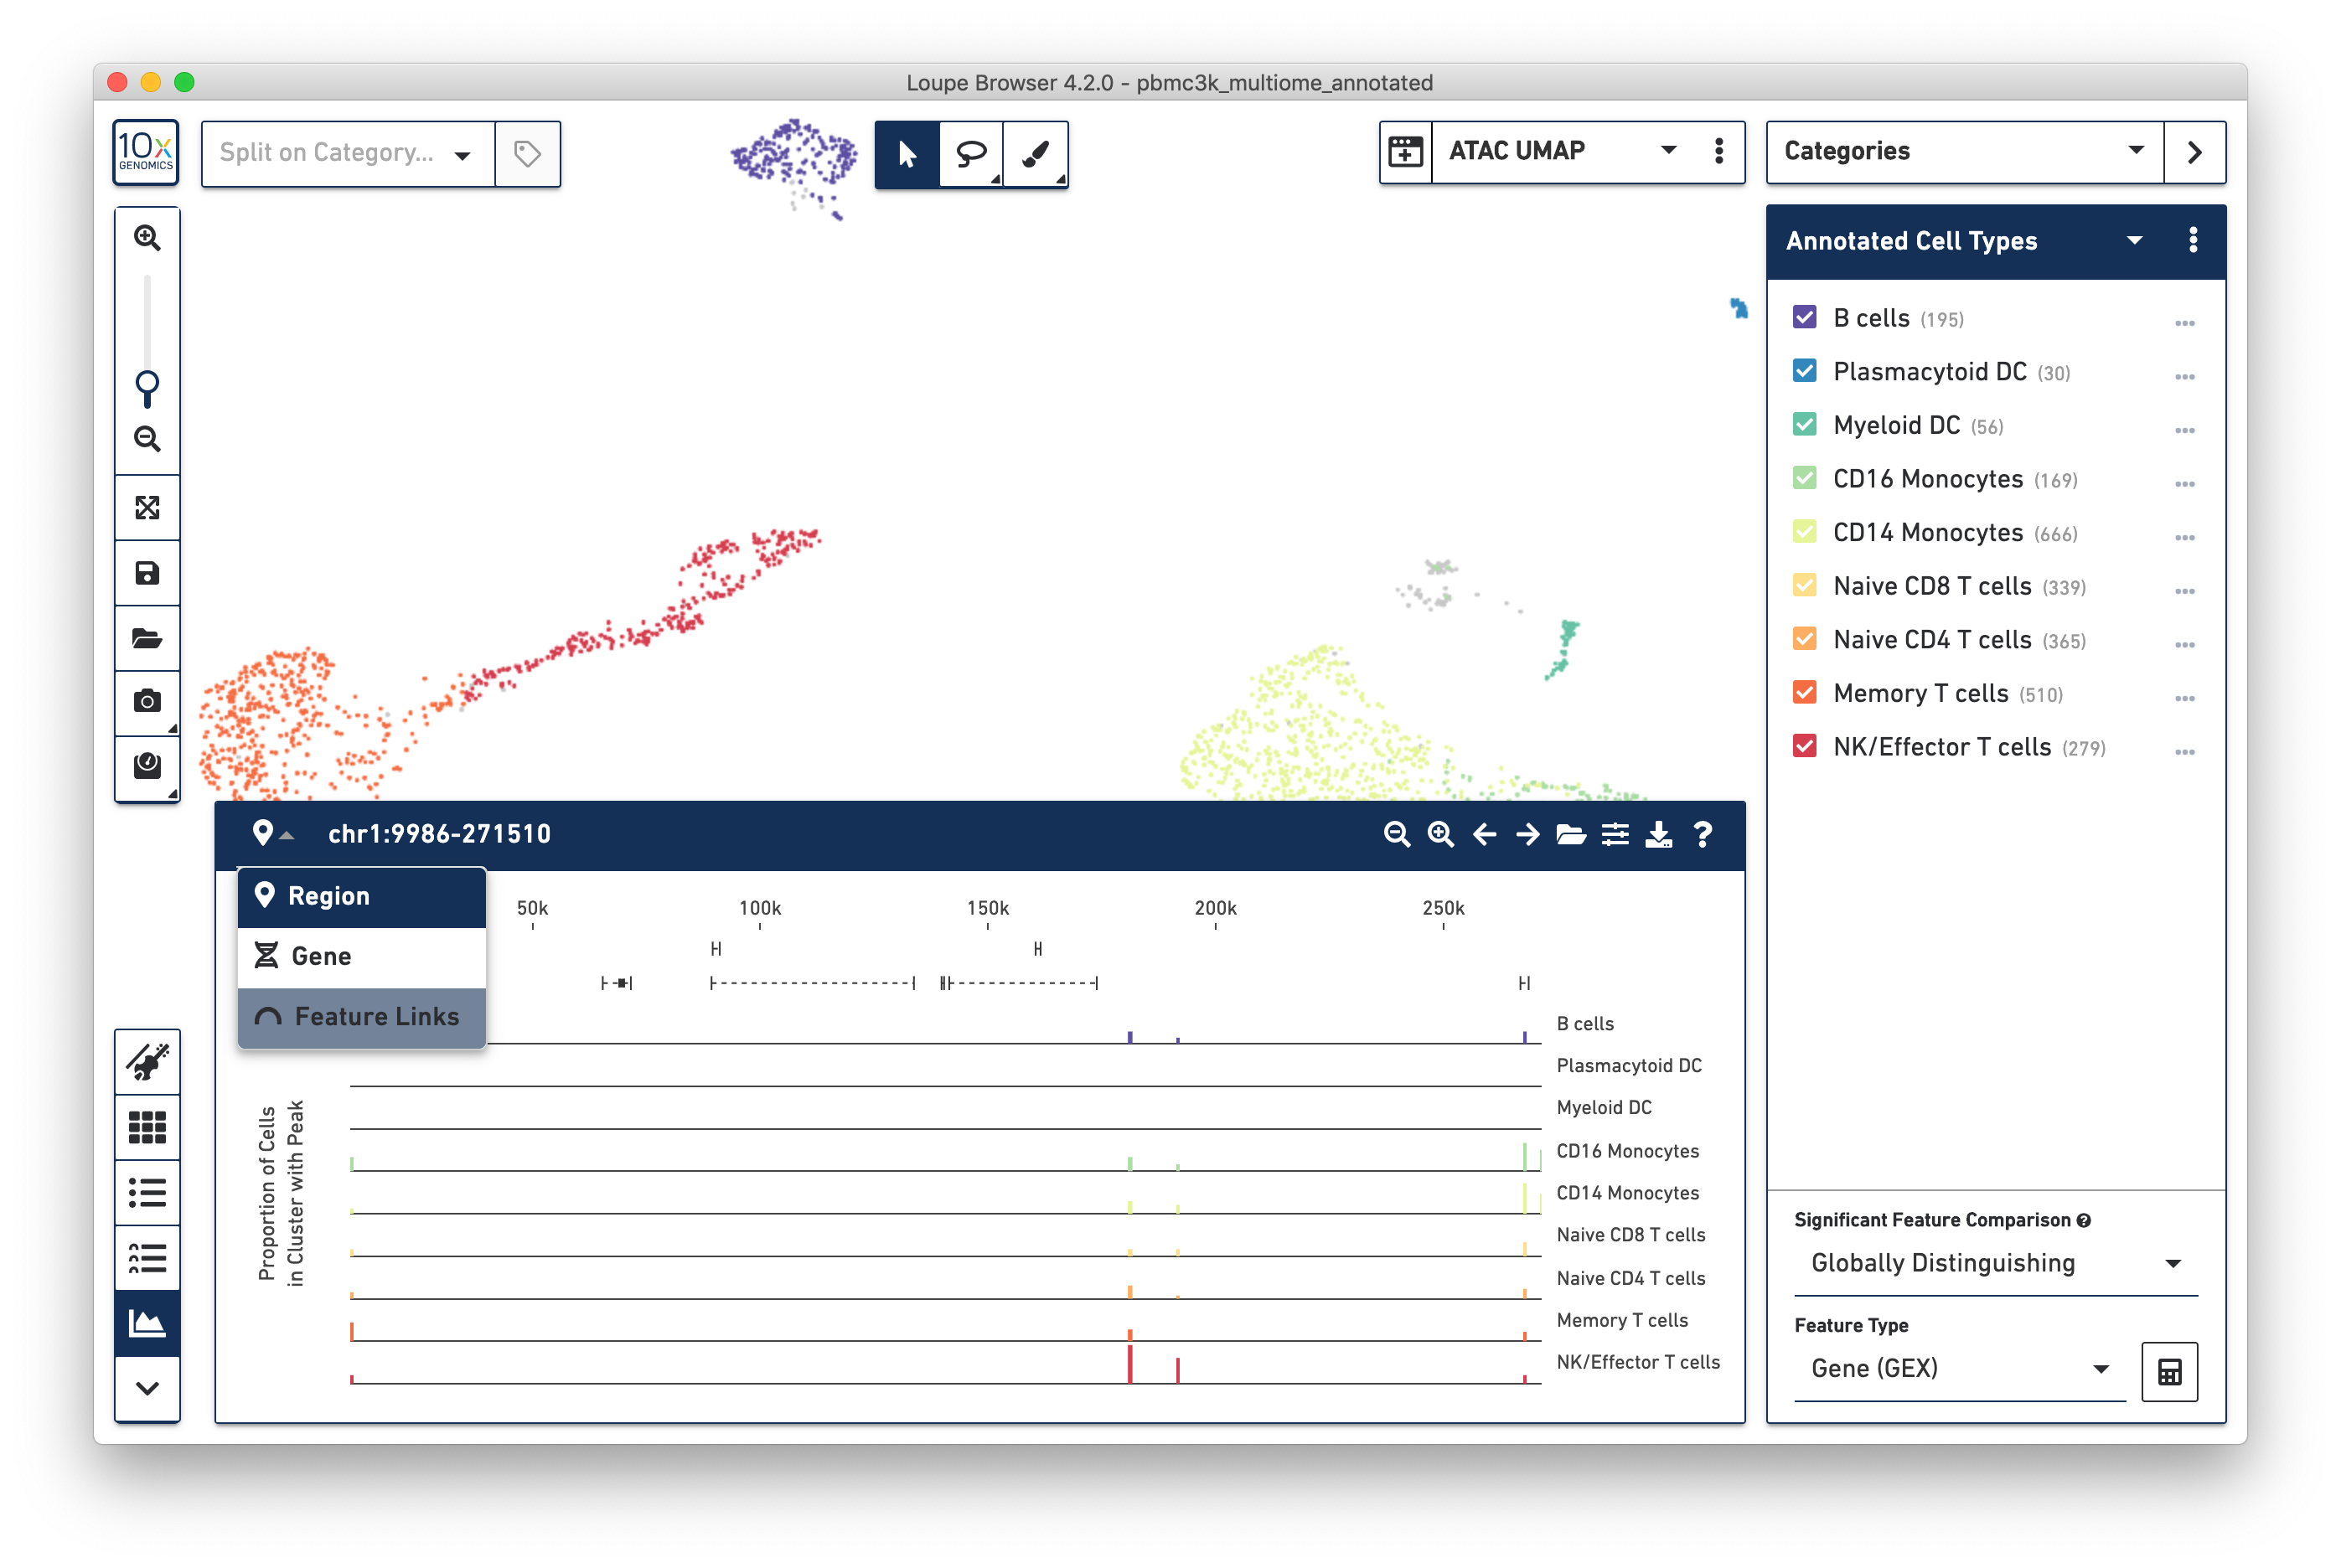
This reveals the Feature Link Viewer, which will show relationships between gene features to peak features, or peaks to peaks. Since this analysis is so central to analyzing multiome ATAC + gene expression data, it is covered in depth on the next page.