Cell Ranger ARC2.0, printed on 04/08/2025
The computational pipeline cellranger-arc count for Single Cell Multiome ATAC + Gene Expression involves the following analysis steps:
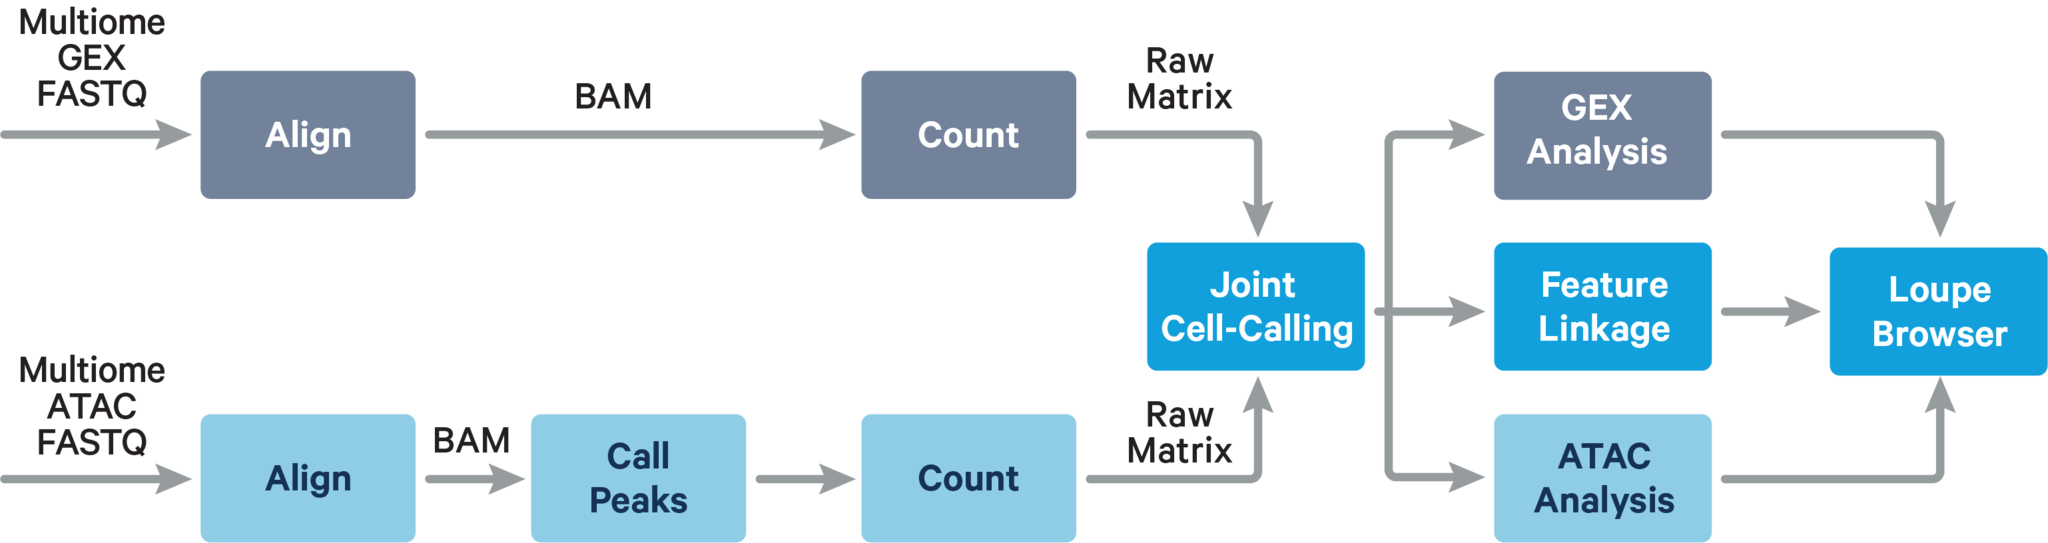
The main components of cellranger-arc count include:
We first detect the location of the 10x Barcode within the i5 index read: the first 16 bases or the last 16 bases and in either the forward or reverse orientation. We pick the location that maximizes the fraction of barcodes that are valid. Once the location is determined we perform Hamming distance 1 error correction to account for sequencing error. Each barcode sequence is checked against an allowed list of valid barcode sequences, and the frequency of each valid barcode is counted. We attempt to error correct invalid barcodes that are not on the allowed list, by finding all valid barcodes within 1 mismatch of the observed sequence, and scoring them based on the abundance of that barcode in the read data and quality value of the incorrect bases. An observed invalid barcode is corrected if it has > 90% probability of being the real barcode based on this model.
Cell Ranger ARC performs reference-based analysis and requires adapter and primer oligo sequence to be trimmed off before mapping confidently. In the current chemistry, the 3' end of a read (the end of the read sequence) may contain the reverse complement of the primer sequence, if the read length is greater than the length of the genomic fragment. We use an algorithm that is similar to the tool cutadapt tool to identify the reverse complement of the primer sequence at the end of each read, and trim it from the read prior to alignment.
Cell Ranger ARC performs reference-based analysis and requires adapter and primer oligo sequence to be trimmed off before mapping confidently. In the current chemistry, the 3' end of a read (the end of the read sequence) may contain the reverse complement of the primer sequence, if the read length is greater than the length of the genomic fragment. We use an algorithm that is similar to the tool cutadapt tool to identify the reverse complement of the primer sequence at the end of each read, and trim it from the read prior to alignment.
Then, the trimmed read-pairs are aligned to a specified reference using a modified version of the BWA-MEM algorithm. We align read pairs using a fixed prior on the insert size distribution, which is assumed to be gaussian with a mean of 250 and standard deviation of 150. BWA-MEM divides read pairs into batches and determines this number on the fly. The results of either approach are very similar especially for high MAPQ read pairs that are used in downstream analyses.
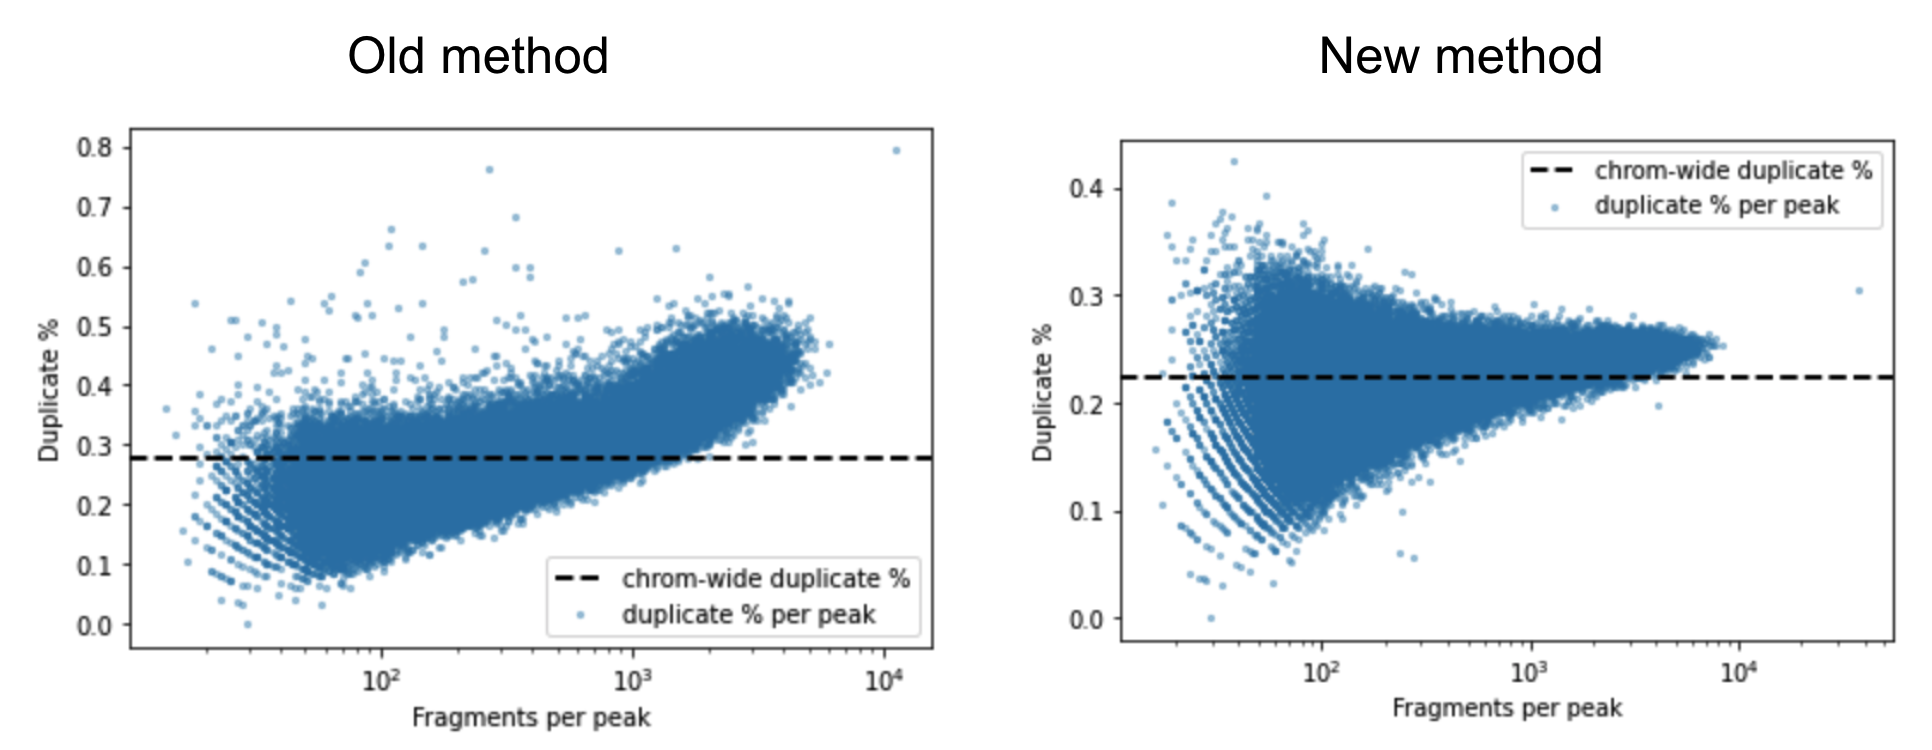
A barcoded fragment that represents a template molecule is amplified during the library preparation process and this results in multiple read pairs being sequenced that arise from the same original template molecule. One of these read pairs is selected to represent the template and all the other read pairs are marked as duplicates and filtered out of downstream analyses. This helps avoid any systematic biases in the estimation of open chromatin due to PCR efficiencies for example. To mark duplicates each read pair is annotated with a start position, end position and its barcode. The start and end positions are adjusted for soft clipping. For computational efficiency reasons, we transform the barcode string into a 64-bit integer using a hash function. When a group of read pairs share the same (start, end, hashed barcode), one of them is labeled as unique and the rest are labeled duplicates. If the unique read passes the filters described in the next paragraph, this is the only read pair that is reported as a fragment in the fragment file. Note that versions of Cell Ranger ARC <= 1.2 marked duplicates based on the start and end position alone. The previous algorithm was overly aggressive in marking duplicates as evidenced by the figure below. The estimated duplicate rate must be uniform throughout the genome and independent of the accessibility of the region. In the old method we observe that the duplicate rate actually increases as a function of accessibility, which is a signal that we were overly aggressive in marking duplicates.
While processing the group of identically aligned read-pairs as described above, once the original fragment is marked, Cell Ranger ARC determines if the fragment is mapped with MAPQ > 30 on both reads, is not mitochondrial, not chimerically mapped, and maps to a primary contig (a gene-containing contig). If the fragment passes these filters, Cell Ranger ARC creates one entry in the fragments.tsv.gz file marking the start and end of the fragment after adjusting the 5' ends of the read-pair to account for transposition, during which the transposase occupies a region of DNA 9 base pairs long (see figure). With this entry Cell Ranger ARC associates the most common barcode observed for the group of read-pairs and the number of times this fragment is observed in the library (size of the group). Each entry is tab-separated and the file is position-sorted and then run through the SAMtools tabix command with default parameters.
The goal of the peak calling algorithm in the single cell ATAC assay is to identify which distinct regions of the genome, known as peaks, are the key features of interest. This differs from single cell gene expression assays, which use published gene annotations to define features. Called peaks in ATAC data are thus analogous to genes in gene expression data in the resulting feature-barcode matrix.
In the single-cell ATAC assay, the transposase enzyme cuts nuclear DNA at accessible regions, creating sequenceable fragments of DNA where each end identifies a transposase cut site. Because each sample may have cells with different patterns of chromatin accessibility, peaks must be called directly from ATAC data with each run of the pipeline. In order to accurately call peaks, the desired signal (open chromatin causing localized enrichment in cut sites) must be distinguished from background noise (random transposase activity throughout the genome). As both signal and noise can vary across different datasets and locally across the genome, the algorithm generates a global peak threshold followed by local refinements, as described below.
As the ends of each fragment are indicative of regions of open chromatin, Cell Ranger ARC first analyzes the combined signal from these fragments, across all cells in the dataset, to determine regions of the genome enriched for accessibility to the transposase and thus of potential regulatory and functional significance. This method of identifying peaks uses reads pooled from all barcodes to maximize the signal from all mapped genomic fragments.
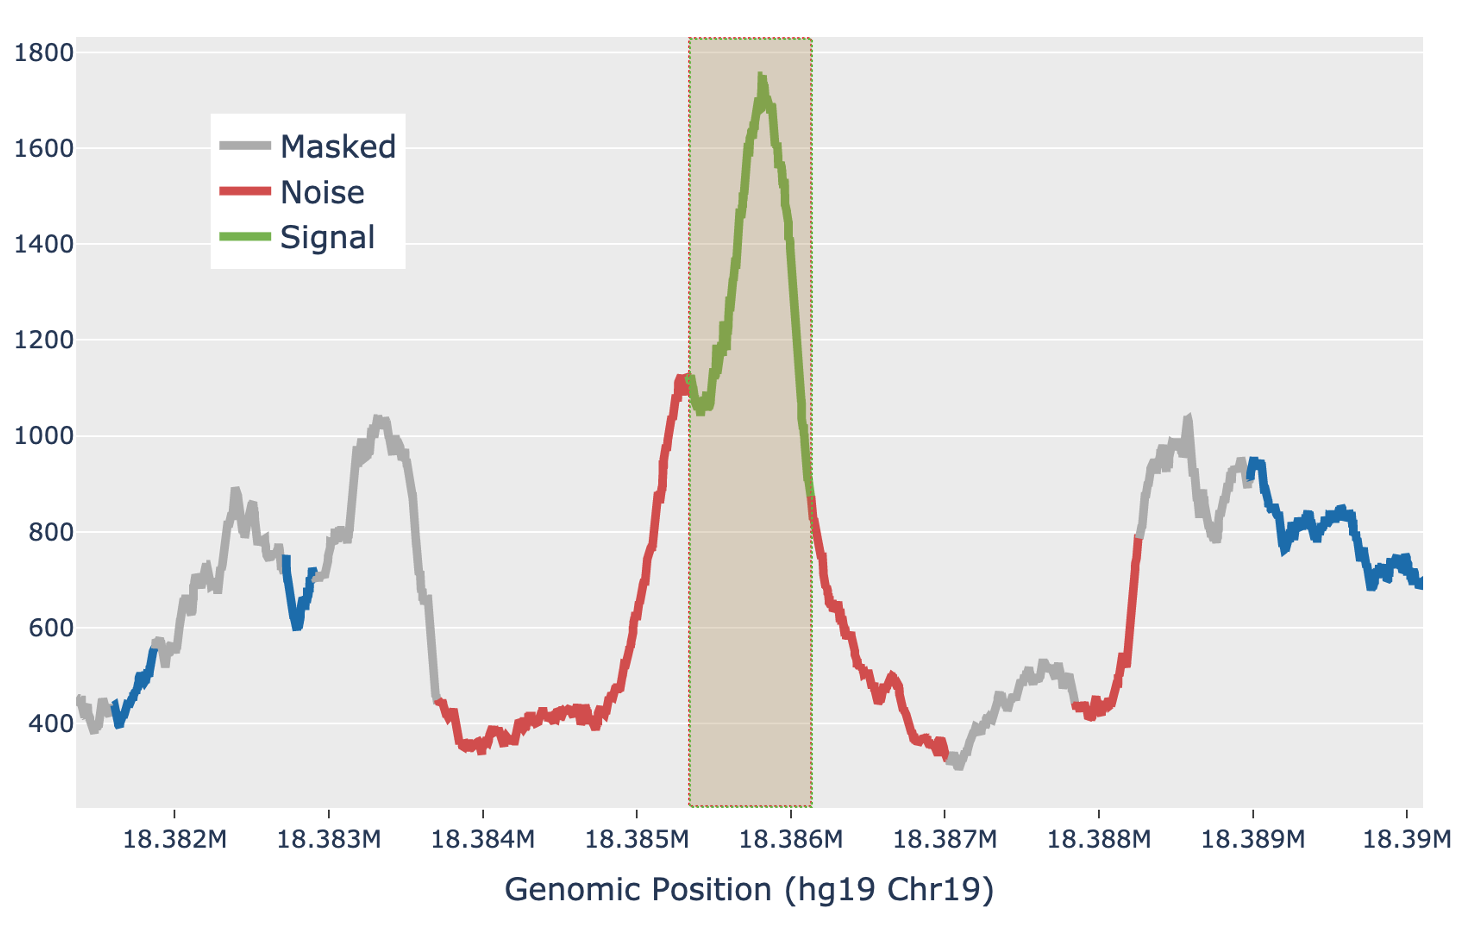
The fragment ends, corrected for the estimated binding position of the transposase enzyme and de-duplicated, are identified in the position-sorted fragments.tsv.gz file produced by Cell Ranger ARC. Taking these data, the number of transposition events at each position in the genome are counted. Because of local variability in transposase binding affinity, this raw signal is smoothed with a 401bp moving window sum to generate a smoothed signal profile, so that the signal at each genomic position represents the total number of transposase cut sites within the window around that position across all barcodes.
Genomic loci with higher counts are more likely to represent peaks than those with lower counts. To separate them, we count the number of genomic loci with each count and fit the underlying distribution to a mixture model of signal and noise components (figure below). The background is fit with a negative binomial distribution to capture stochastic noise and a geometric distribution to capture zero-inflation, similar to the Zero-Inflated Negative Binomial Algorithm (ZINBA). The peak signal is fit with a negative binomial distribution. The fitting is performed with an expectation-maximization iterative algorithm. The Cell Ranger ARC 2.0 algorithm includes significant improvements to this fitting process to better initialize the fitting and avoid local maxima.
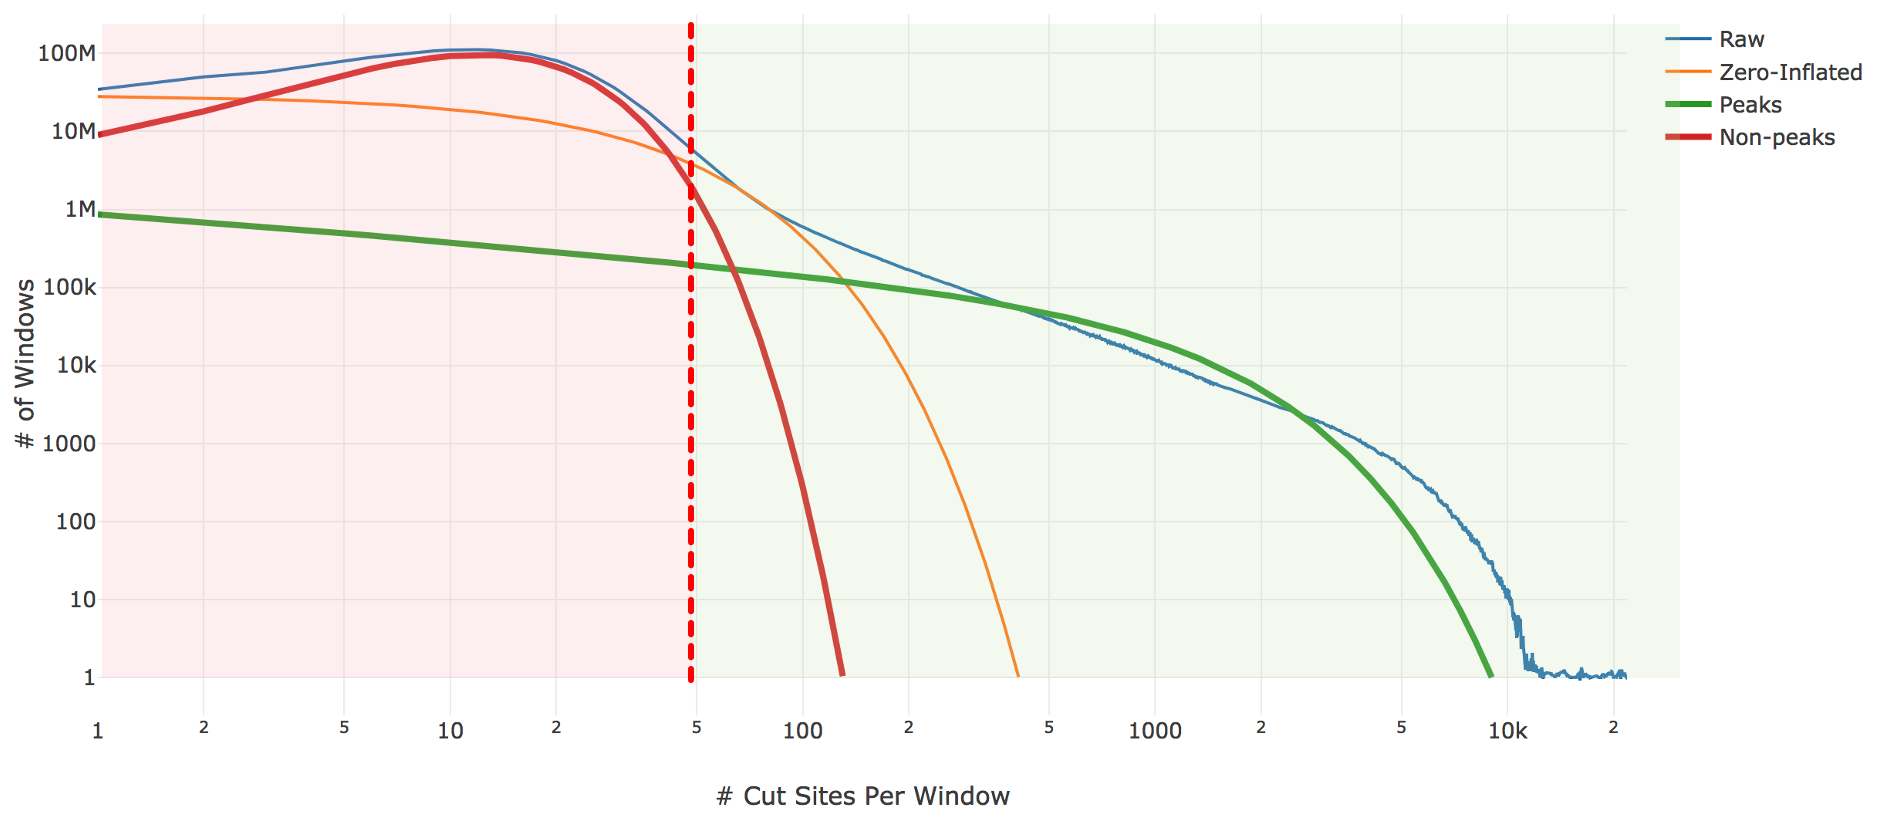
| Above: A diagram of the three-component fitting process for setting the initial global peak threshold. The x-axis shows (in logarithmic scale) the count of cut sites near a particular genomic locus, while the y-axis shows (again in logarithmic scale) the number of genomic windows with that cut-site count. The blue line is the observed data from our sample which the algorithm attempts to fit. The other three lines are the final fit: orange shows the geometric zero-inflated component, red the negative binomial non-peak background component, and green the negative binomial peak component. The sum of these three components closely approximates the empirical blue curve. The peak threshold (vertical red line) is set so at least 95% of the non-peak components are less than the threshold. |
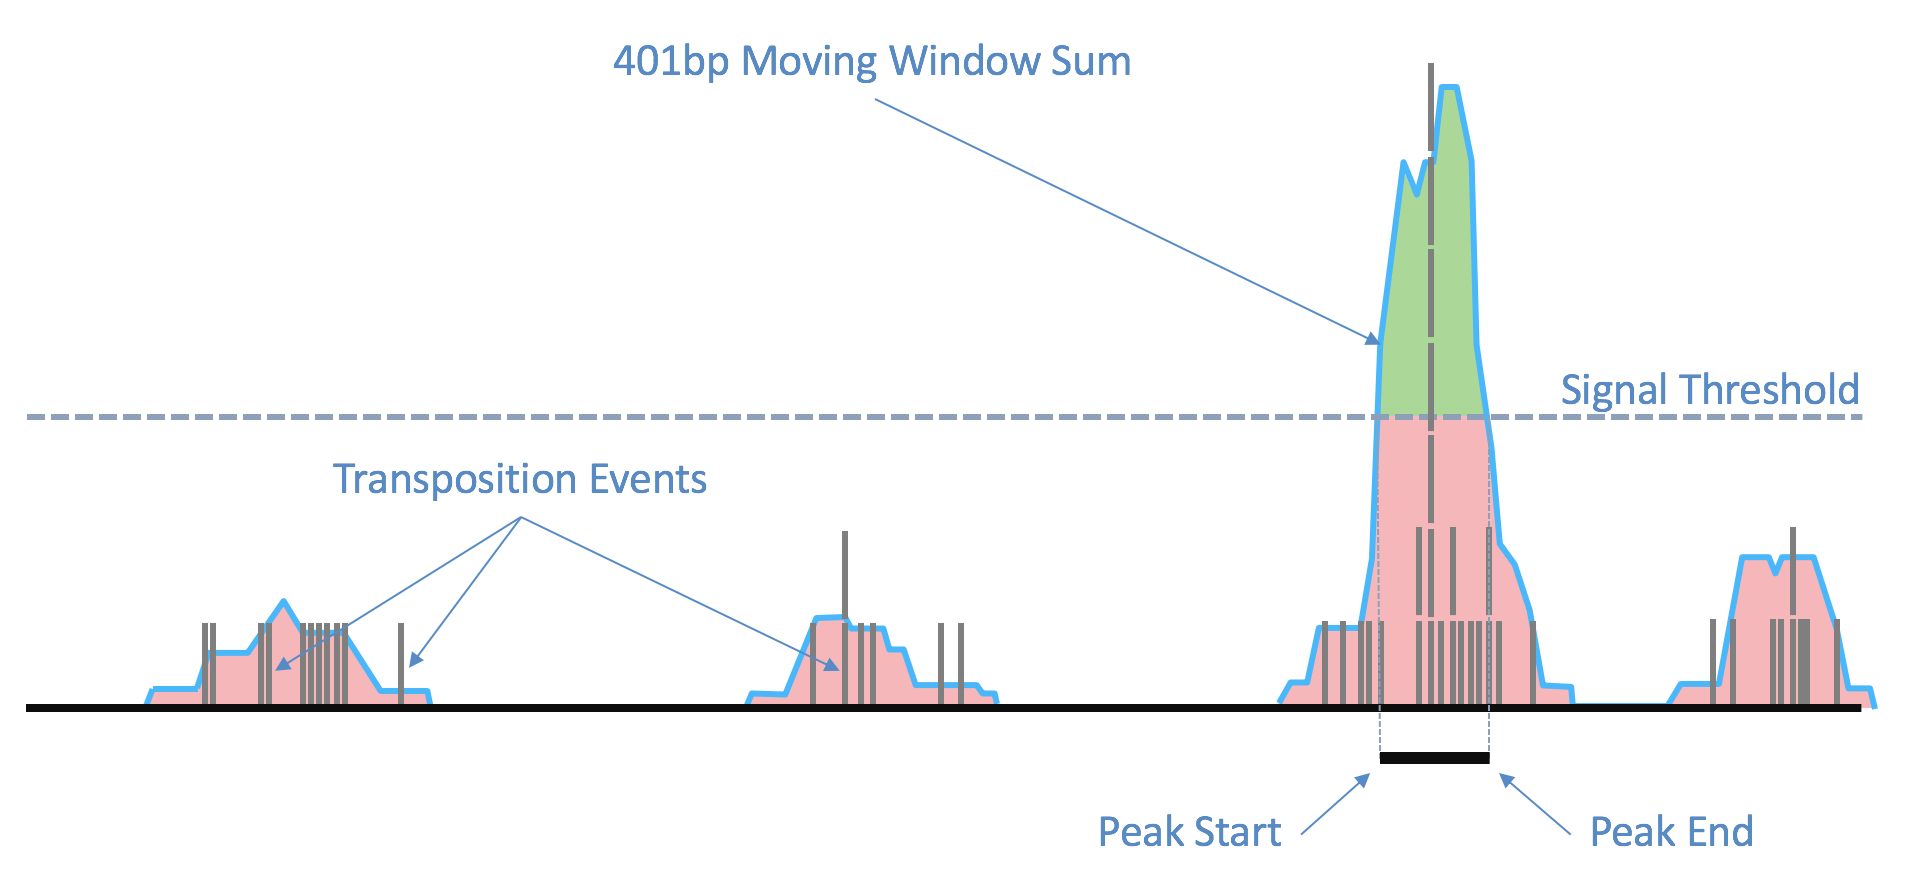
| Above: Raw transposition events are used to produce a local smoothed signal track with a 401bp moving window sum. After fitting and selecting a global peak threshold, contiguous regions with signal above the threshold (shown in green) are produced as candidate peak calls. |
In Cell Ranger ARC v1.2 and earlier, the algorithm ended after global threshold generation, reporting as peaks all contiguous regions with smoothed signal above this global threshold. This sometimes produced peak calls that were too large, interfering with accurate identification of motifs and local regions of interest. Furthermore, the algorithm was susceptible to local differences in background noise across the genome. Therefore, in Cell Ranger ARC 2.0 the algorithm includes further local refinement of candidate peak calls.
For each candidate region, the region is first padded by 5 Kb on either side to include local background context. The smoothed signal in the padded region is transformed with a 300bp Ricker wavelet transformation. Local maxima in the transformed signal are identified and putative peaks generated by extending the local maxima down to the total prominence of the maximum. Each putative peak is then filtered for local signal-to-noise ratio. The median signal inside the putative peak is used as the signal, while the noise is measured as the median signal in a fixed window outside of the peak, while also masking out any other putative peaks in the local region (figure below). Cell Ranger ARC uses a Bayesian posterior probability estimate to exclude peaks that do not have a signal-to-noise ratio above 1.5 with at least 95% confidence. This Bayesian approach allows the use of a lower signal-to-noise threshold without overcalling peaks in very low depth regions.
| Above: a diagram of how the local signal-to-noise estimate is performed for a single putative peak in a candidate region. The green section of the signal shows the putative peak under examination, with the peak signal measured as the median value across the green section. The grey sections are masked out, as they are other putative peaks and so are not used to estimate the local background. The red sections are used for local background estimates, with the peak background as the median value across all red sections. |
Finally, an extension step is performed on the filtered peaks. Cell Ranger ARC examines all fragments inside a peak, each of which has two cut sites, one at each end. If there are a large number of fragments which have one cut site inside the peak and the other outside, the peak is padded to wholly contain more of those fragments.
Once the peak locations have been determined we construct the peak-barcode matrix using peaks as the rows and barcodes as the columns. Each entry in this matrix is the number of cut-sites that are contained within the corresponding peak associated with the corresponding barcode.
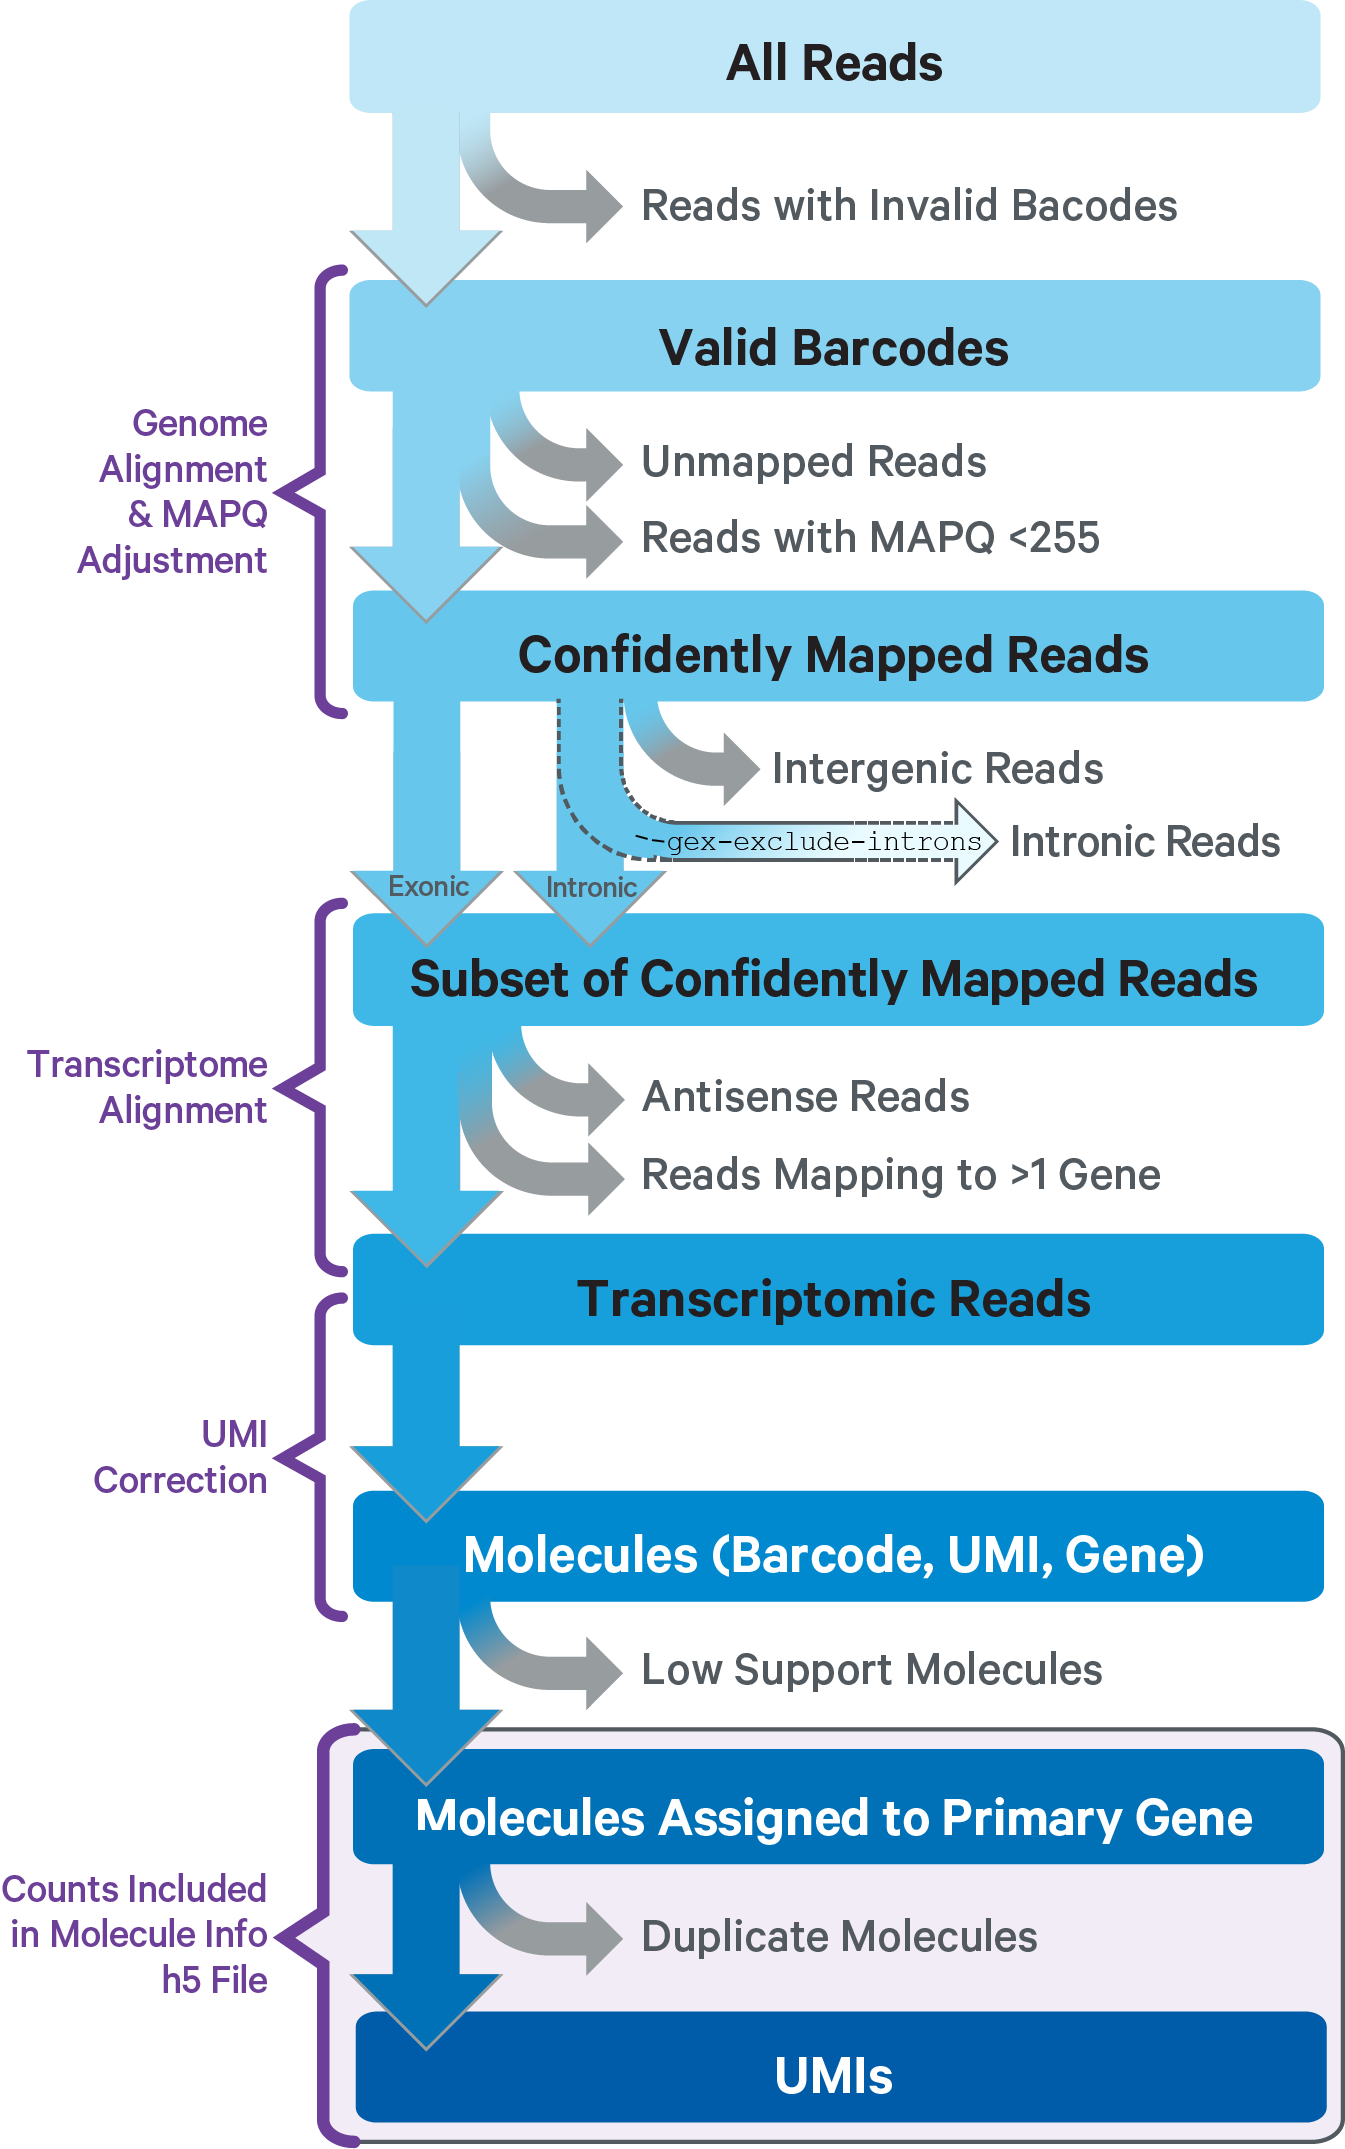
This sub-pipeline performs data analysis to construct the raw GEX count matrix from the input GEX FASTQs and reference. The key read processing steps are outlined in this figure and described in the text below:
A full length cDNA construct is flanked by the 30 bp template switch oligo (TSO) sequence, "AAGCAGTGGTATCAACGCAGAGTACATGGG" on the 5' end and poly-A on the 3' end. Some fraction of sequencing reads are expected to contain either or both these sequences, depending on the library fragment size distribution. Reads derived from short RNA molecules are more likely to contain either or both TSO and poly-A sequence compared to reads derived from longer RNA molecules.
Since the presence of non-template sequence in the form of either template switch oligo (TSO) or poly-A, low-complexity ends confound read mapping, TSO sequence is trimmed from the 5' end of read 2 and poly-A is trimmed from the 3' end prior to alignment. Trimming improves the sensitivity of the assay as well as the computational efficiency of the software pipeline.
Tags ts:i and pa:i in the output BAM files indicate the number of TSO
nucleotides trimmed from the 5' end of read 2 and the number of poly-A
nucleotides trimmed from the 3' end. The trimmed bases are present in the
sequence of the BAM record and are soft clipped in the CIGAR string.
For GEX reads, Cell Ranger ARC uses an aligner called STAR, which peforms splicing-aware alignment of reads to the genome. Cell Ranger ARC then uses the transcript annotation GTF to bucket the reads into exonic, intronic, and intergenic, and by whether the reads align (confidently) to the genome. A read is exonic if at least 50% of it intersects an exon, intronic if it is non-exonic and intersects an intron, and intergenic otherwise.
GEX MAPQ Adjustment: For reads that align to a single exonic locus but also align to 1 or more non-exonic loci, the exonic locus is prioritized and the read is considered to be confidently mapped to the exonic locus with MAPQ 255.
Cell Ranger ARC further aligns exonic and intronic confidently mapped reads to annotated transcripts by examining their compatibility with the transcriptome. As shown below, reads are classified based on whether they are sense or antisense and based on whether they are exonic, intronic or whether their splicing pattern is compatible with transcript annotations associated with that gene.
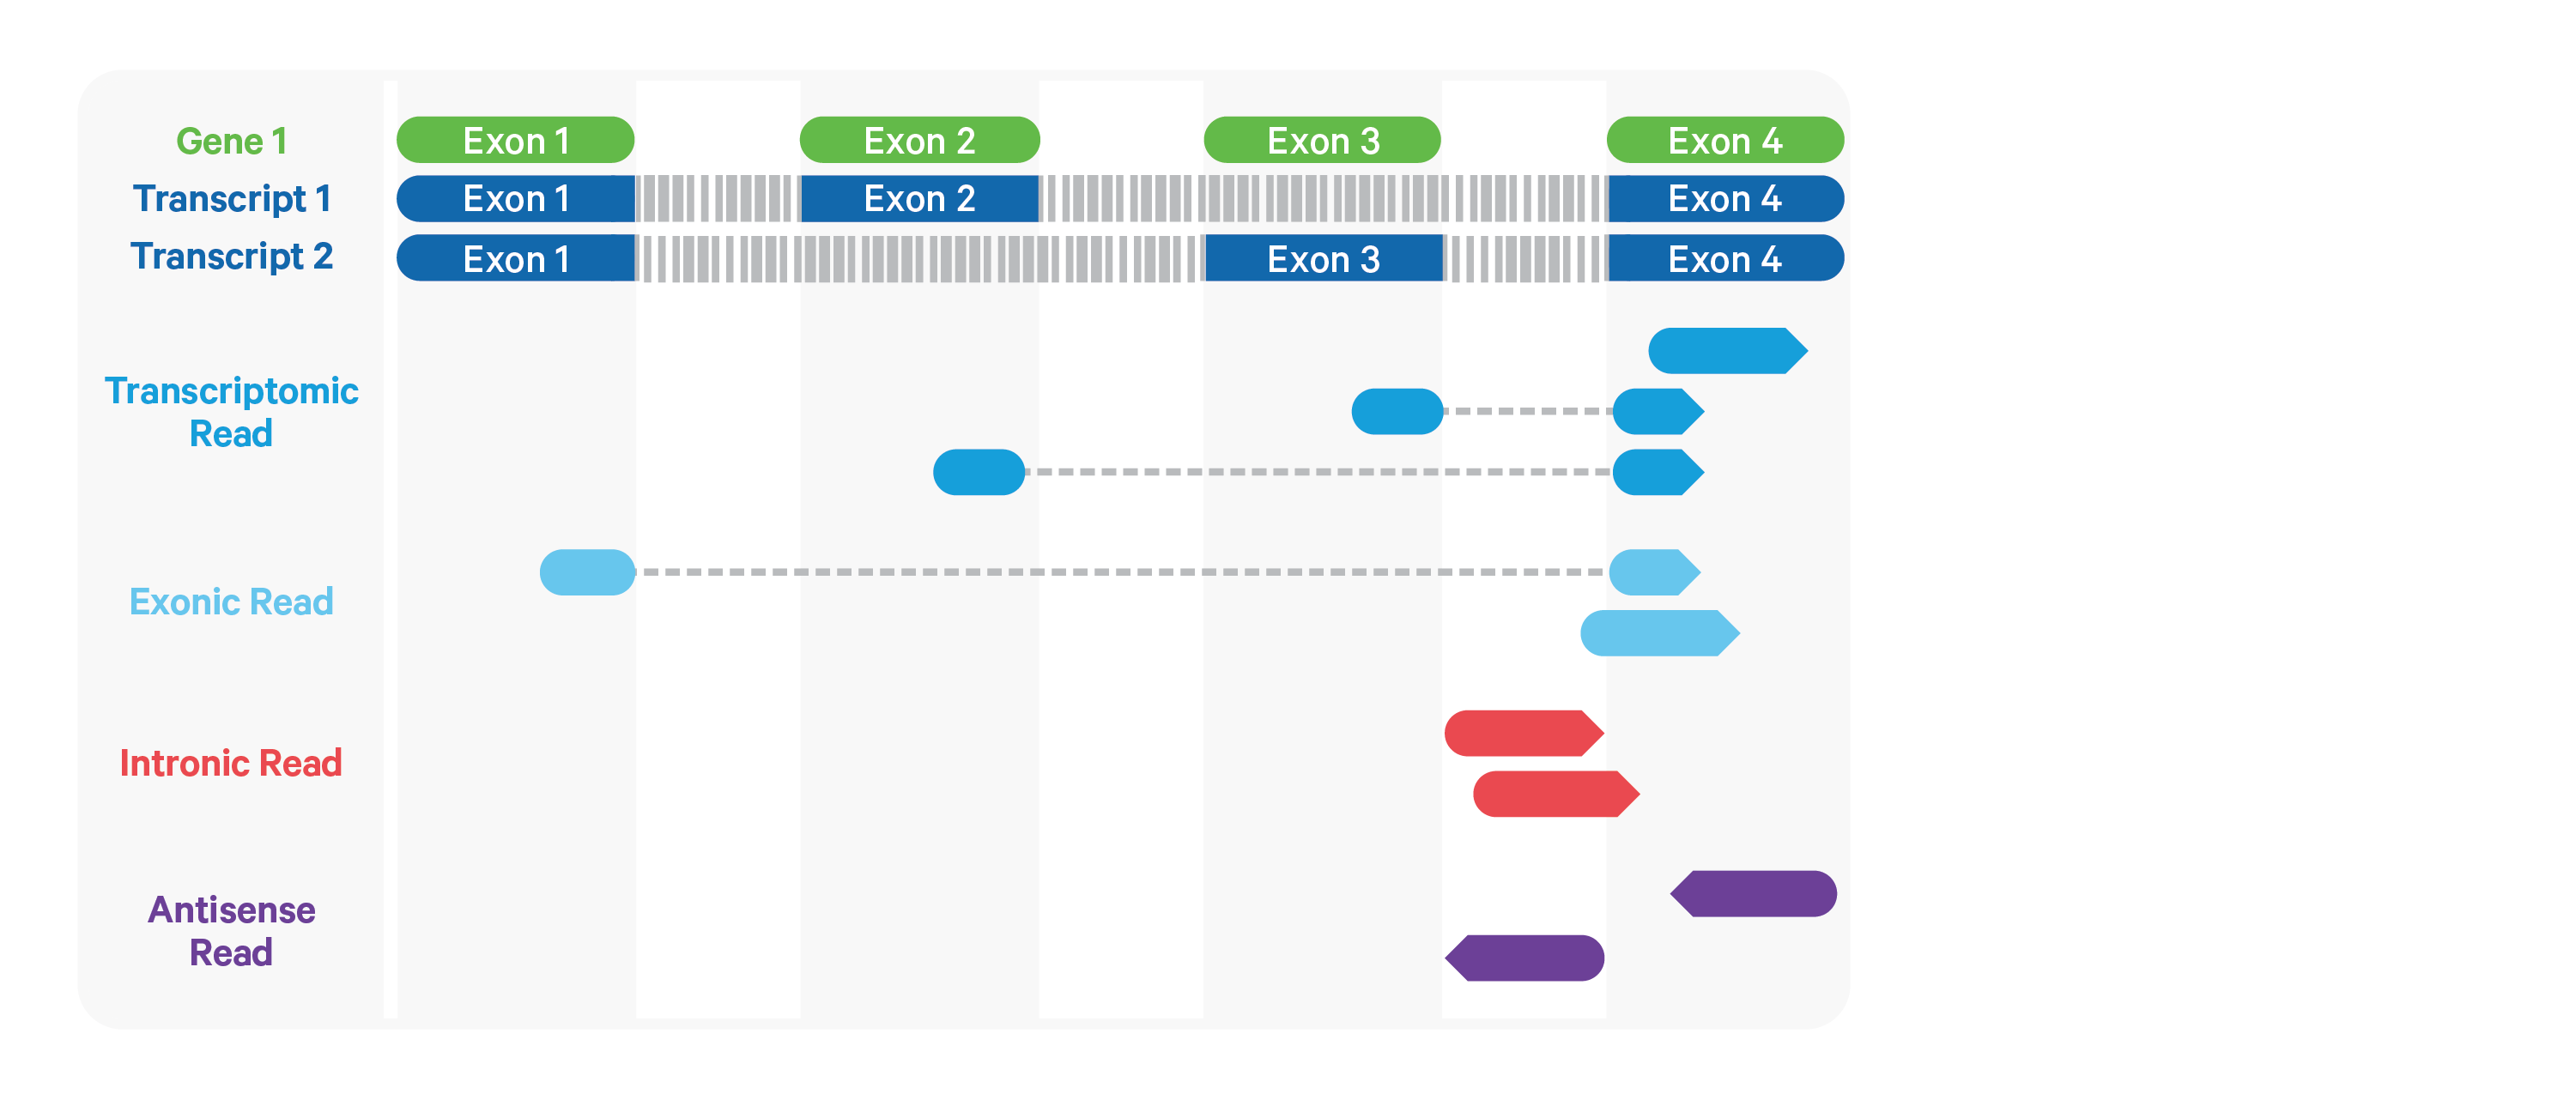
By default, reads that map in the sense orientation to a single gene - which include the reads labeled transcriptomic (blue), exonic (light blue), and intronic (red) in the diagram above - are carried forward to UMI counting.
This is because the input to the assay consists
of nuclei that are known to be enriched for unspliced transcripts. Users who
wish to only count transcriptomic reads (shown in a darker shade of blue
above) can do use by running the cellranger-arc count
pipeline with the flag --gex-exclude-introns.
|
By default, Cell Ranger ARC includes both exonic and intronic reads that map in the sense orientation to a gene towards UMI counting. This eliminates the need for a special 'nuclei reference' that defines the entire gene body to be an exon. Users can turn off this behavior by using the
|
Furthermore, a read is considered uniquely mapping if it is compatible with only a single gene. Only uniquely mapping reads are carried forward to UMI counting.
|
Note, in the Web Summary HTML, the set of reads carried forward to UMI counting is referred to as "Reads mapped confidently to transcriptome" |
Before counting UMIs, Cell Ranger ARC attempts to correct for sequencing errors in the UMI sequences. Reads that were confidently mapped to the transcriptome are placed into groups that share the same barcode, UMI, and gene annotation. If two groups of reads have the same barcode and gene, but their UMIs differ by a single base (i.e., are Hamming distance 1 apart), then one of the UMIs was likely introduced by a substitution error in sequencing. In this case, the UMI of the less-supported read group is corrected to the UMI with higher support.
Cell Ranger ARC again groups the reads by barcode, UMI (possibly corrected), and gene annotation. If two or more groups of reads have the same barcode and UMI, but different gene annotations, the gene annotation with the most supporting reads is kept for UMI counting, and the other read groups are discarded. In case of a tie for maximal read support, all read groups are discarded, as the gene cannot be confidently assigned.
After these two filtering steps, each observed barcode, UMI, gene combination is recorded as a UMI count in the raw feature-barcode matrix. The number of reads supporting each counted UMI is also recorded in the molecule info file.
Because of the distinct signal and noise profiles of gene expression and ATAC data, Cell Ranger ARC performs the primary dimensionality reduction on GEX gene-barcode matrix and ATAC peak-barcode matrix using different methods.
In order to reduce the GEX gene-barcode matrix to its most important features, Cell Ranger ARC uses Principal Components Analysis (PCA) to change the dimensionality of the dataset from (cells x genes) to (cells x M) where M is a user-selectable number of principal components (default = 10). The pipeline uses a python implementation of IRLBA algorithm, (Baglama & Reichel, 2005), which we modified to reduce memory consumption.
For ATAC peak-barcode matrix, we normalize the data via the inverse-document frequency (idf) transform, inspired by the large body of work in the field of information retrieval. Each peak count is scaled by the log of the ratio of the number of barcodes in the matrix and the number of barcodes where the peak has a non-zero count. This provides greater weight to counts in peaks that occur in fewer barcodes. Singular value decomposition (SVD) is performed on this normalized matrix using IRLBA without scaling or centering, to produce the transformed matrix in lower dimensional space (default = 15), as well as the components and the singular values signifying the importance of each component. Prior to clustering, we perform normalization to depth by scaling each barcode data point to unit L2-norm in the lower dimensional space. We found that the combination of these normalization techniques obviates the need to remove the first component. Specific to LSA, we provide spherical k-means clustering that produces 2 to 5 clusters for downstream analysis. Spherical k-means was found to perform better than plain k-means, by identifying clusters via k-means on L2-normalized data that lives on the spherical manifold. Similar to PCA, we also provide a graph-based clustering and visualization via t-SNE and UMAP. However, similar to spherical k-means clustering, we normalize the data to unit norm before performing graph-based clustering, t-SNE and UMAP projection.
For visualizing data in 2-d space, Cell Ranger ARC passes the dimensionality reduced data into t-SNE (t-Stochastic Neighbor Embedding), a nonlinear dimensionality reduction method (Van der Maaten, 2014). The C++ reference implementation by Van der Maaten was modified to take a PRNG seed for determinis. We also decreased its runtime by fixing the number of output dimensions at compile time to 2 or 3.
Cell Ranger ARC also supports visualization with UMAP (Uniform Manifold Approximation and Projection), which estimates a topology of the high dimensional data and uses this information to estimate a low dimensional embedding that preserves relationships present in the data. (Leland McInnes et al, 2018) The pipeline uses the python implementation of this algorithm by Leland McInnes.
Cell Ranger ARC uses two different methods for clustering cells by expression similarity, both of which operate in the dimensionality reduced space.
The graph-based clustering algorithm consists of building a sparse nearest-neighbor graph (where cells are linked if they among the k nearest Euclidean neighbors of one another), followed by Louvain Modularity Optimization (LMO; Blondel, Guillaume, Lambiotte, & Lefebvre, 2008), an algorithm which seeks to find highly-connected "modules" in the graph. The value of k, the number of nearest neighbors, is set to scale logarithmically with the number of cells. An additional cluster-merging step is performed: hierarchical clustering on the cluster-medoids in the reduced dimension and merge pairs of sibling clusters if there are no genes differentially expressed between them (with B-H adjusted p-value below 0.05). The hierarchical clustering and merging is repeated until there are no more cluster-pairs to merge.
The use of LMO to cluster cells was inspired by a similar method in the R package Seurat
Cell Ranger ARC also performs traditional K-means clustering for K=2,3,4,5, where K is the preset number of clusters.
As peaks are regions enriched for open chromatin, and thus have potential for
regulatory function, observing the location of peaks with respect to genes can
be insightful. We use bedtools closest -D=b to associate each peak
with genes based on closest transcription start sites (packaged within the
reference) such that the peak is within 1000 bases upstream or 100 bases
downstream of the TSS. Additionally, we also associate genes to putative distal
peaks that are much further from the TSS, and are less than 100 kb upstream or
downstream from the ends of the transcript (see
here for detailed procedures). This association is
adopted by our companion visualization software (Loupe Browser) and is used to
construct and visualize derived features such as promoter-sums that pool
together counts from peaks associated with a gene.
Peaks are enriched for transcription factor (TF) binding motifs and the presence of certain motifs can be indicative of transcription factor activity. To identify these motifs, we first calculate the GC% distribution of peaks and then bin the peaks into equal quantile ranges in the GC content distribution. We use the MOODS Python library packaged inside Cell Ranger ARC to scan each peak for matches to motif position-weight-matrices (PWMs) for transcription factors from the JASPAR database built directly into the reference package. We set a p-value threshold of 1E-7 and background nucleotide frequencies to be the observed nucleotide frequencies within the peak regions in each GC bucket. The list of motif-peak matches is unified across these buckets, thus avoiding GC bias in scanning.
As transcription factors (TF) tend to bind at sites containing their cognate motifs, grouping of accessibility measurements at peaks with common motifs produces a useful enrichment analysis of TFs across single cells. We construct an integer count for each TF for each cell barcode in the following manner: we consider all peaks matched to a given TF, as discovered in the TF motif detection. Then for every barcode, we pool together the cut-site counts across these matched peaks in the filtered peak-barcode matrix. This calculates the total cut-sites in a cell barcode for peaks that share the TF motif. We calculate the proportion of cut-sites for a TF within a barcode out of the total cut-sites for that barcode, which normalizes it to depth. We detect enrichment for a TF by z-scoring the distribution over barcodes of these proportion values for given TF. To make it robust to outliers, we use the modified z-score calculated using the median and the scaled median absolute deviation from the median (MAD), instead of the mean and standard deviation. These z-scored values are visible when you load a dataset in Loupe and accompanies the differential analysis built into Loupe Browser.
| We do not produce the tf-barcode matrix if the motifs.pfm file is missing from the reference package (for example in custom references). We cannot perform TF motif enrichment analysis in these cases. |
In order to identify genes whose expression is specific to each cluster, Cell Ranger ARC tests whether the in-cluster mean differs from the out-of-cluster mean for each gene and each cluster.
In order to find differentially expressed genes between groups of cells, Cell Ranger ARC uses the quick and simple method sSeq (Yu, Huber, & Vitek, 2013), which employs a negative binomial exact test. When the counts become large, Cell Ranger ARC switches to the fast asymptotic beta test used in edgeR (Robinson & Smyth, 2007). For each cluster, the algorithm is run on that cluster versus all other cells, yielding a list of genes that are differentially expressed in that cluster relative to the rest of the sample.
Cell Ranger ARC's implementation differs slightly from that in the paper: in the sSeq paper, the authors recommend using DESeq's geometric mean-based definition of library size. Cell Ranger ARC instead computes relative library size as the total UMI counts for each cell divided by the median UMI counts per cell. As with sSeq, normalization is implicit in that the per-cell library-size parameter is incorporated as a factor in the exact-test probability calculations.
In order to identify transcription factor motifs whose accessibility is specific to each cluster, Cell Ranger ARC tests, for each motif and each cluster, whether the in-cluster mean differs from the out-of-cluster mean. Users familiar with our Chromium Single Cell Gene Expression Solution may recognize that this is identical to what Cell Ranger ARC does for identifying differential gene expression. In order to find differentially accessible motifs between groups of cells, Cell Ranger ARC uses a Negative Binomial (NB2) generalized linear model to discover the cluster specific means and their standard deviations, and then employs a Wald test for inference. For each cluster, the algorithm is run on that cluster versus all other cells, yielding a list of TF motifs that are differentially expressed in that cluster relative to the rest of the sample. Using a GLM framework allows us to model the sequencing depth per cell and GC content in peaks per cell directly as covariates. This allows us to normalize to them naturally as part of model estimation and inference procedure. We also perform differential enrichment analysis for accessibility in peaks using a Poisson generalized linear model, much the same way as we do for TF motifs. In this case, we model only the per cell depth as a covariate.
| We cannot perform differential analysis for transcription factor motifs in cases where the motifs.pfm file is missing from the reference package, such as in custom references built without the motif file. |
Baglama, J. & Reichel, L. Augmented Implicitly Restarted Lanczos Bidiagonalization Methods. SIAM Journal on Scientific Computing 27, 19–42 (2005).
Blondel, V.D., Guillaume, J.-L., Lambiotte, R. & Lefebvre, E. Fast unfolding of communities in large networks. Journal of Statistical Mechanics: Theory and Experiment 2008, (2008).
McInnes, L, Healy, J, UMAP: Uniform Manifold Approximation and Projection for Dimension Reduction. arXiv 2018
Robinson, M.D. & Smyth, G.K. Small-sample estimation of negative binomial dispersion, with applications to SAGE data. Biostatistics 9, 321–332 (2007). Link to edgeR source.
Van der Maaten, L.J.P. Accelerating t-SNE using Tree-Based Algorithms. Journal of Machine Learning Research 15, 3221-3245 (2014).
Yu, D., Huber, W. & Vitek, O. Shrinkage estimation of dispersion in Negative Binomial models for RNA-seq experiments with small sample size. Bioinformatics 29, 1275–1282 (2013).