Cell Ranger ARC2.0, printed on 04/08/2025
Cell Ranger ARC's pipelines expose a user interface (UI) for monitoring progress
through a web browser. By default, this UI is exposed at an operating system
assigned port with a randomly-generated authentication token to restrict
access. Specifying the --uiport=3600 option when using
cellranger will force the UI to be exposed on port 3600 and the
--disable-ui option will turn off the UI.
This UI is accessible through a web interface that runs on the given port on
the machine where the pipeline was started. The URL to use with the web
browser is printed to the pipeline standard output and log files and can
also be found in the [sampleid]/_uiport file where the pipeline
was launched.
When the pipeline runs, it will display the URL for the UI.
$ cellranger-arc count --id=sample345 \
                       --reference=/opt/refdata-cellranger-arc-GRCh38-2020-A-2.0.0 \
                       --libraries=/home/jdoe/runs/libraries.csv \
                       --localcores=16 \
                       --localmem=64

Martian Runtime - v4.0.5
Serving UI at http://host.example.com:5603/?auth=mcV3MKANWfNTERRGASgYV8aXskx-rSH7hxynAdsTieA
2012-01-01 12:00:00 [runtime] Reattaching in local mode.

Running preflight checks (please wait)...
The UI will become unavailable once the pipeline completes unless the
--noexit flag is passed.
While a pipeline is running, you can open the url (
http://host.example.com:5603/?auth=mcV3MKANWfNTERRGASgYV8aXskx-rSH7hxynAdsTieA)
in your web browser to view the pipeline process graph (See the full graph here):
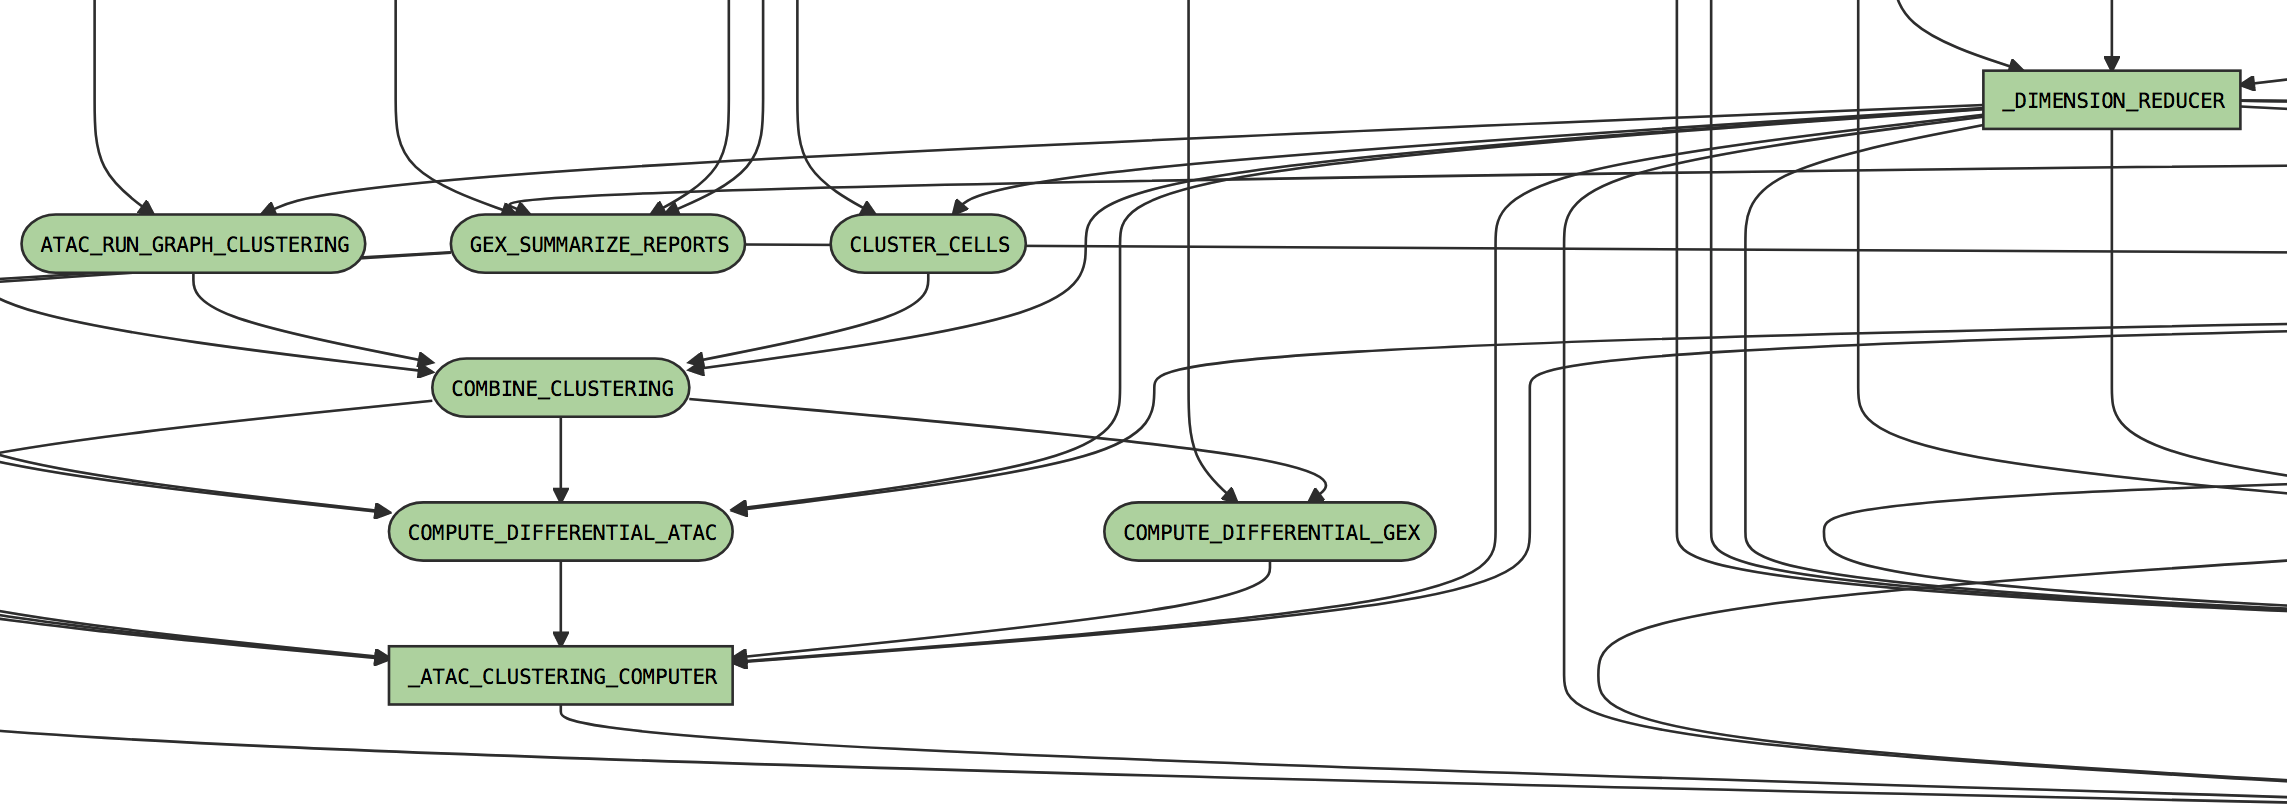
Clicking on any of the graph's nodes will reveal more information about that
stage in the right pane. This information pane is broken into several sections
and the topmost shows high-level details about the stage's execution. For
example, the CLUSTER_CELLS stage would show:
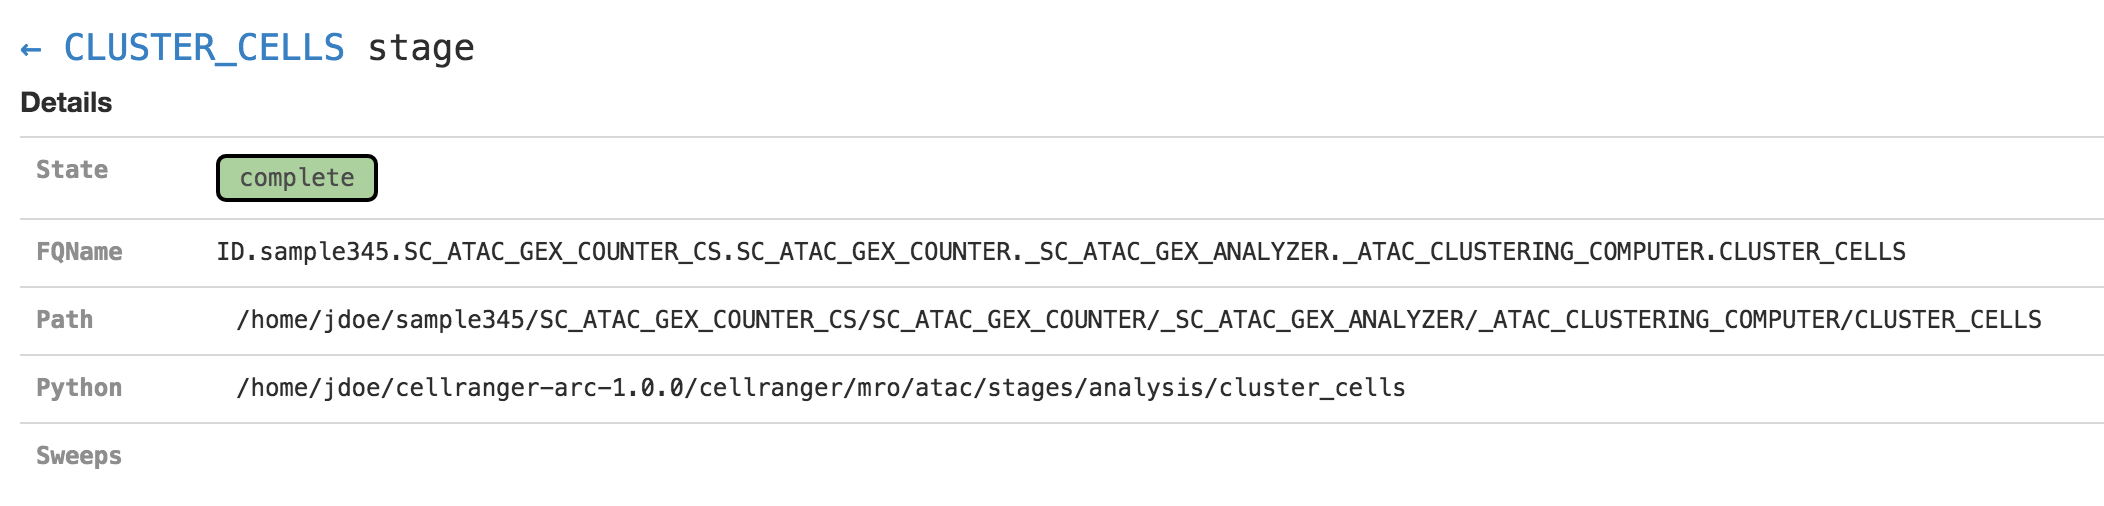
This includes the state of the stage (running, failed, or complete), the
fully-qualified stage name (FQName), the directory in which the
stage is running (Path), and the stage code that is being run (the
location of the Python package being run in the above example).
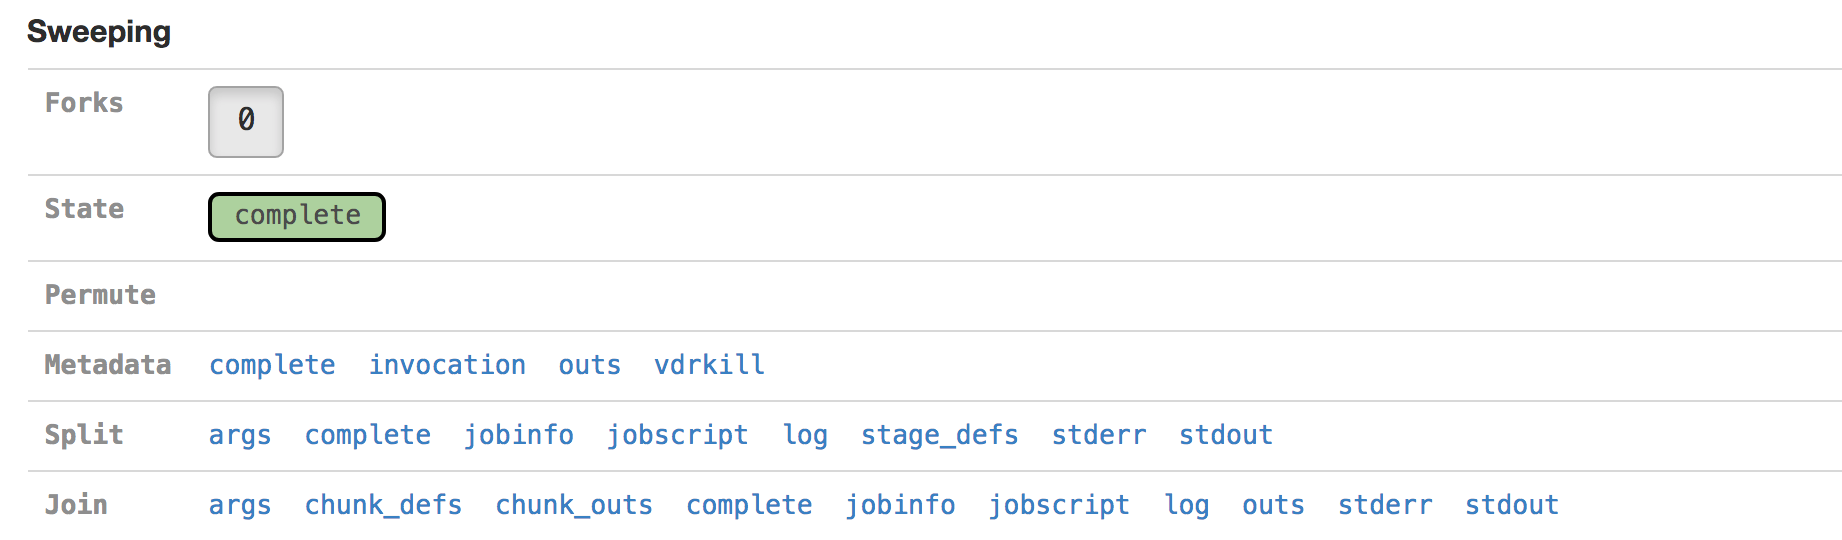
Clicking the arrow next to the stage name (← CLUSTER_CELLS in the
above example) will return to the pipeline-level metadata view.
The Sweeping section allows you to view the MRO call used to
invoke this stage (invocation) and information about the split
and join components of the stage if it was parallelized.
The Argument Bindings and Return Bindings sections display the inputs and outputs of the stage:
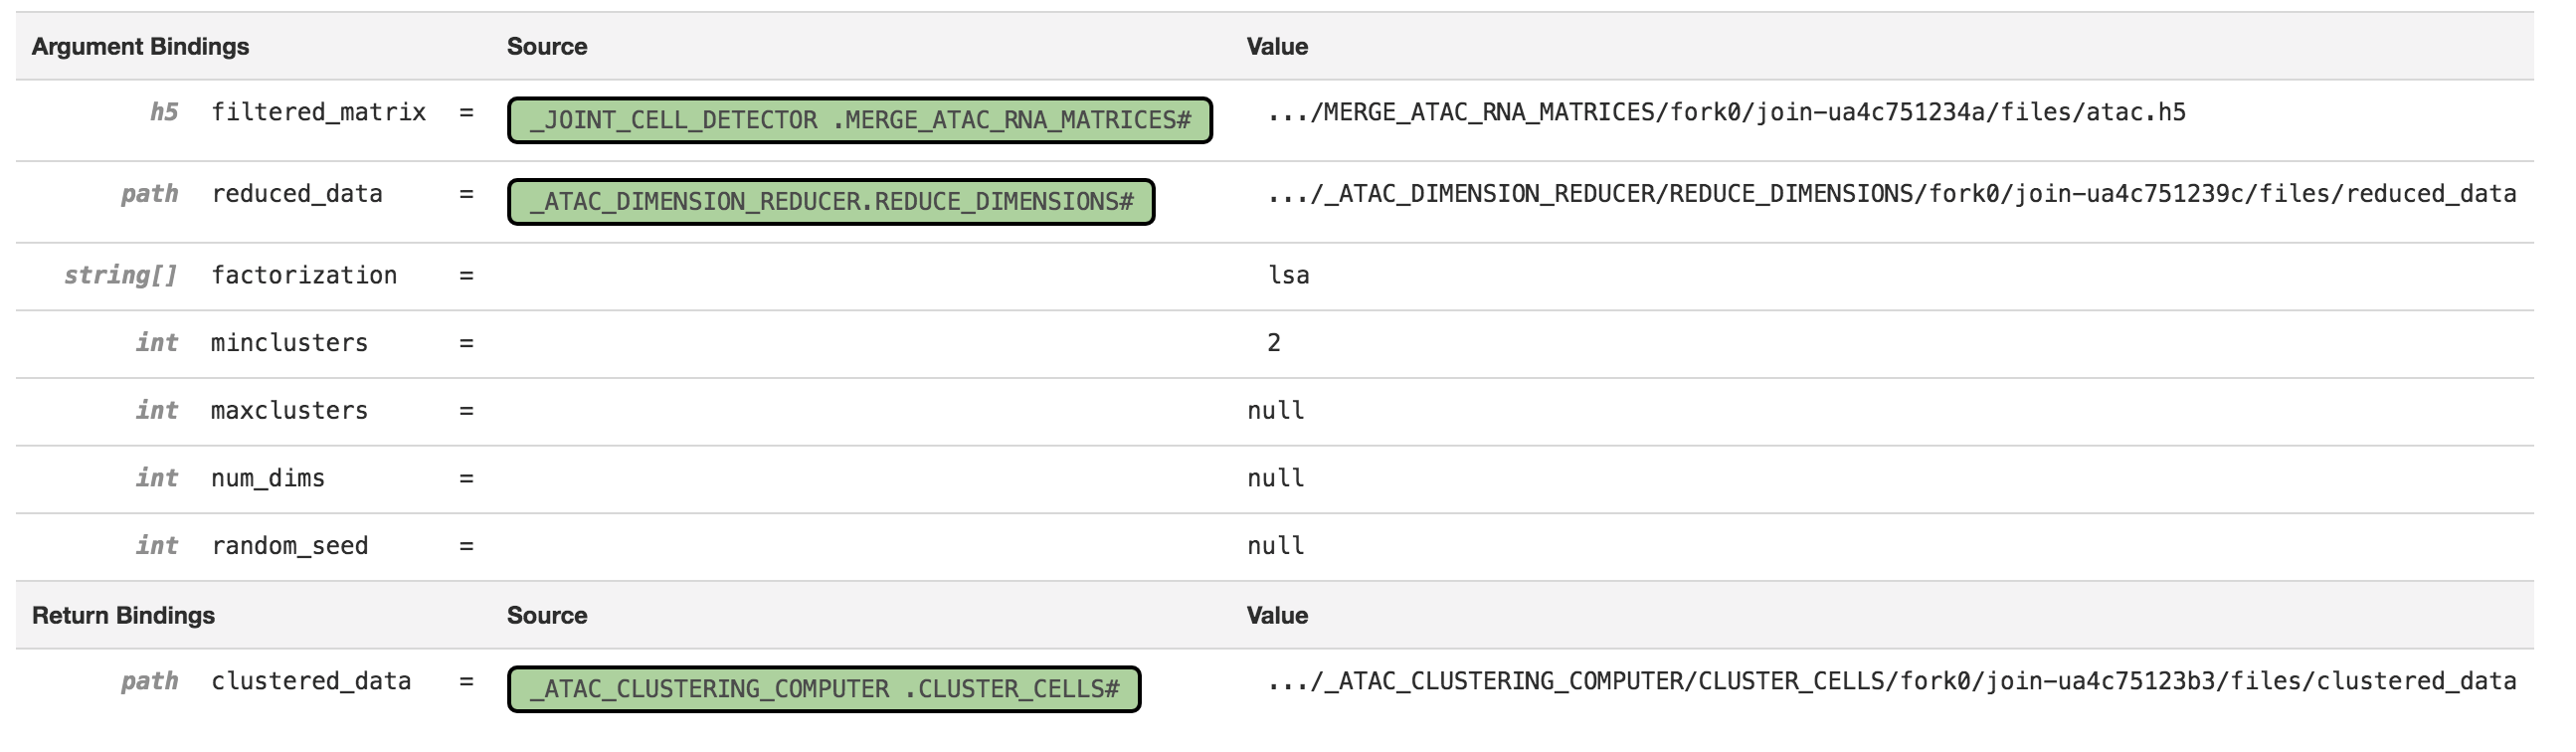
In general, only top-level pipeline stages (those represented by rectangular nodes in the process graph) contain return bindings.
The Chunking section displays information about the parallel execution of the stage:
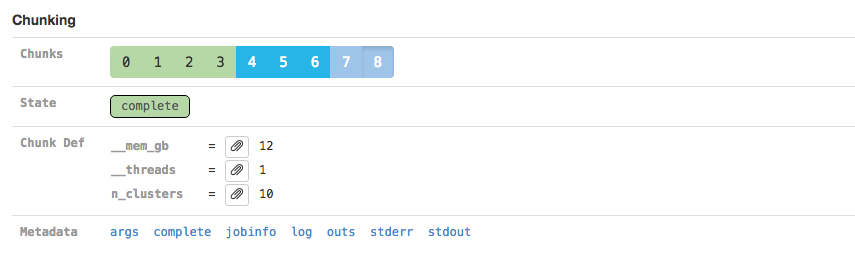
Many stages are automatically parallelized and process different pieces
(chunks) of the same input dataset in parallel. In the above example, the CLUSTER_CELLS
was split into 9 chunks for this stage. Chunks 0-3 already completed, 4-6 are in flight, and 7-8 are
waiting for CPU and/or memory to become available before running.
Clicking on an individual chunk exposes additional options for viewing metadata
about that chunk's execution, including any errors, standard output, and in
cluster mode the job script used to queue the job to the cluster. The
jobinfo includes information about how a chunk was executed, selected
environment variables, and for completed chunks various performance statistics such
as peak memory usage and CPU time used. As with the Sweeping section,
additional metadata associated with the chunk execution can also be viewed.
You can also examine pipestances that have already completed using the
Cell Ranger UI. Assuming your pipestance output directory was
/home/jdoe/runs/sample345, simply re-run the cellranger-arc
command with the --noexit option to re-attach the UI:
$ cellranger-arc count --id=sample345 \
                       --reference=/opt/refdata-cellranger-arc-GRCh38-2020-A-2.0.0 \
                       --libraries=/home/jdoe/runs/libraries.csv \
                       --localcores=16 \
                       --localmem=64
                       --noexit

Martian Runtime - v4.0.5
Serving UI at http://host.example.com:3600
2012-01-01 12:00:00 [runtime] Reattaching in local mode.

Running preflight checks (please wait)...
Pipestance completed successfully, staying alive because --noexit given.
Because cellranger-arc assumes it is resuming an incomplete pipeline job when re-attaching, the pipeline must be valid and preflight checks must still be passed. As such, relocating a complete pipeline may prevent the UI from reattaching.
If you run pipelines on a server that blocks access to all ports except SSH,
you can still access the Cell Ranger UI using SSH forwarding. Assuming you
have a cellranger-arc pipeline running on port 3600
on cluster.university.edu, you can type the following from
your computer:
$ ssh -NT -L 9000:cluster.university.edu:3600 jdoe@cluster.university.edu
jdoe@cluster.university.edu's password:
Upon entering your password (assuming you are jdoe@cluster.university.edu),
the command will appear to hang. However, in the background it has mapped port
9000 on your laptop to port 3600 on cluster.university.edu through
the ssh connection for which you just entered the password.
This allows you to go to http://localhost:9000/ in your web browser and access
the UI running on cluster.university.edu:3600. Once you are done
examining the UI, use + in your ssh -NT -L ...
terminal window to terminate this SSH forwarder.
A full explanation of SSH forwarding is beyond the scope of this guide. Refer to SSH/OpenSSH/PortForwarding for more information.