Cell Ranger ARC2.0, printed on 04/08/2025
This step associates a subset of barcodes observed in the library to the nuclei loaded from the sample. Identification of these cell barcodes enables data analysis at single cell resolution. For each barcode, we have an associated count of transposition events in peaks (from the chromatin accessibility library), as well as gene expression UMIs (from the gene expression library). The cell-calling algorithm uses this paired information to identify the cell population from the non-cell background.
Prior to performing cell calling, barcodes must pass three filtering criteria.
First filter - ATAC "low targeting" barcodes: Identifies "low-targeting" barcodes in which the fraction of fragments overlapping called peaks is lower than the fraction of genome in peaks (for this calculation, peaks are padded by 2,000 bp on both sides to account for fragment length). These barcodes typically have their cut sites randomly distributed over the genome, are not targeted to be enriched near functional regions, and do not exhibit the typical ATAC-seq nucleosome phasing signal.
Second filter - gel bead doublets: Identifies putative gel bead doublets where a partition contains one cell and two barcoded gel beads. These cells then manifest as two barcodes of the same cell type in the dataset. The rate of such doublets is low and the presence of these few extra barcodes doesn't significantly affect secondary analysis such as clustering or differential analysis, although it can potentially inflate abundance measurements of very rare cell types. The chromatin accessibility library is used to identify a minor-major pair of barcodes (B1, B2) that are part of a putative gel bead doublet by observing if the pair of barcodes shares more genomically adjoining "linked" fragments (fragments sharing a transposition event) with each other (B1-B2) as opposed to themselves (B1-B1 or B2-B2). The minor barcode is identified as the one with fewer fragments.
Third filter - greater than 1 count observed in each library: Identifies barcodes that have been observed in both chromatin accessibility and gene expression libraries. The minimum threshold is set at >1 count in each library.
The first two filters rely solely on data from the chromatin accessibility library, and are often referred to as ATAC exclusions. A barcode that fails any of the above three filtering criteria is masked from the total set of barcodes prior to cell calling.
We then perform cell calling on the remainder barcodes. The algorithm has four key steps:
Cell calling is limited to produce < 20k cells as the assay is currently
designed to support 500-10k cells. To override the cell-caller, two additional
parameters need to be provided to cellranger-arc count:
--min-atac-count=N and --min-gex-count=N, the former
specifies the minimum number of transposition events in peaks for a cell barcode
and the latter specifies the minimum number of UMI counts for a cell barcode.
Any barcode that satisfies both thresholds will be classified as a cell,
unless it is excluded from the cell calling algorithm because it fails the above
specified filtering criteria.
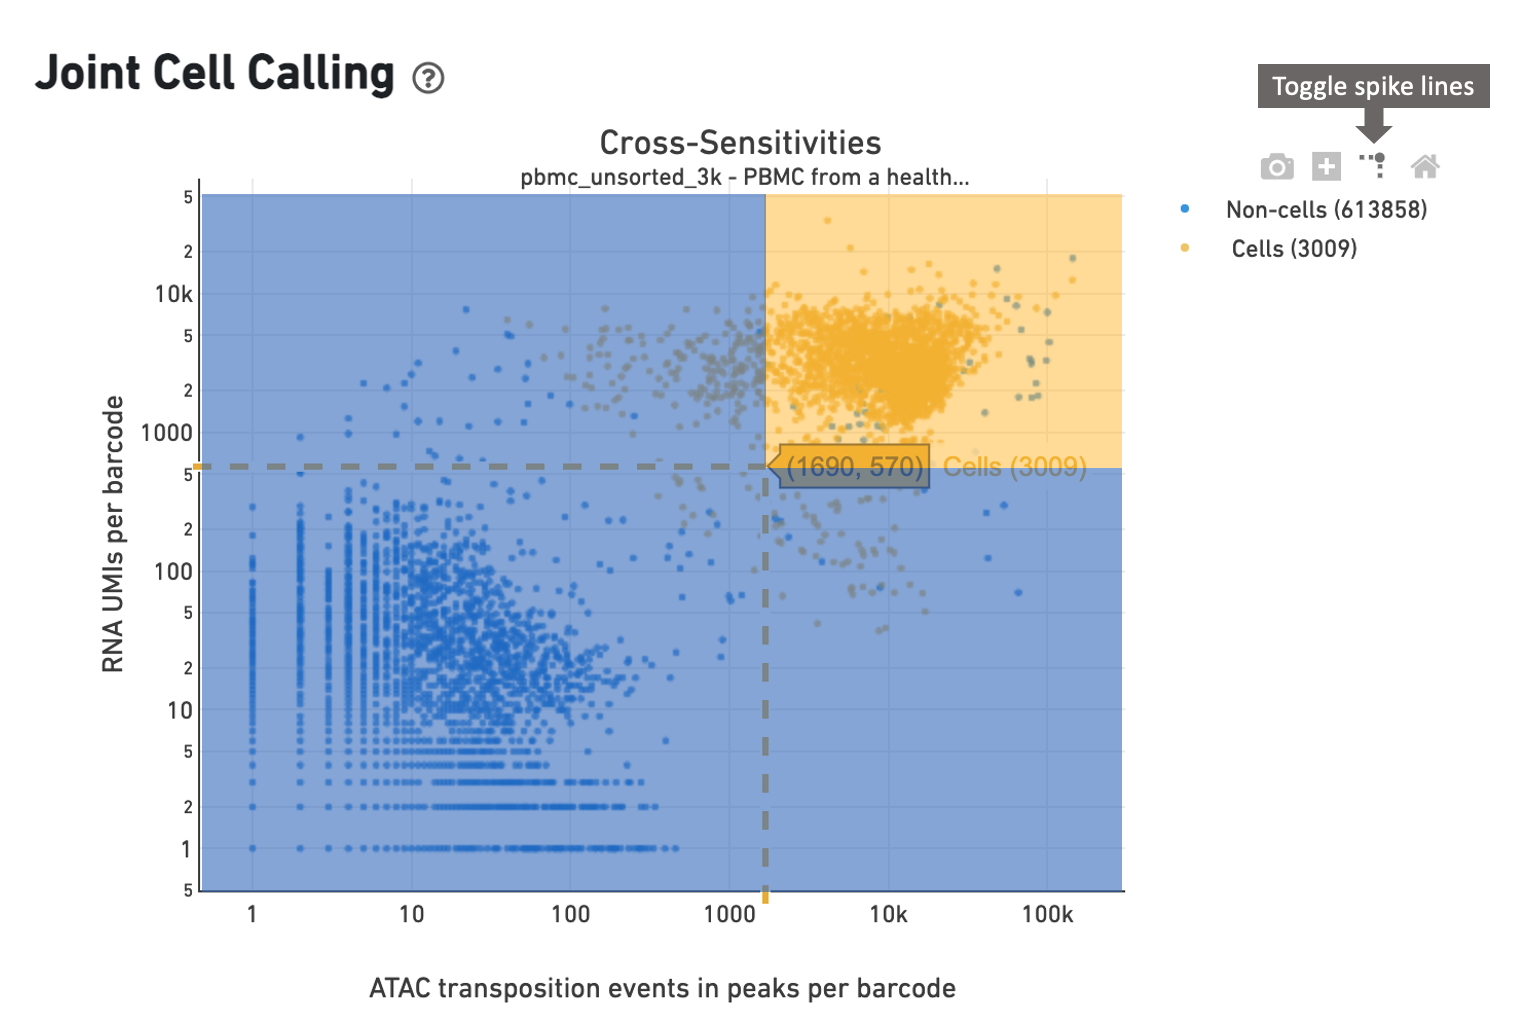
In this example, the cell caller identifies 3009 cells as shown in the web
summary. The toggle spike lines feature
is useful in determining appropriate thresholds to define a cell. With override
parameters set to values --min-atac-count=1690 and
--min-gex-count=570, barcodes in the shaded yellow area are
selected as cells, while barcodes in the shaded blue region are treated as
background.
Zheng, G.X., Terry, J.M., Belgrader, P., Ryvkin, P., Bent, Z.W., Wilson, R., Ziraldo, S.B., Wheeler, T.D., McDermott, G.P., Zhu, J. & Gregory, M.T. Massively parallel digital transcriptional profiling of single cells. Nature communications 8, 1-12 (2017).