Cell Ranger ARC5.0, printed on 04/06/2025
The main new data type introduced by Single Cell Multiome ATAC + Gene Expression and the Cell Ranger ARC pipeline is the notion of feature linkages. Two peaks are linked if there is a statistically significant correlation or anti-correlation in accessibility between them across all cells in the dataset. A gene and a peak are linked if there is a statistically significant correlation or anti-correlation between that peak's accessibility and the gene's expression level across all cells in the dataset. Linked features must be located within a megabase of each other.
Loupe Browser provides two ways to explore feature linkages: a feature linkage table, which shows a tabular view of linked features, and an additional peak viewer mode which shows linkages in genomic context.
In multiomic datasets, the Feature Linkage Table is accessible via a new icon in the data selector, as shown below:
| Tool | Description |
|---|---|
| Feature Linkage Table - Show the feature linkage table. |
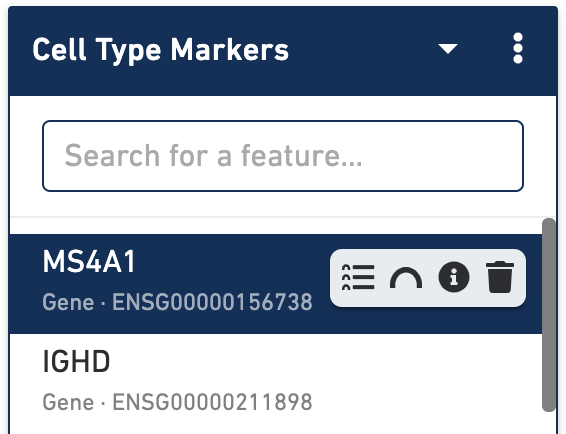
Clicking on this icon brings up an empty table with a feature input bar in the top. It is possible to enter either a gene or an individual peak to find the features linked to that gene or peak. The gene MS4A1 was used in this particular dataset to identify B cells, so let's use that as a starting point:
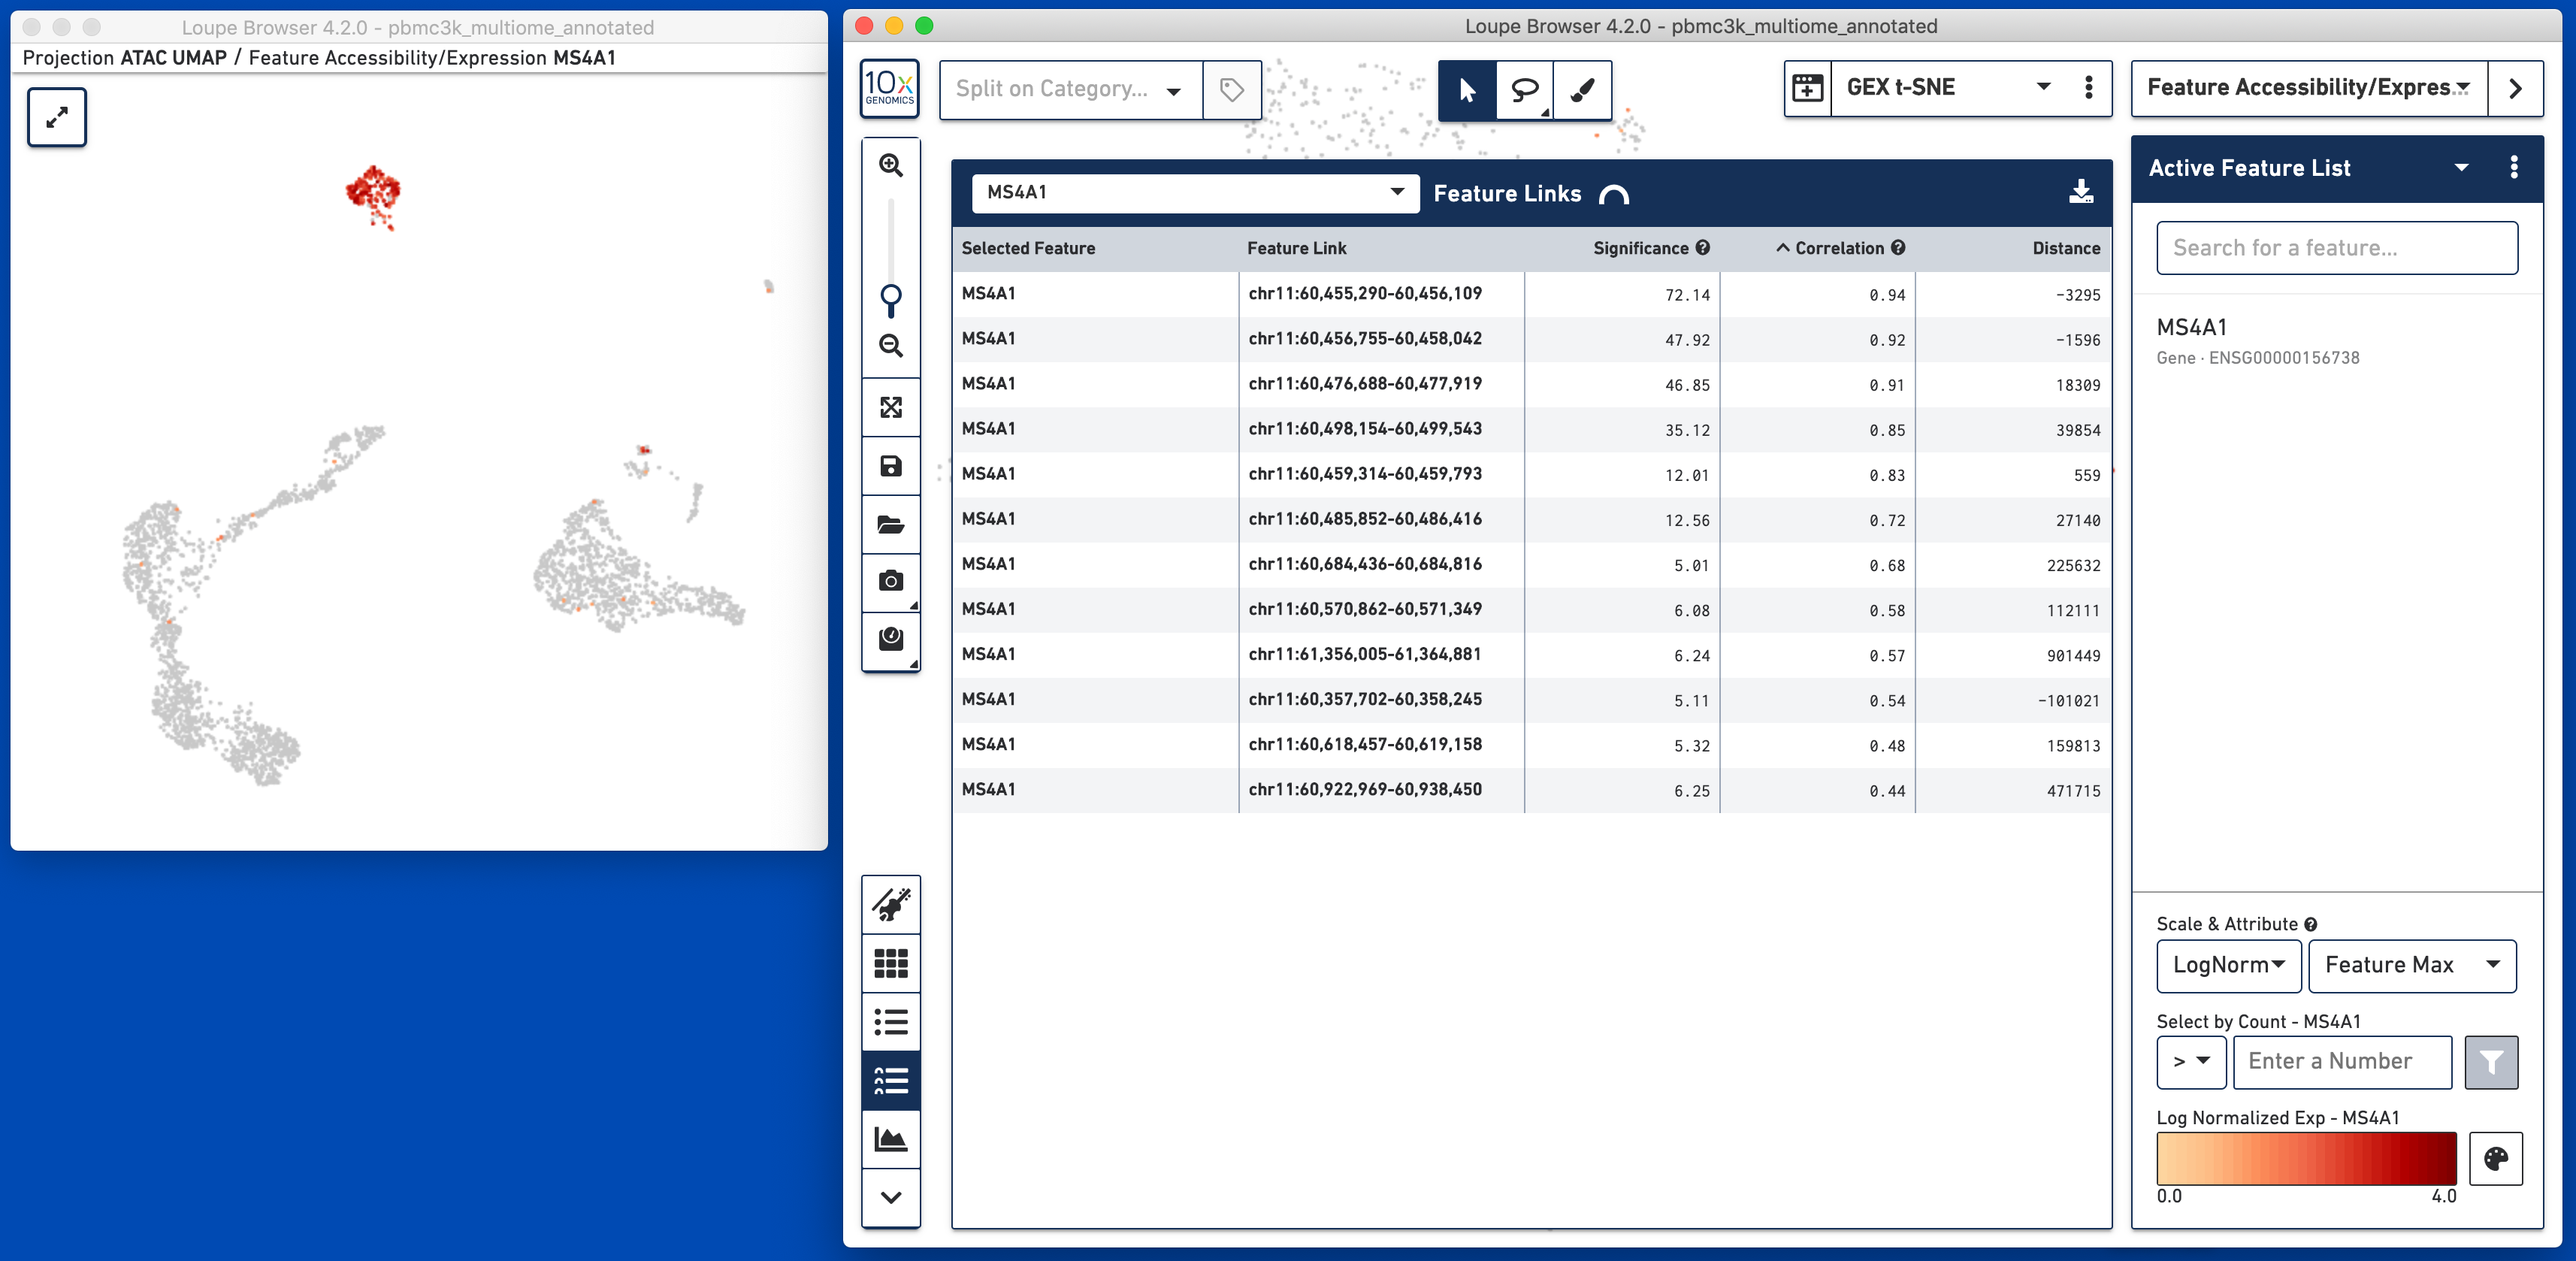
The table shows the selected feature (MS4A1) as well as all linked peaks within a megabase. The significance and correlation of the linkages are shown in columns next to the linked feature name, as well as the genomic distance. Clicking on the column headers Feature Link, Significance, Correlation or Distance will sort by that metric. Definitions of significance, correlation and distance are available by clicking on the question mark next to the column heading. If a gene is the selected feature, only peaks will be available as linked features. If a peak is the selected feature, both genes and peaks are potentially discoverable as linked features and will be shown in this table. It should likely not be a surprise that the peaks of chromatin accessibility most highly correlated with MS4A1 expression are the ones closest to the MS4A1 transcript; this is reassuring.
It is possible to view the gene expression or fragment count per peak on the cells by clicking on the feature name, and selecting 'Set As Active Feature'. The expression of MS4A1 is shown in the image above. Showing the expression or accessibility of a linked feature is useful for spot checking linkages. If screen real estate allows, it may also be useful to use a linked window for simultaneous comparison of expression and accessibility of linked features while exploring this data table.
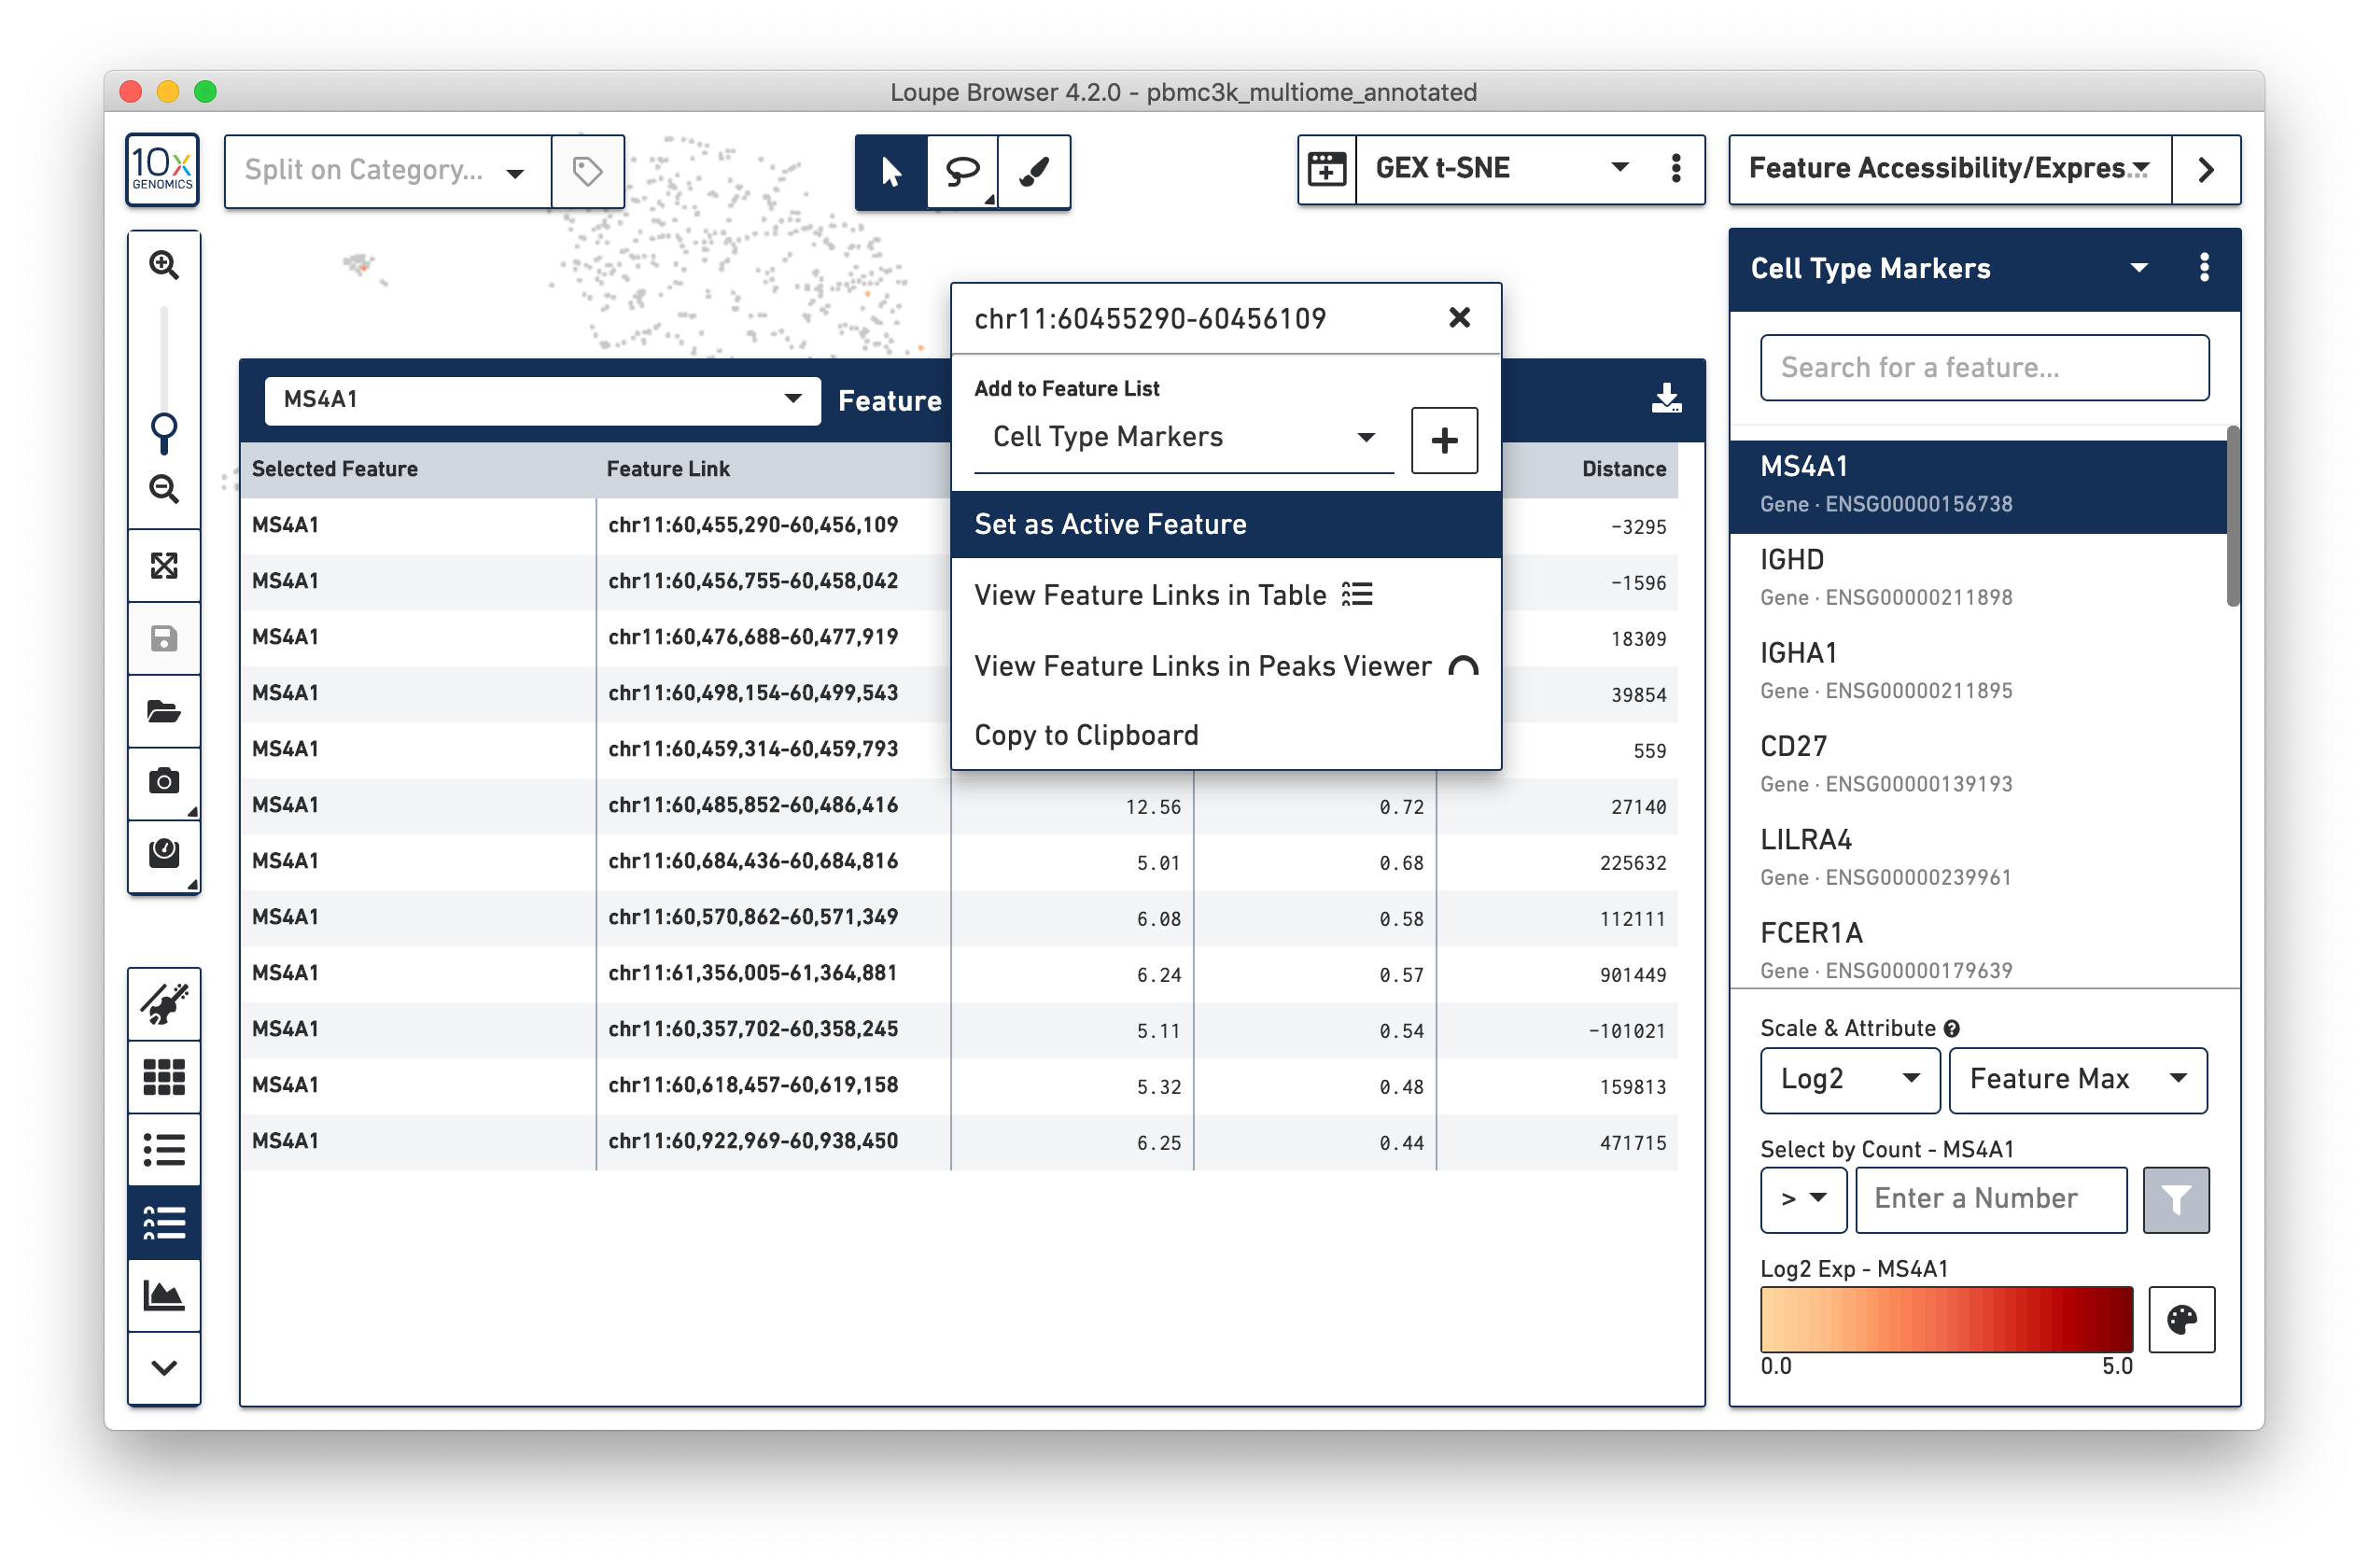
The context menu that appears by clicking on a feature also gives additional
options. It is possible to recenter the feature table around a linked feature,
to see what other genes or peaks may be correlated with, or correlated against
that feature. Clicking on the feature with the highest significance to MS4A1 --
chr11:60,455,290-60,456,109 and then selecting 'View Feature Links in Table'
brings up other peaks and genes that are correlated to that feature.
It is possible to export the current set of linked features within a table by clicking on the download icon at the top right of the feature linkage table.
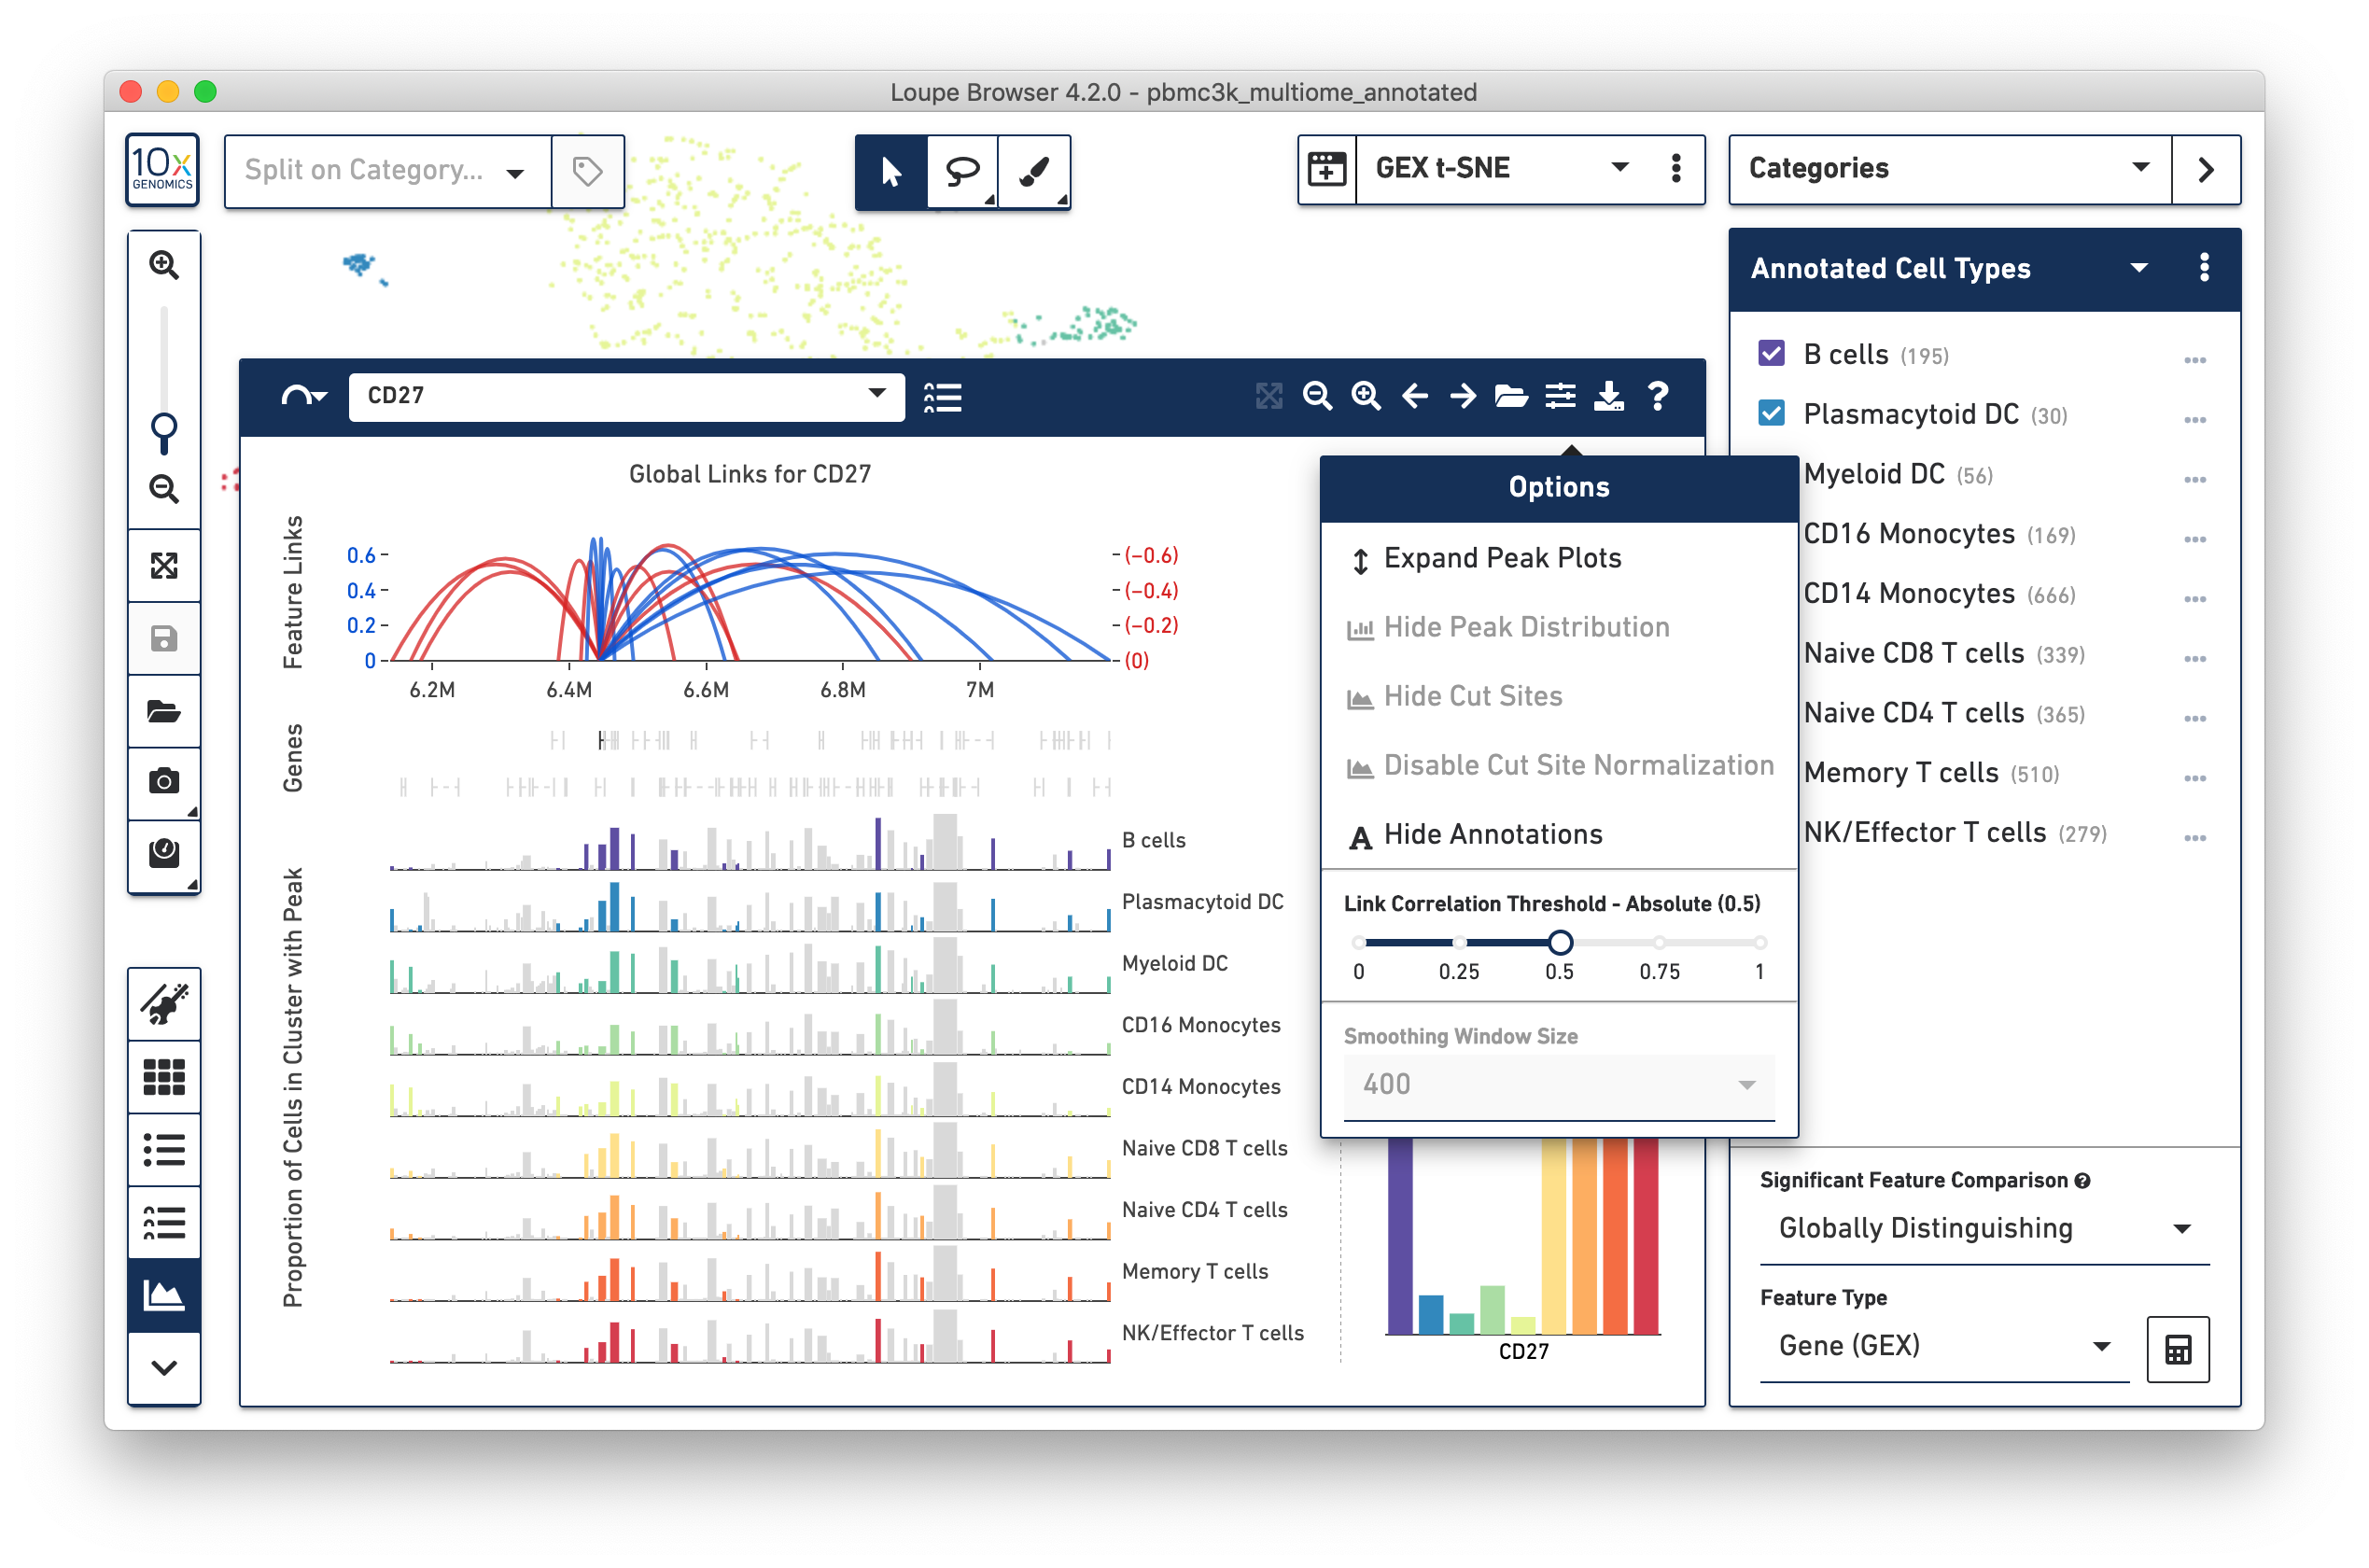
A tabular view shows a compact view of linked features, but leaves out genomic context. The Feature Linkage View provides an intuitive visualization of this tabular data. Click on the arc icon next to 'Feature Links' to explore feature linkages graphically.
After clicking on the arc icon and waiting a few seconds for linkage information
to load, the feature linkage view centered on the chr11:60,455,290-60,456,109
peak is visible:
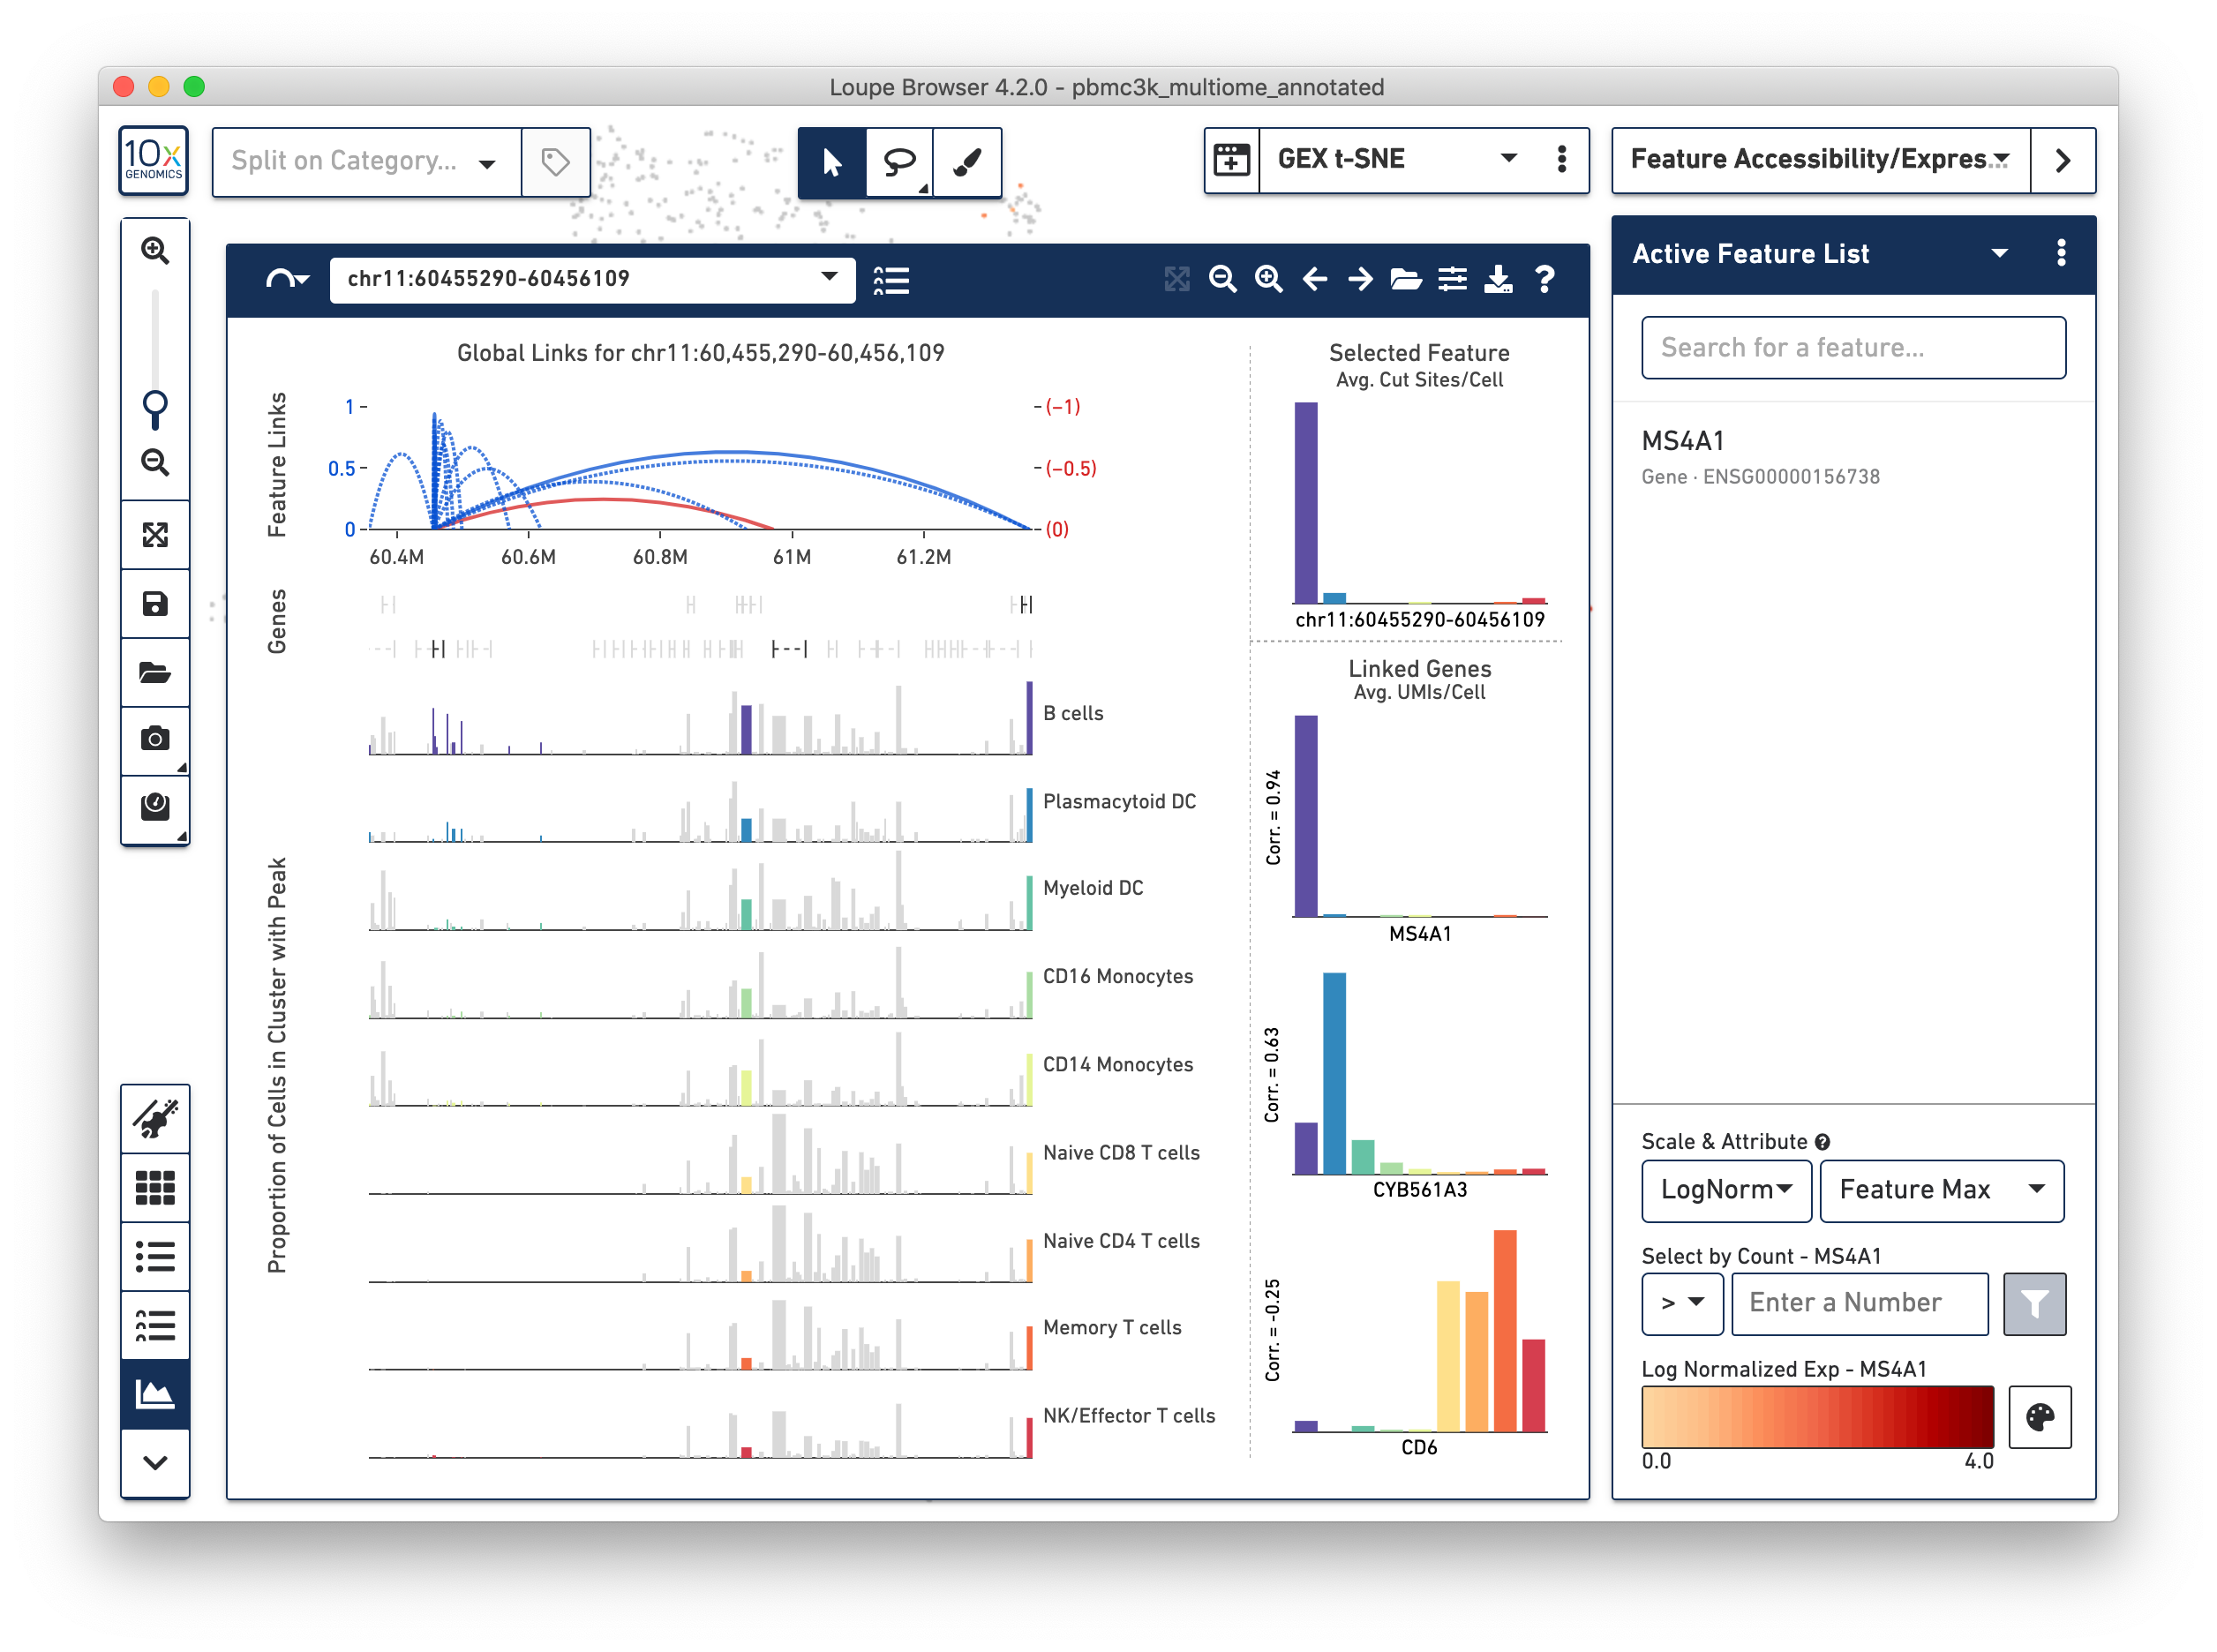
There is a lot going on here, so let's review the components.
The bottom left component should be familar to Single Cell ATAC users; this is the peak viewer. As with Single Cell ATAC data, peaks are shown on genomic tracks, and represented as vertical bars within cluster tracks. The width of each bar is proportional to each peak, and the height of each bar is proportional to the percentage of cells within that cluster track where chromatin is open in that peak. Gene annotations are overlaid on top of the cluster tracks.
Just as with ATAC data, it is possible to navigate either by clicking on the pan or zoom buttons on the Feature Linkage View, or by clicking and dragging in a particular region in the genomic tracks. It is possible to snap back to see all linkages for the selected feature by clicking on the 'Scale to Links Range' button to the left of the zoom buttons.
Above the peaks viewer is a new component -- the linkage arc plot. The linkage arc plot represents linked features as arcs, with either end of the arc corresponding to the location of the two linked features. Blue arcs represent positive correlations between features, and red arcs represent negative correlations. Solid arcs represent gene-to-peak linkages, and dotted arcs represent peak-to-peak linkages. The heights of the arcs correspond to the absolute values of the correlations of the linkages. Clicking on an arc will highlight the peak (or gene) in the Peak Viewer, and limit comparison from the selected feature to that single peak or gene. Finally, it is possible to zoom in to a particular region of arcs by clicking and dragging over the linkage arc plot.
On the right side of the Feature Linkage View is the linkage cluster plot.
This plot compares the differential accessibility or expression of the selected feature
within the currently active category, with other linked features. When the selected
features is a peak, the linkage cluster plot will show the accessibility distribution
of that selected feature at top right, and the expression patterns of any linked genes
below that graph. Correlations are shown to the left of each distribution, and hovering
over each bar graph will show that gene's average expression within that cluster.
In the case of chr11:60,455,290-60,456,109, it is easy to see that the MS4A1 has nearly
an identical expression pattern to the accessibility pattern of the peak, and a high
correlation. Likewise, it is evident that the peak has a negative correlation with the
CD6 gene, which has higher levels of expression in non B cell clusters.
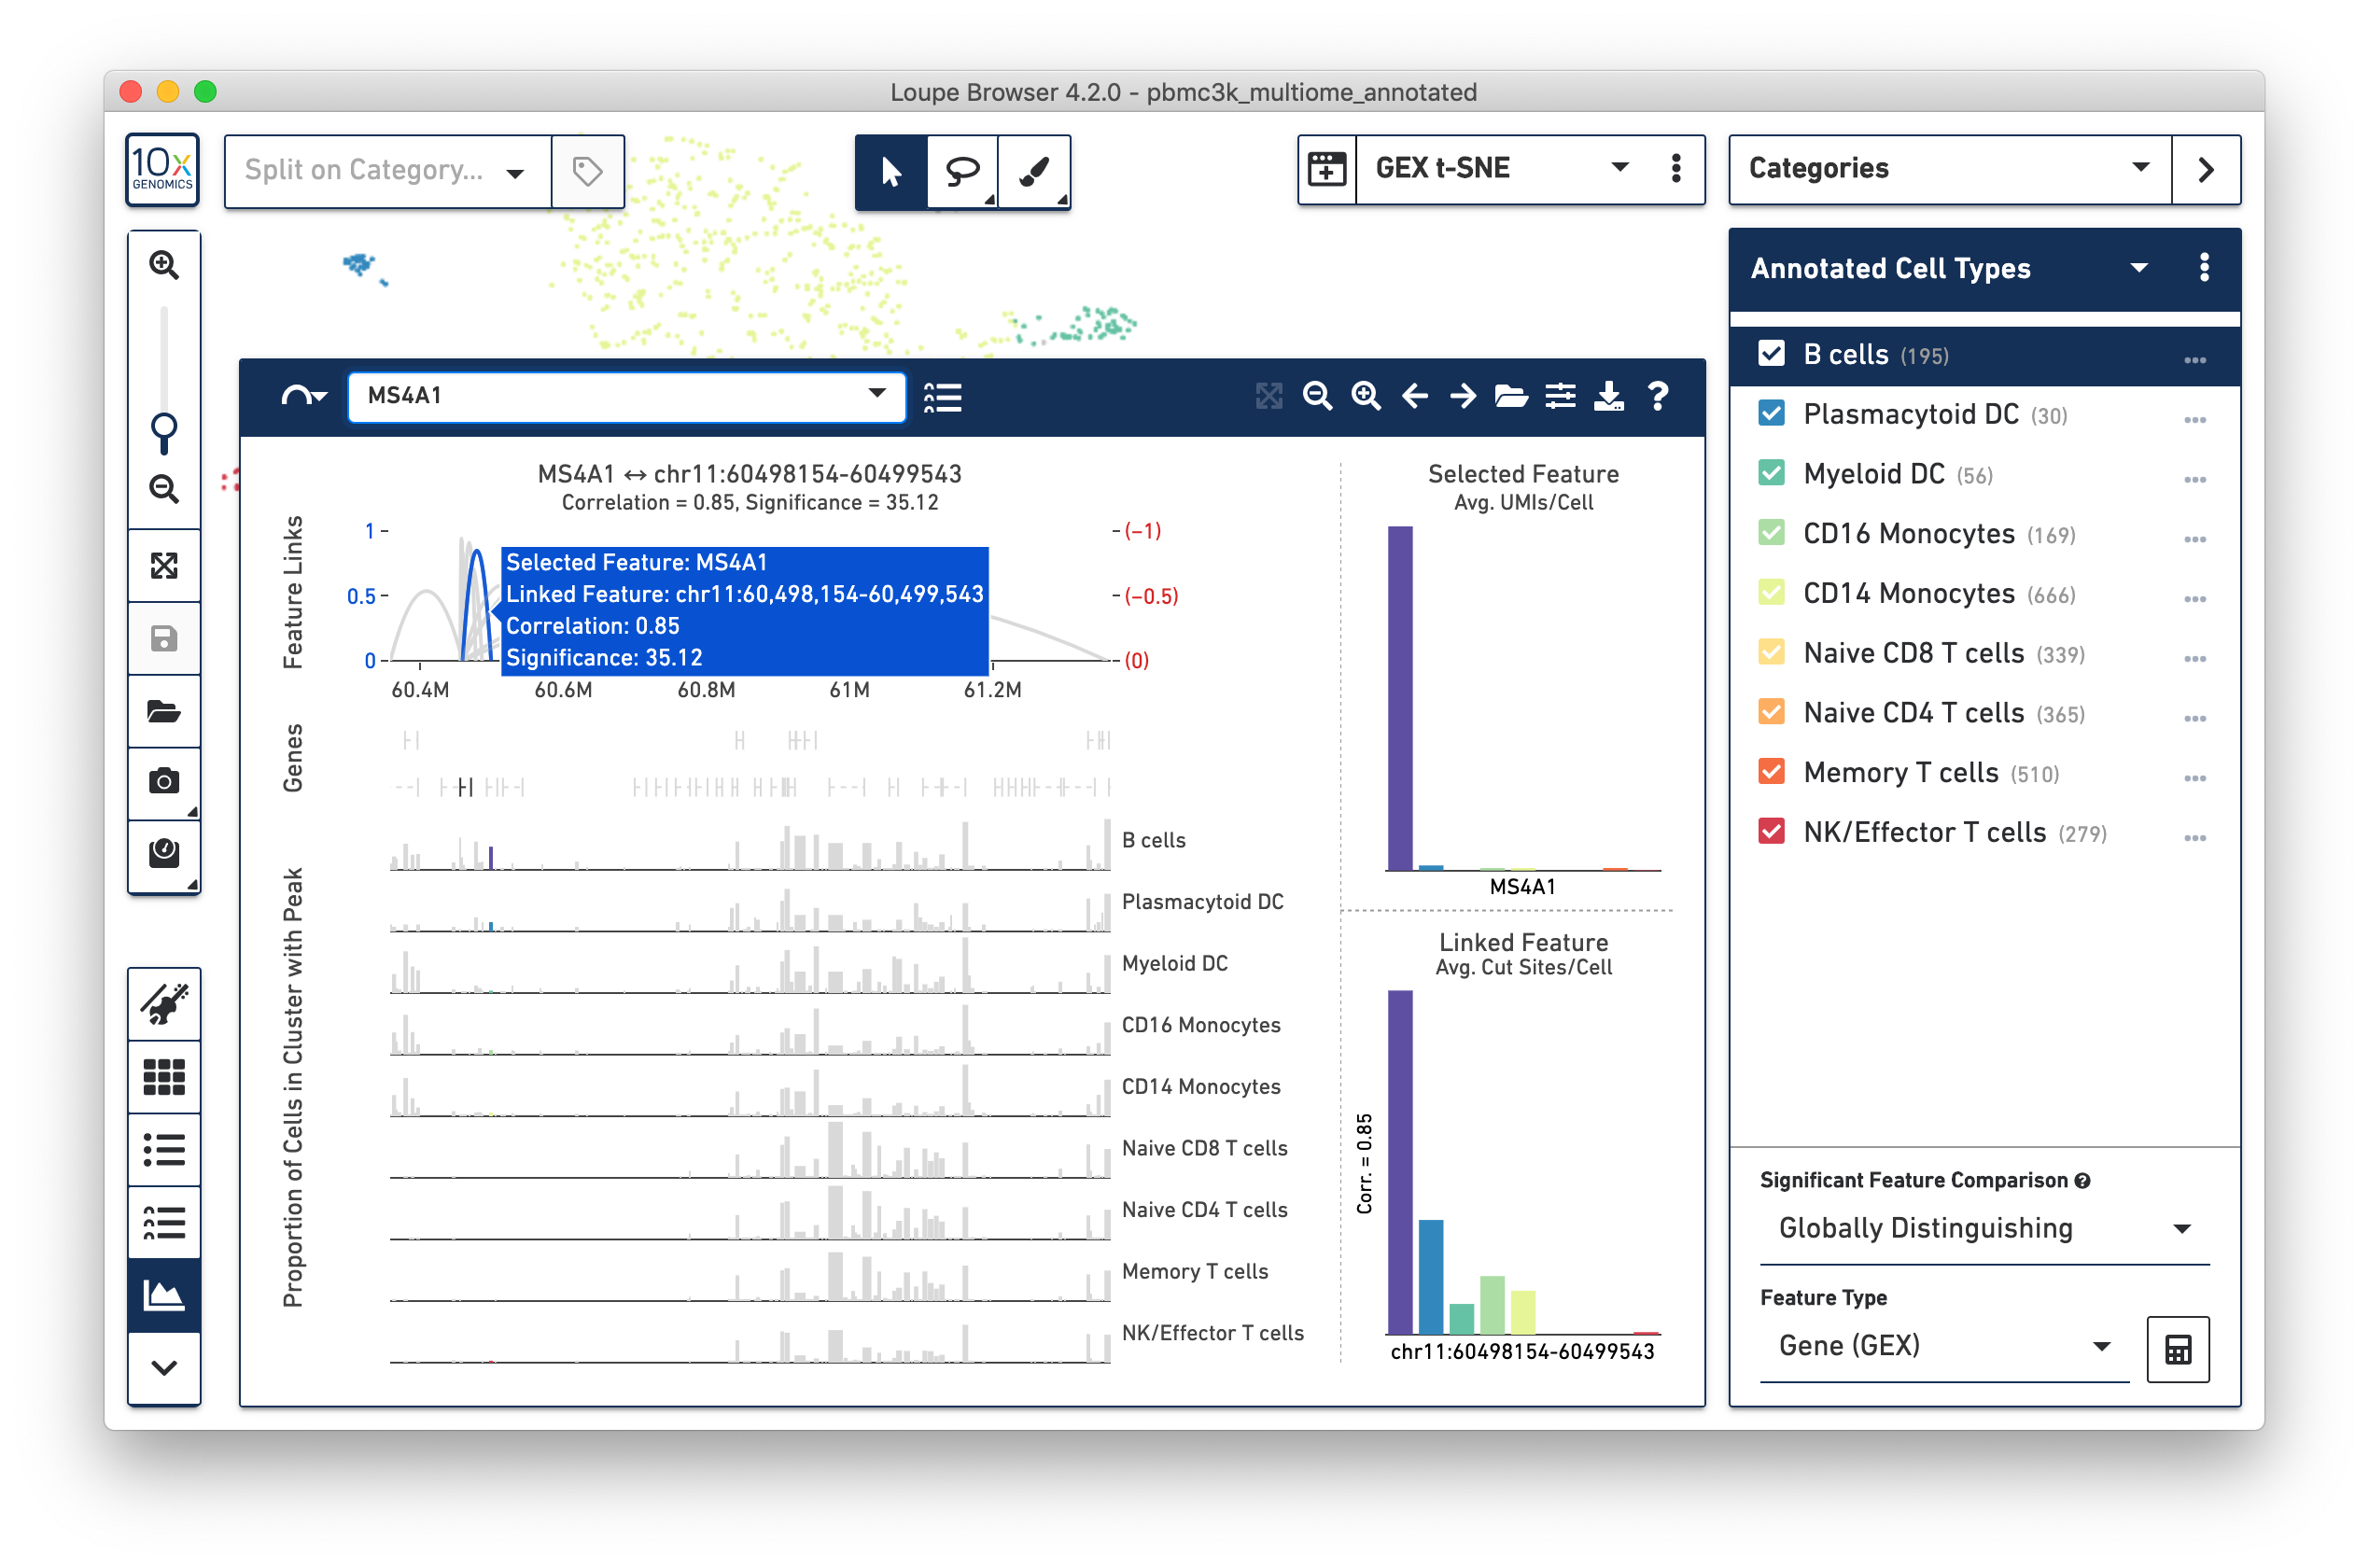
Clicking on an individual arc, as shown above, will show the distributions of both the selected feature and the chosen linked feature, regardless of whether the selected feature is a gene or peak. In the above graphic, MS4A1 is the selected feature, and a nearby peak is the chosen linked feature.
If a selected feature has many linked features, it is possible to reduce visual clutter a little bit by limiting drawn arcs to arcs with higher correlations. Clicking on the Options button brings up the Feature Linkage View options menu. The menu includes the same customization options as in the ATAC Peak Viewer, but also includes a slider for filtering links:
Finally, both the Feature Linkage Table and View can be reached in a variety of ways within a multiomic dataset. Hovering over any feature in the feature list will bring up both the feature table and feature view icons:
Clicking on either icon will set that feature as the selected feature within the linkage table or view. In addition, it is also possible to view the linkages for a particular gene or peak from the differential expression data table, by clicking on the name of a feature.
Hopefully this example has shown how easy and quick it is to analyze Single Cell Multiome ATAC + Gene Expression data through Loupe Browser. We're looking forward to seeing where your Loupe data exploration takes you.