Cell Ranger5.0, printed on 04/01/2025
While most of the antibody-related metrics and counts are computed in parallel to their gene expression counterparts, there are some unique aspects of protein libraries that require specific analysis steps in Cell Ranger.
Protein aggregates in antibody staining experiments cause a few GEMs to have extremely high UMI counts. There is a two-step process to detect and filter out such GEMS.
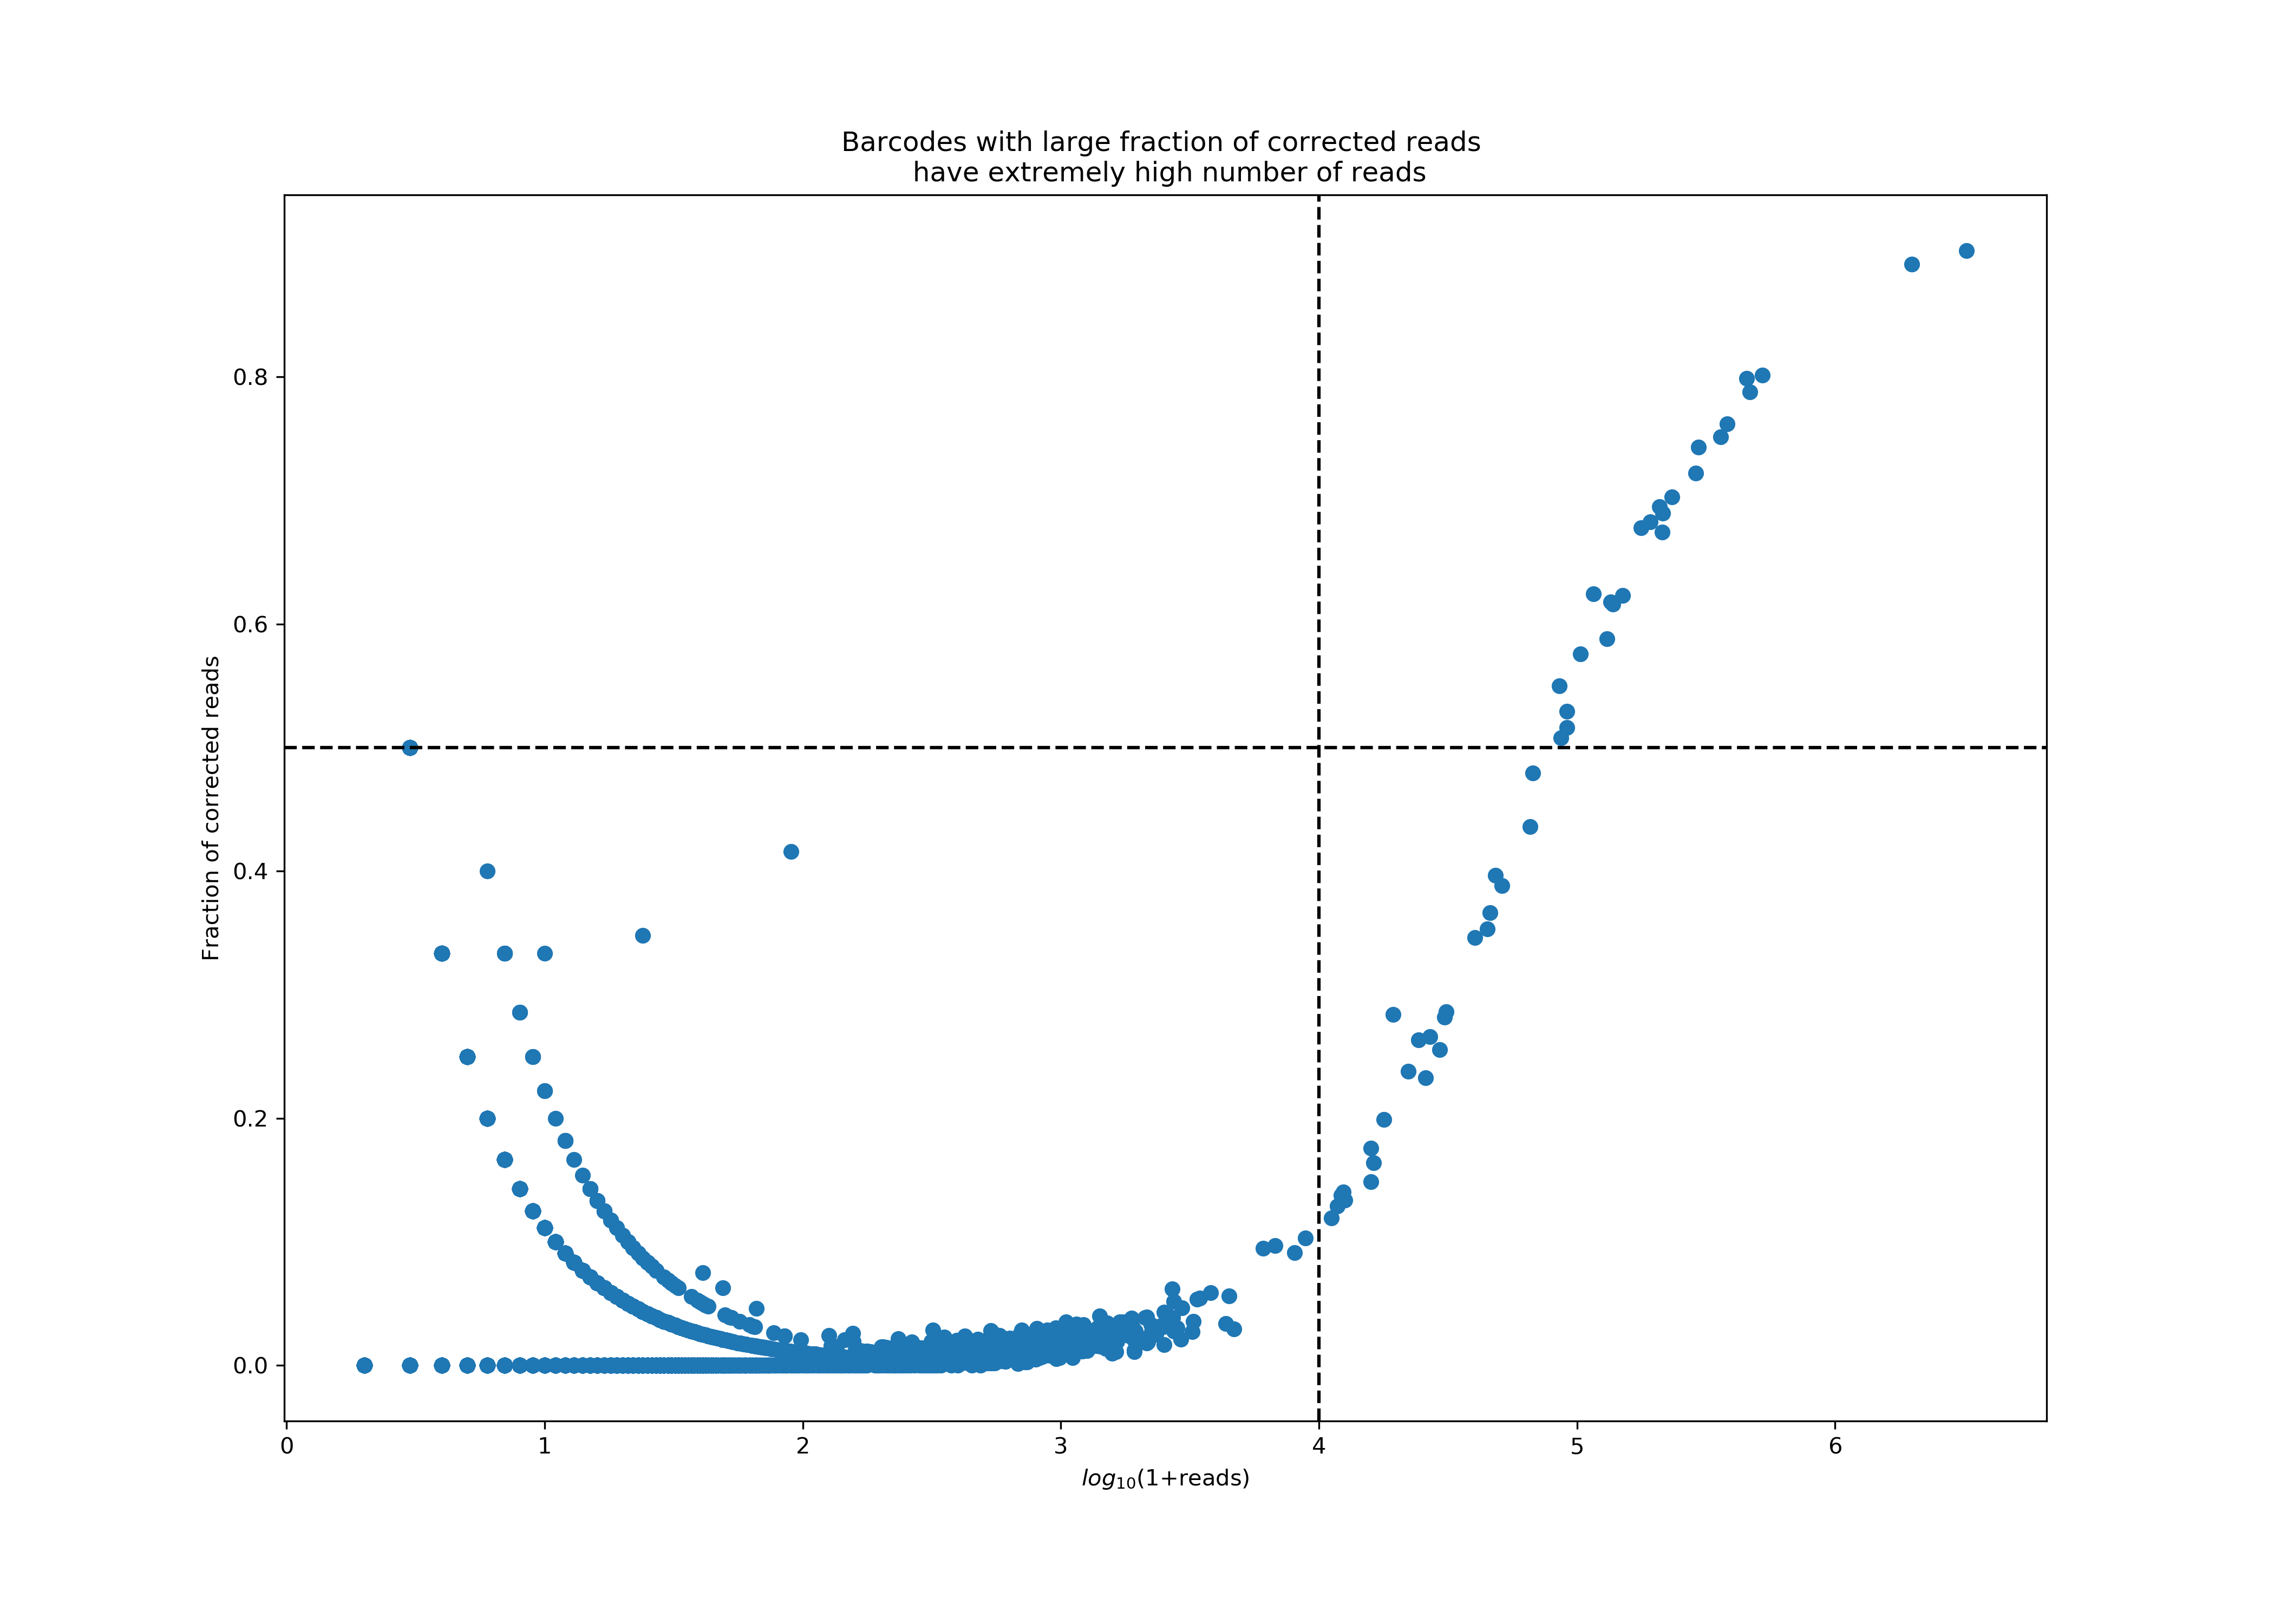
In the first step, as part of the UMI counting pipeline, Cell Ranger looks for pairs of UMIs that are different only in one base (i.e., are Hamming distance 1 apart) and implements a UMI correction step, during which these reads will be combined into a single UMI count by correcting the UMI with fewer reads into the UMI with more reads. While such correction events are typically rare, we observed that in Antibody libraries sometimes the corrections rates are abnormally high, a phenomenon that always correlates with extremely high UMI counts. These high UMI counts will cause saturation of the UMI space, leading to false UMI corrections. Protein aggregates are one leading cause of such high UMI counts and correction rates.
The plot below shows a particularly bad example of protein aggregation, where a handful of barcodes accounted for almost 77% of all reads, with extremely high correction rates in these reads. Currently, we consider a barcode an aggregate if it has more than 10K reads, 50% of which were corrected.
In the second step, in addition to tracking UMI correction events and using the high correction rate as a flag for protein aggregation, Cell Ranger directly uses protein counts to deduce aggregation events. The key insight is that large antibody panels are typically used to stain a wide diversity of cell types, and seeing high counts of many unrelated proteins in a GEM is a sign that such a GEM contains protein aggregates.
This algorithm activates only if 5 or more antibodies (or antigens, or dextramers, or other features specified as "Antibody Capture" in the provided feature reference) with at least 1000 counts are detected. Using the total number of such features, Cell Ranger automatically decides which percentage of those need to be detected on a GEM for it be considered further. Next, if in such GEMs the required number of antibodies exceed their pre-defined thresholds for high counts (currently defined as being in the 25 highest counts across all GEMs), they will be flagged as protein aggregates.
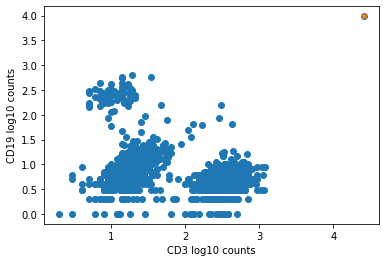
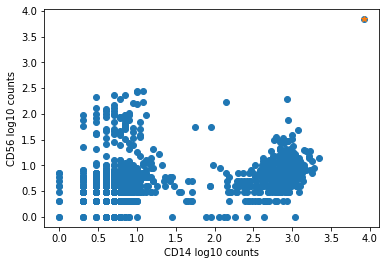
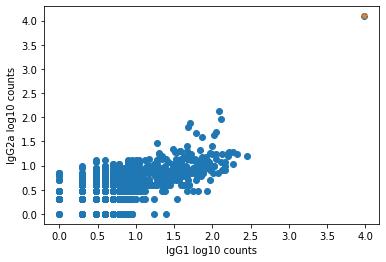
The plot below shows an example of such an aggregate barcode. Completely unrelated antibodies such as CD3, CD19, CD14, CD56, and even mouse isotype controls IgG1 and IgG2a are enriched in the barcode marked as orange, which the pipeline flagged as an aggregate.
 |
 |
 |
Cell Ranger combines the aggregates barcodes from both steps above and removes them from the final feature-barcode matrix, and reports the fraction of reads associated with such barcodes in the Antibody: Fraction Reads in Aggregate Barcodes metric on the web summary. In addition, two more related metrics are available in metrics_summary.json; Antibody: Number of Aggregate Barcodes is the number of detected aggregate barcodes, and Antibody: Fraction Reads that have Corrected UMIs is the fraction of all reads that have a correction event.
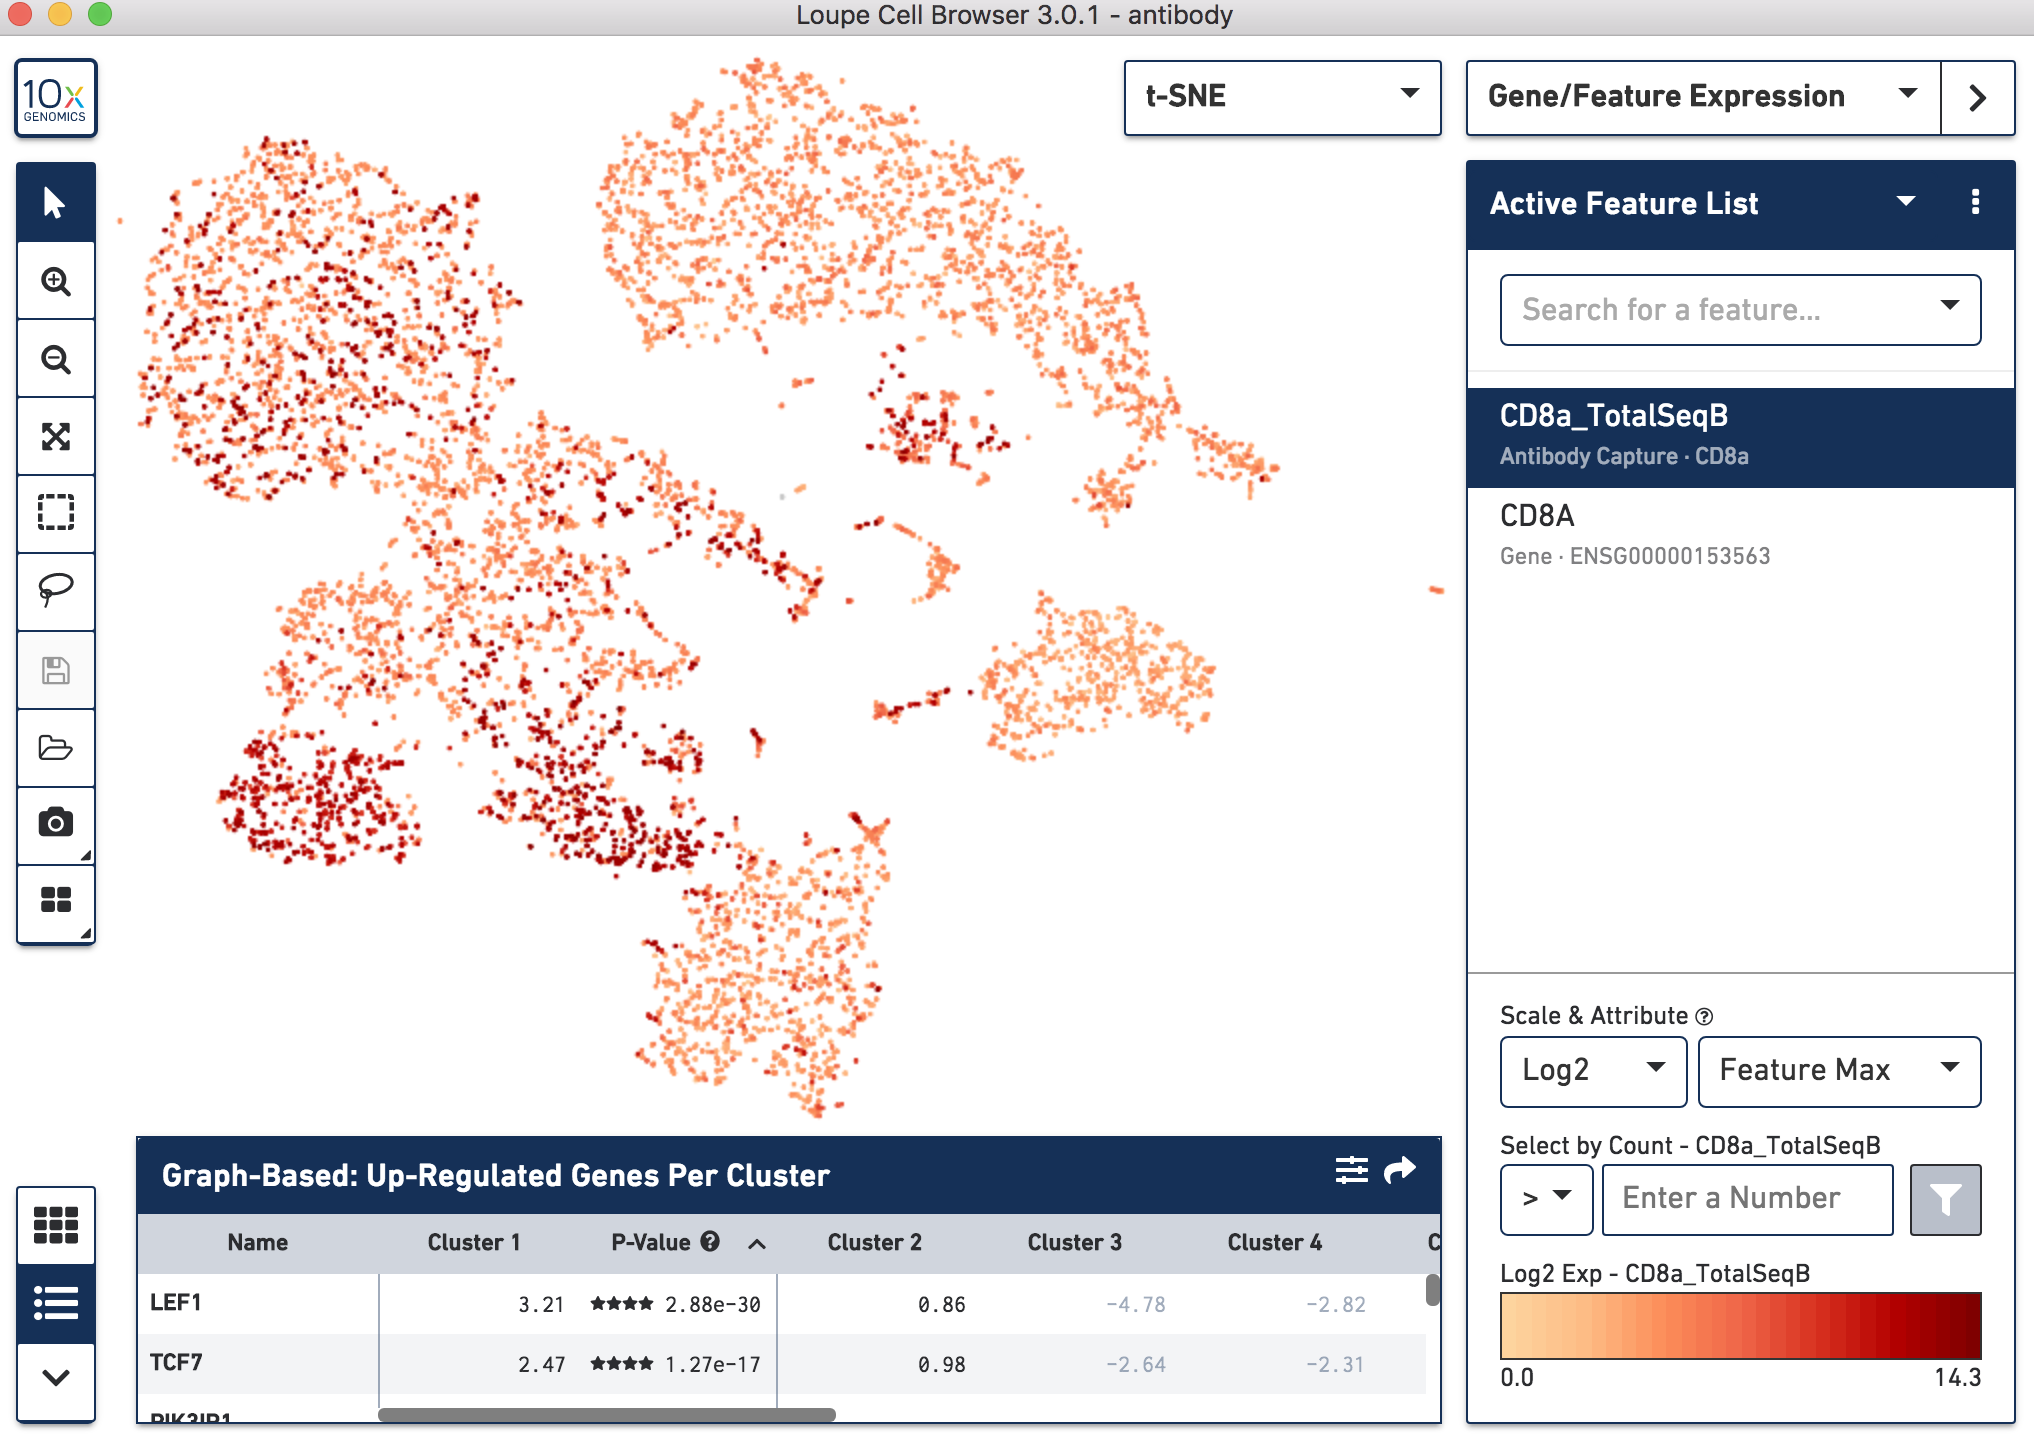
Since cell-surface proteins offer a unique and complementary view of the cell types on top of the genes they express, Cell Ranger runs a popular t-distributed Stochastic Neighbor Embedding (t-SNE) algorithm to visualize the protein counts in 2-D space. On samples where Antibody Capture is an input library, the pipeline will slice out the feature counts from the full matrix and perform a t-SNE on these raw counts (unlike the gene expression part of the matrix, where t-SNE is run on the PCA-reduced space). These t-SNE projections then can be visualized with the Loupe Browser versions 3.0 and above.
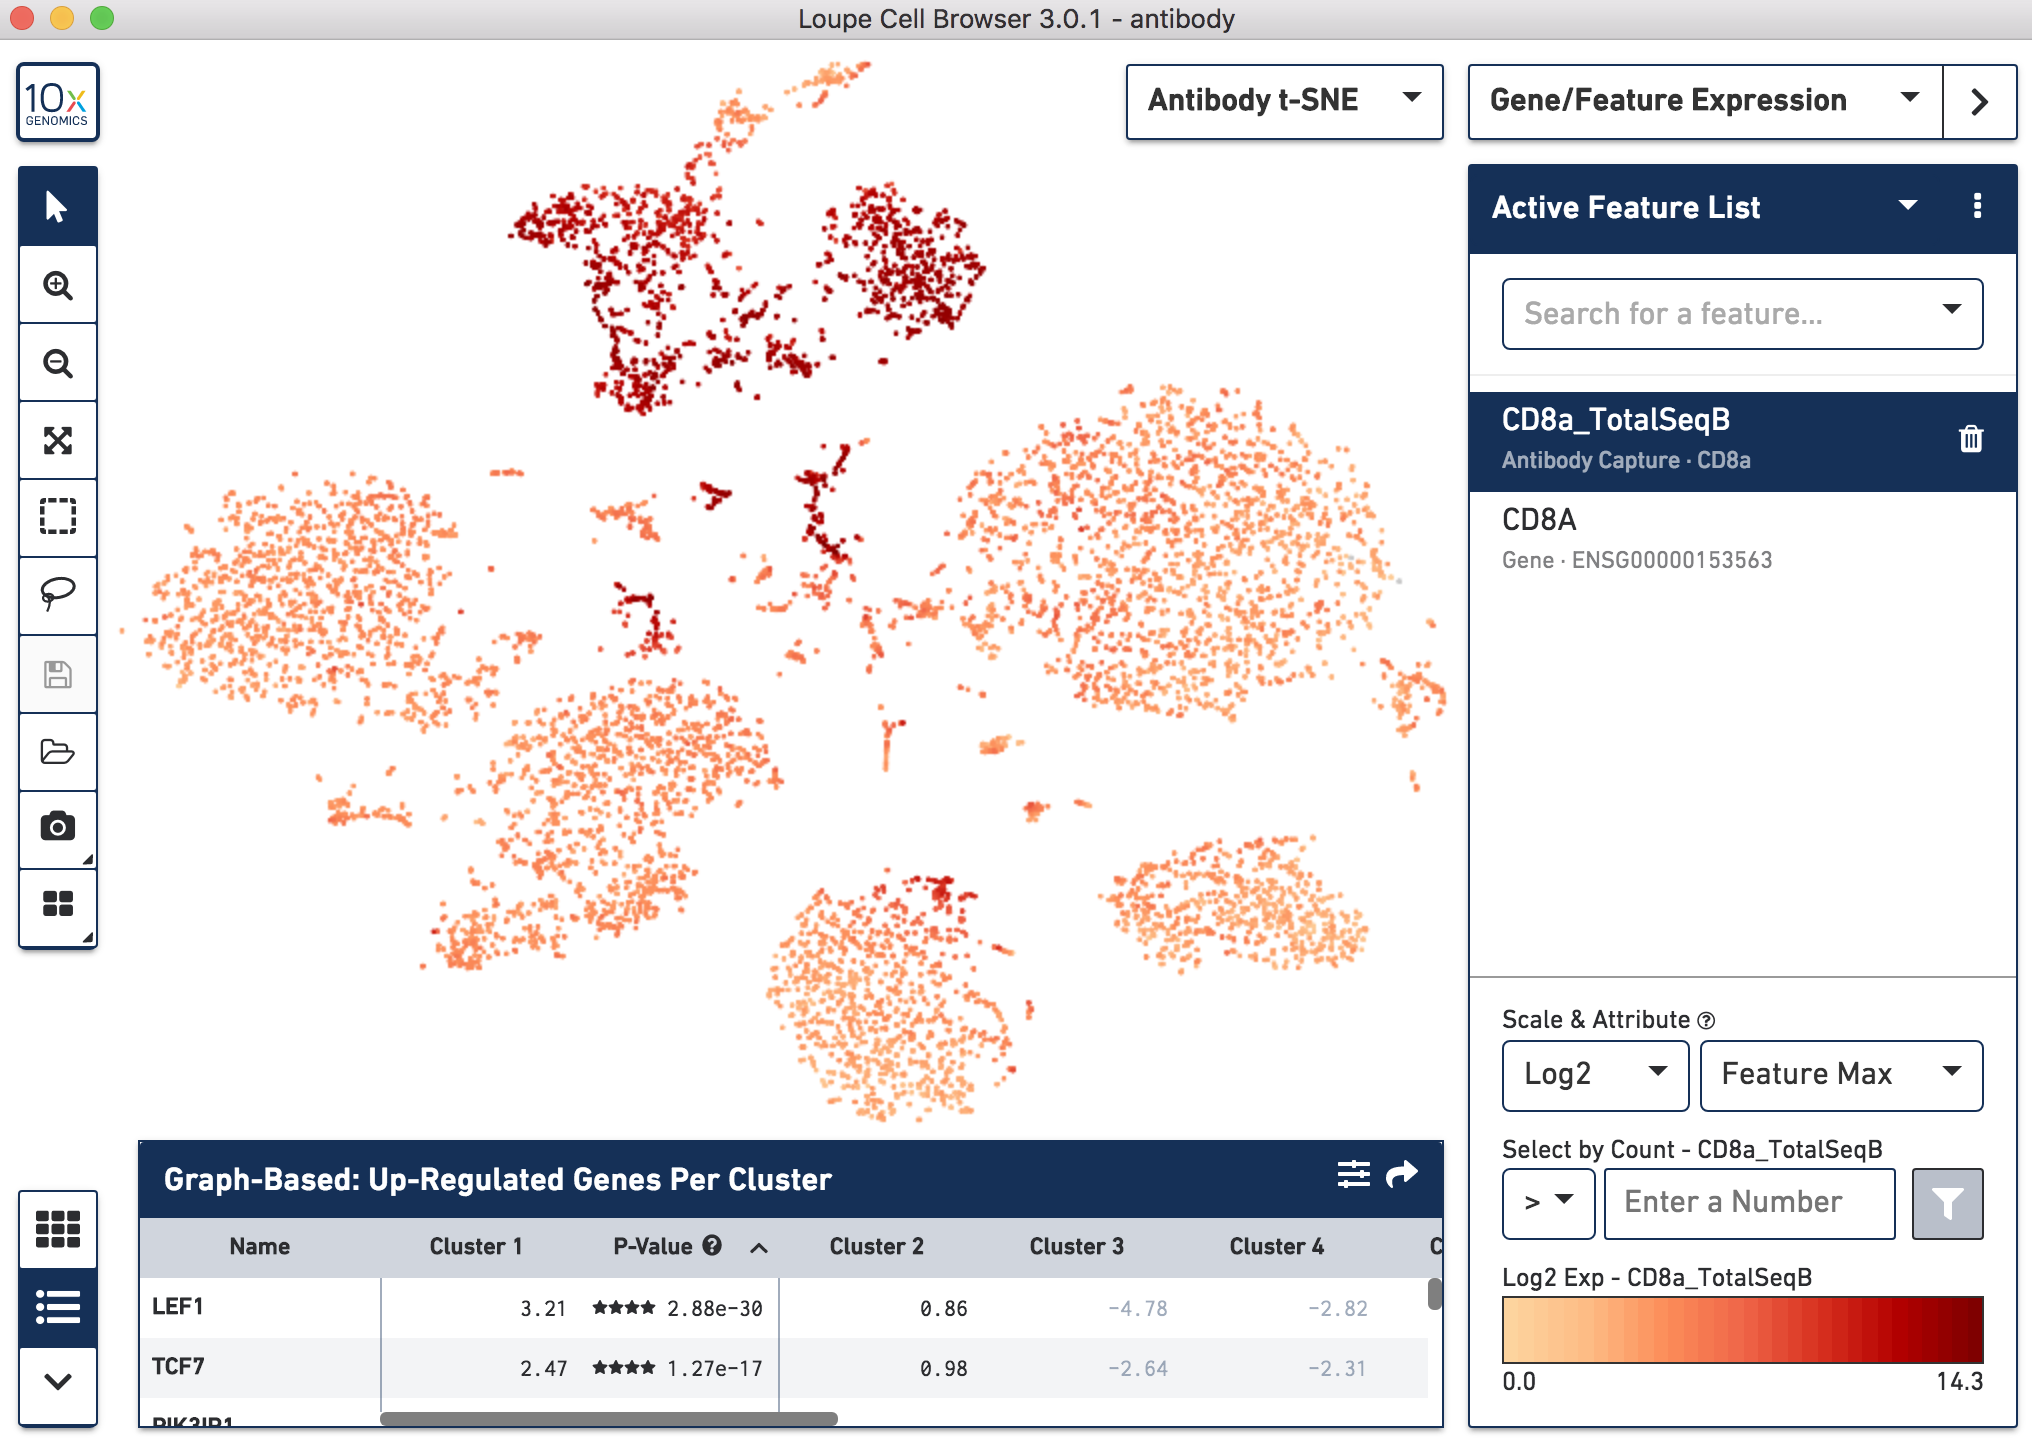
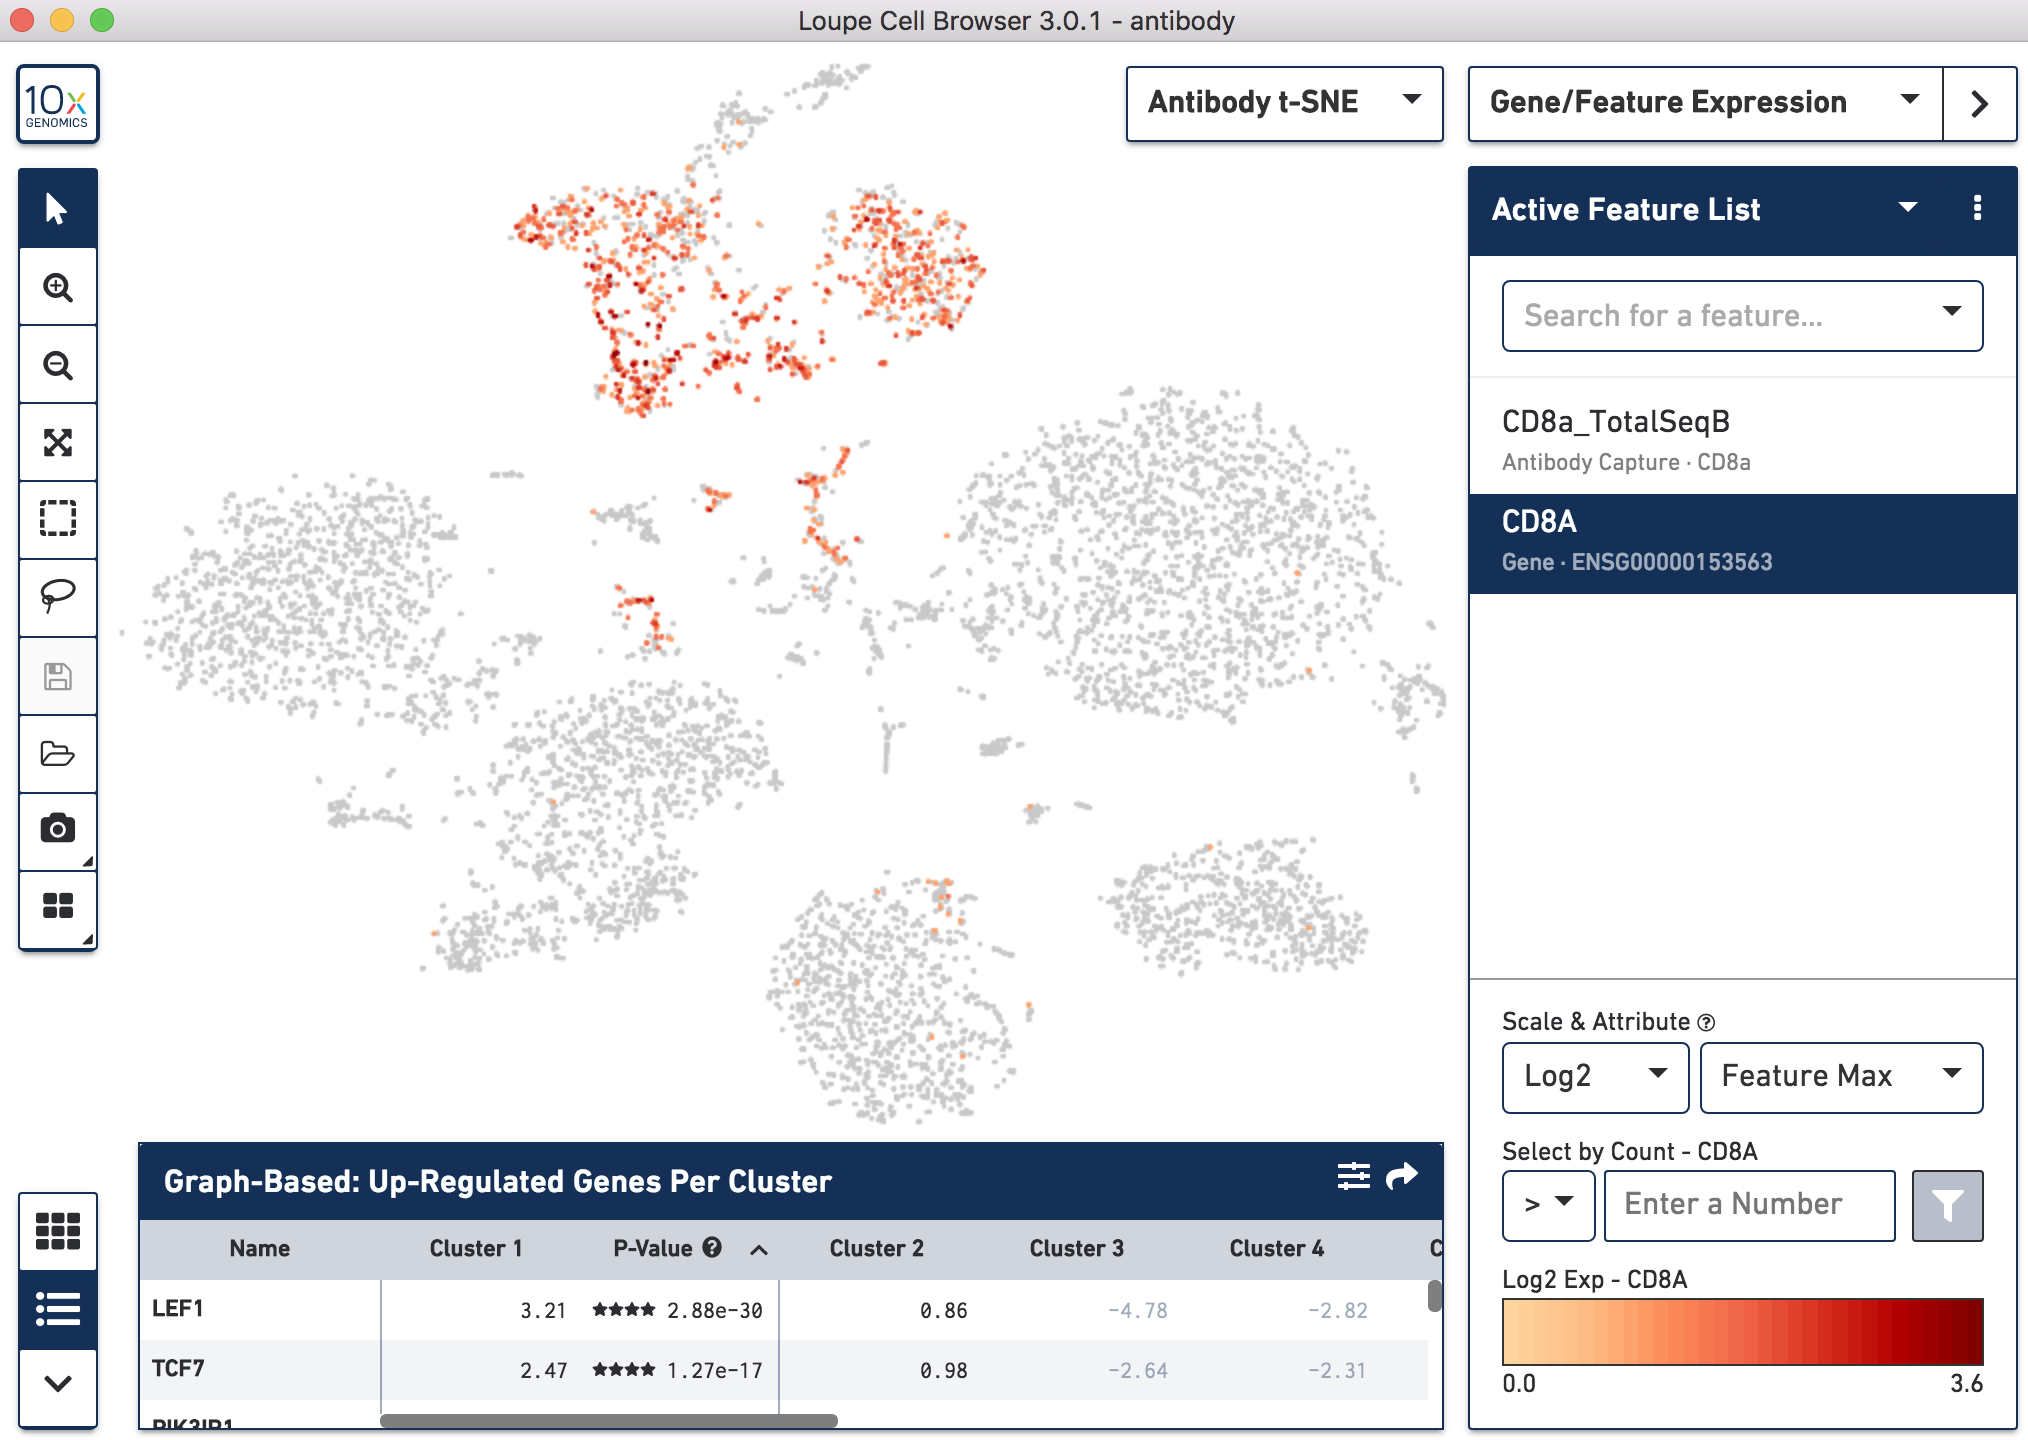
Below, the left panel shows a traditional t-SNE with gene counts only, overlaying the counts of CD8a antibody. The middle panel shows CD8a protein expression overlaid on t-SNE projections computed on antibody counts only. The right panel shows the expression of CD8A gene on the antibody-derived t-SNE projections for comparison.
 |
 |
 |