Cell Ranger ATAC6.4, printed on 03/31/2025
NOTE: This section presumes that you have created cell type clusters in the Identifying Cell Types tutorial section. You can follow along roughly by opening the ATAC Tutorial dataset, and choosing the K-Medoids (LSA) Cluster, with K=4.
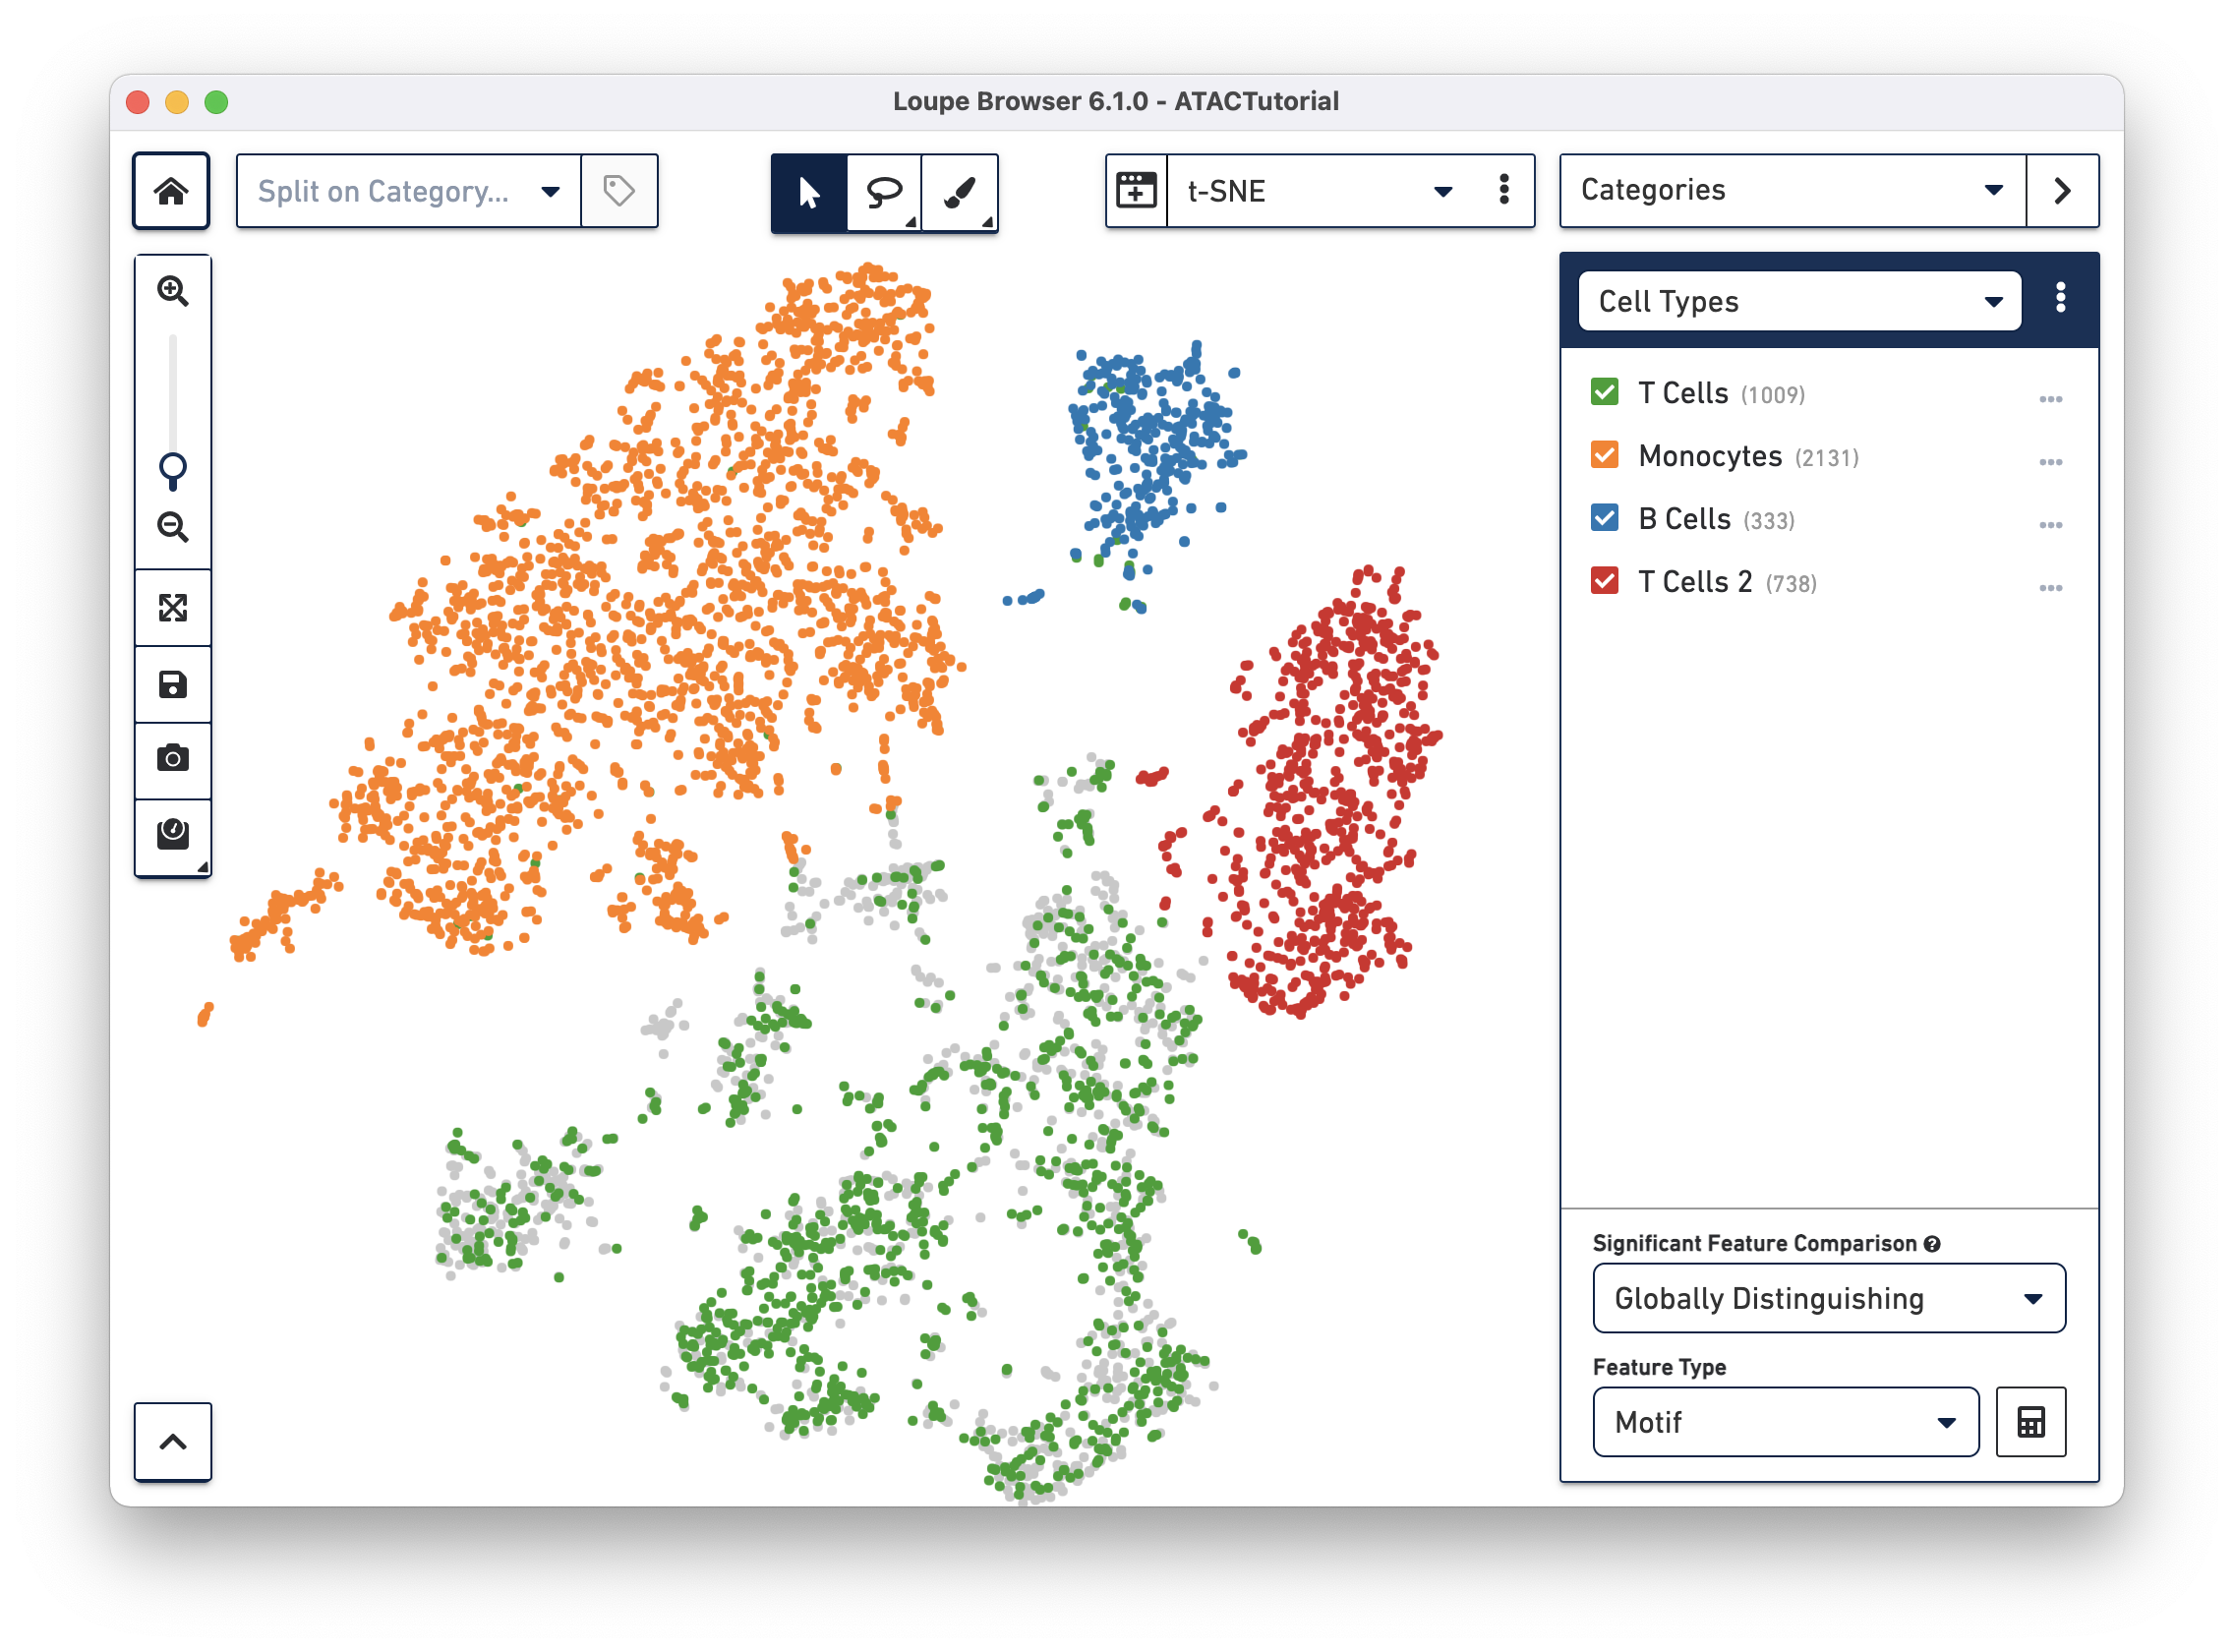
In the barcode plot, look at the region with T cell markers. Dimensionality reduction via LSA and subsequent clustering separates the T cells into a few separate groups, as seen on the t-SNE plot. What might be driving differences between those subgroups? We can use the Significant Features tool to find out.
Cell Ranger ATAC 1.1 and later use a different differential accessibility algorithm than Cell Ranger ATAC 1.1 1.0 and Loupe Browser 4.0.0. You can read more about the changes in the algorithm documentation.
First, let's create a second T cell group by using the lasso tool to highlight the rightmost cluster of T cells and label it "T Cells 2", as shown below.
To get a hint of what is distinguishing these clusters, we can use the Significant Features tool, located below the active cluster list. Loupe Browser uses the same statistical method as Cell Ranger to calculate differential gene expression.
With the Significant Features tool, you can compute distinguishing motifs, individual peaks, or promoter sums between currently selected clusters.
The tool computes significant features by one of two ways, selectable via the Significant Feature Comparison selector:
The Feature Type selector allows you to select between available feature types. You can only look at one feature type at a time, as the sSEQ significant feature calculation relies on a common denominator of feature counts; there are different total sums across the dataset for peaks, promoter sums, and motifs.
Start by doing a sanity check and finding distinguishing promoter sums for each cell type. First, make the Feature Table visible by clicking on the list icon to the left of the bottom panel. Next, with the Cell Types category visible in Categories mode, choose Globally Distinguishing from the comparison selector, and Promoter Sum as the Feature Type. Press the calculator icon, and wait for Loupe Browser to compute significantly enriched promoter sums. This operation takes about 30 seconds, depending on your machine's performance. This calculation takes longer for datasets with more cells or higher depth, and longer when finding significant peaks.
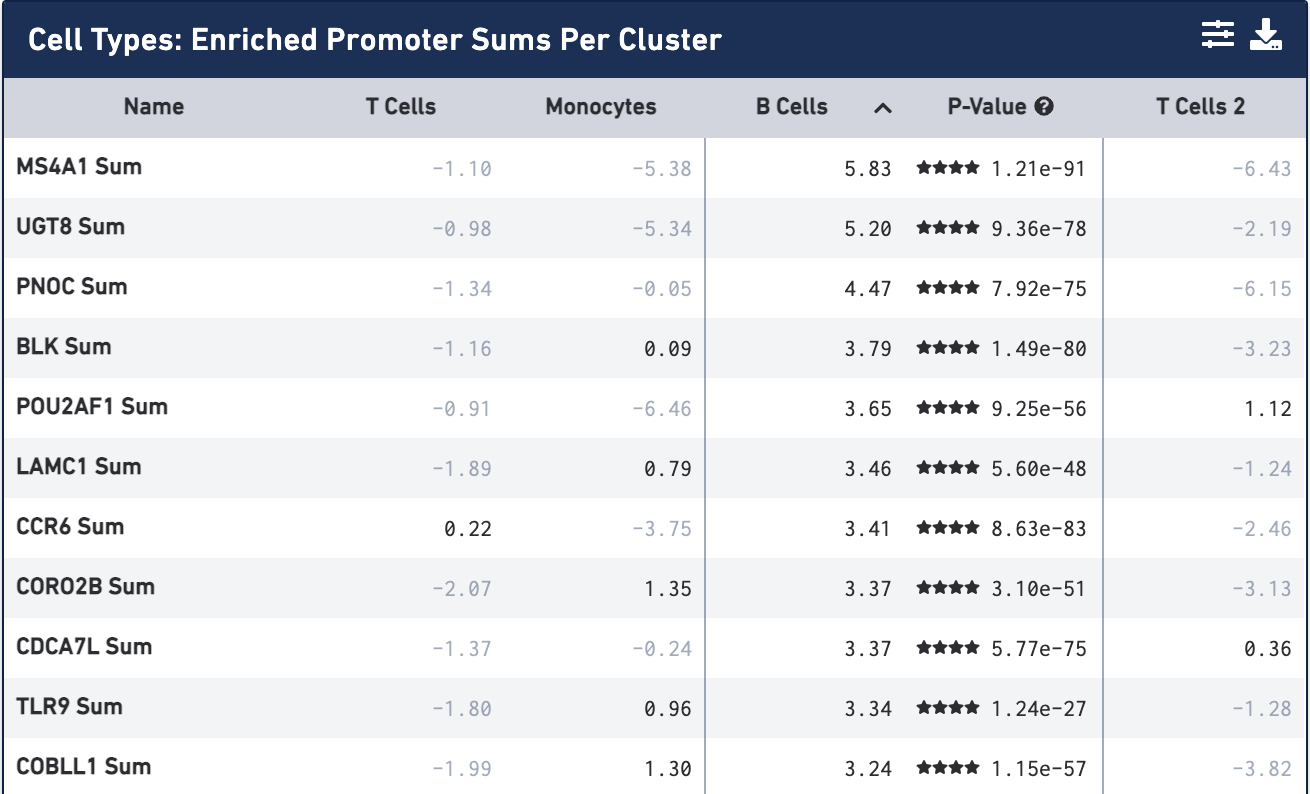
Once the calculation completes, you see the most significantly enriched promoter sums for the first cell type, with accompanying log2 fold change against the other cells, sorted by p-value:
By default, the most comparatively enriched motifs, peaks or promoter sums will be calculated, though that is configurable through the Feature Table Options menu, accessible on the feature table's menu bar.
Not surprisingly, the most significantly enriched promoter sum is MS4A1 (CD20), which we used to identify the B cell cluster. You can click on the cell type column headers to see the feature lists for the other cell types. Once a cell type is selected, clicking on the cell header again will sort the features by log2 fold change.
Next, we will explore the differences between the two T cell clusters. In the Categories panel, uncheck the B Cells and Monocytes clusters, and then select Locally Distinguishing from the comparison selector. Let's also choose Motif as the desired Feature Type, and compute the significant motifs.
After computation, the feature table now shows the motifs that are most differentially accessible between the two T cell groups. To verify the differences in accessibility, you can highlight the significant motifs in the barcode plot. First, click the Split on Category dropdown menu at the top left (next to the home button), and select "Current Category (Cell Types)". Split View segments the cells in the barcode plot into distinct regions by cluster, even if the cells overlap in the parent t-SNE plot. Next, click on "BATF::JUN" in the feature table. Clicking on a feature in the table allows you to add it to a feature list, copy the name to the clipboard, or to view the accessibility of the feature in the barcode plot. Click Set as Active Feature to see the BATF::JUN motif z-score in the barcode plot:
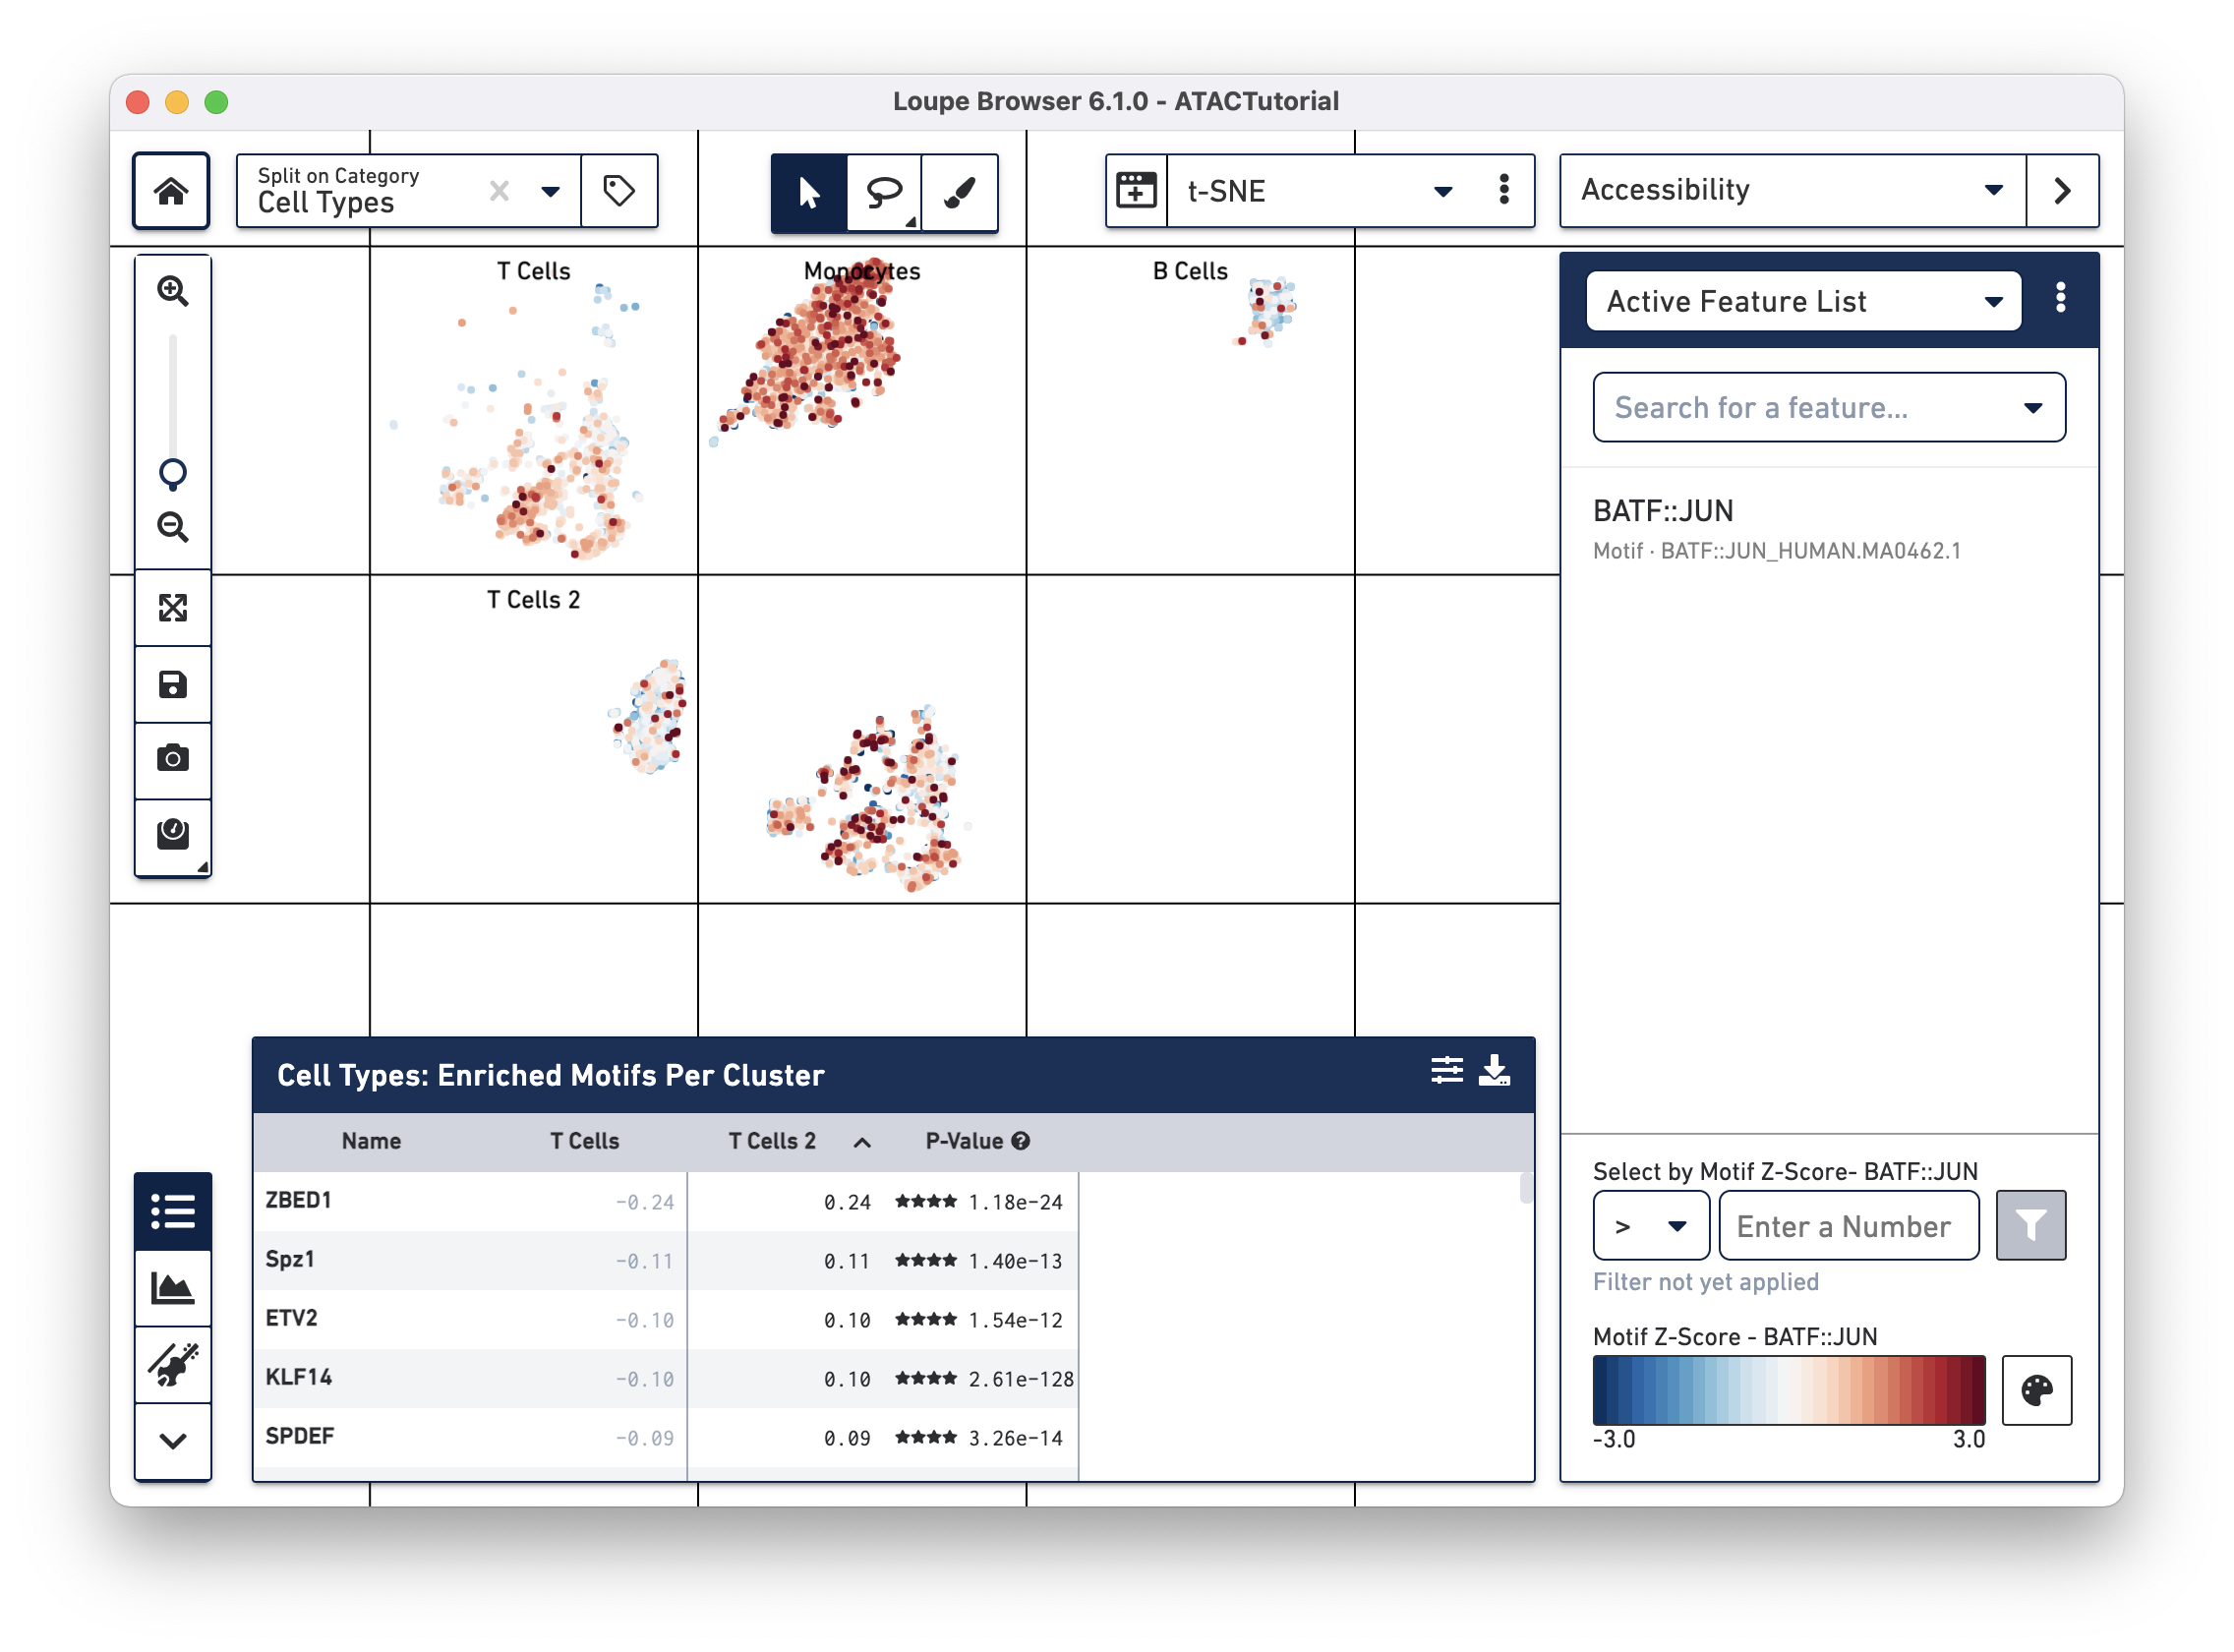
The cells in the T Cell 2 group are bluer, indicating that BATF-associated peaks are less accessible on average in that group than in the T Cell group. BATF accessibility has been shown to increase with cell differentiation and age [1], so this may indicate that the T Cell 2 group is comparised of younger or more naive T cells. It should be noted that the T Cell 2 group contains both cells with accessible CD8A and CD4 promoter regions, indicating a more diverse mix than could be explained by neat separation between helper and cytotoxic T cells.
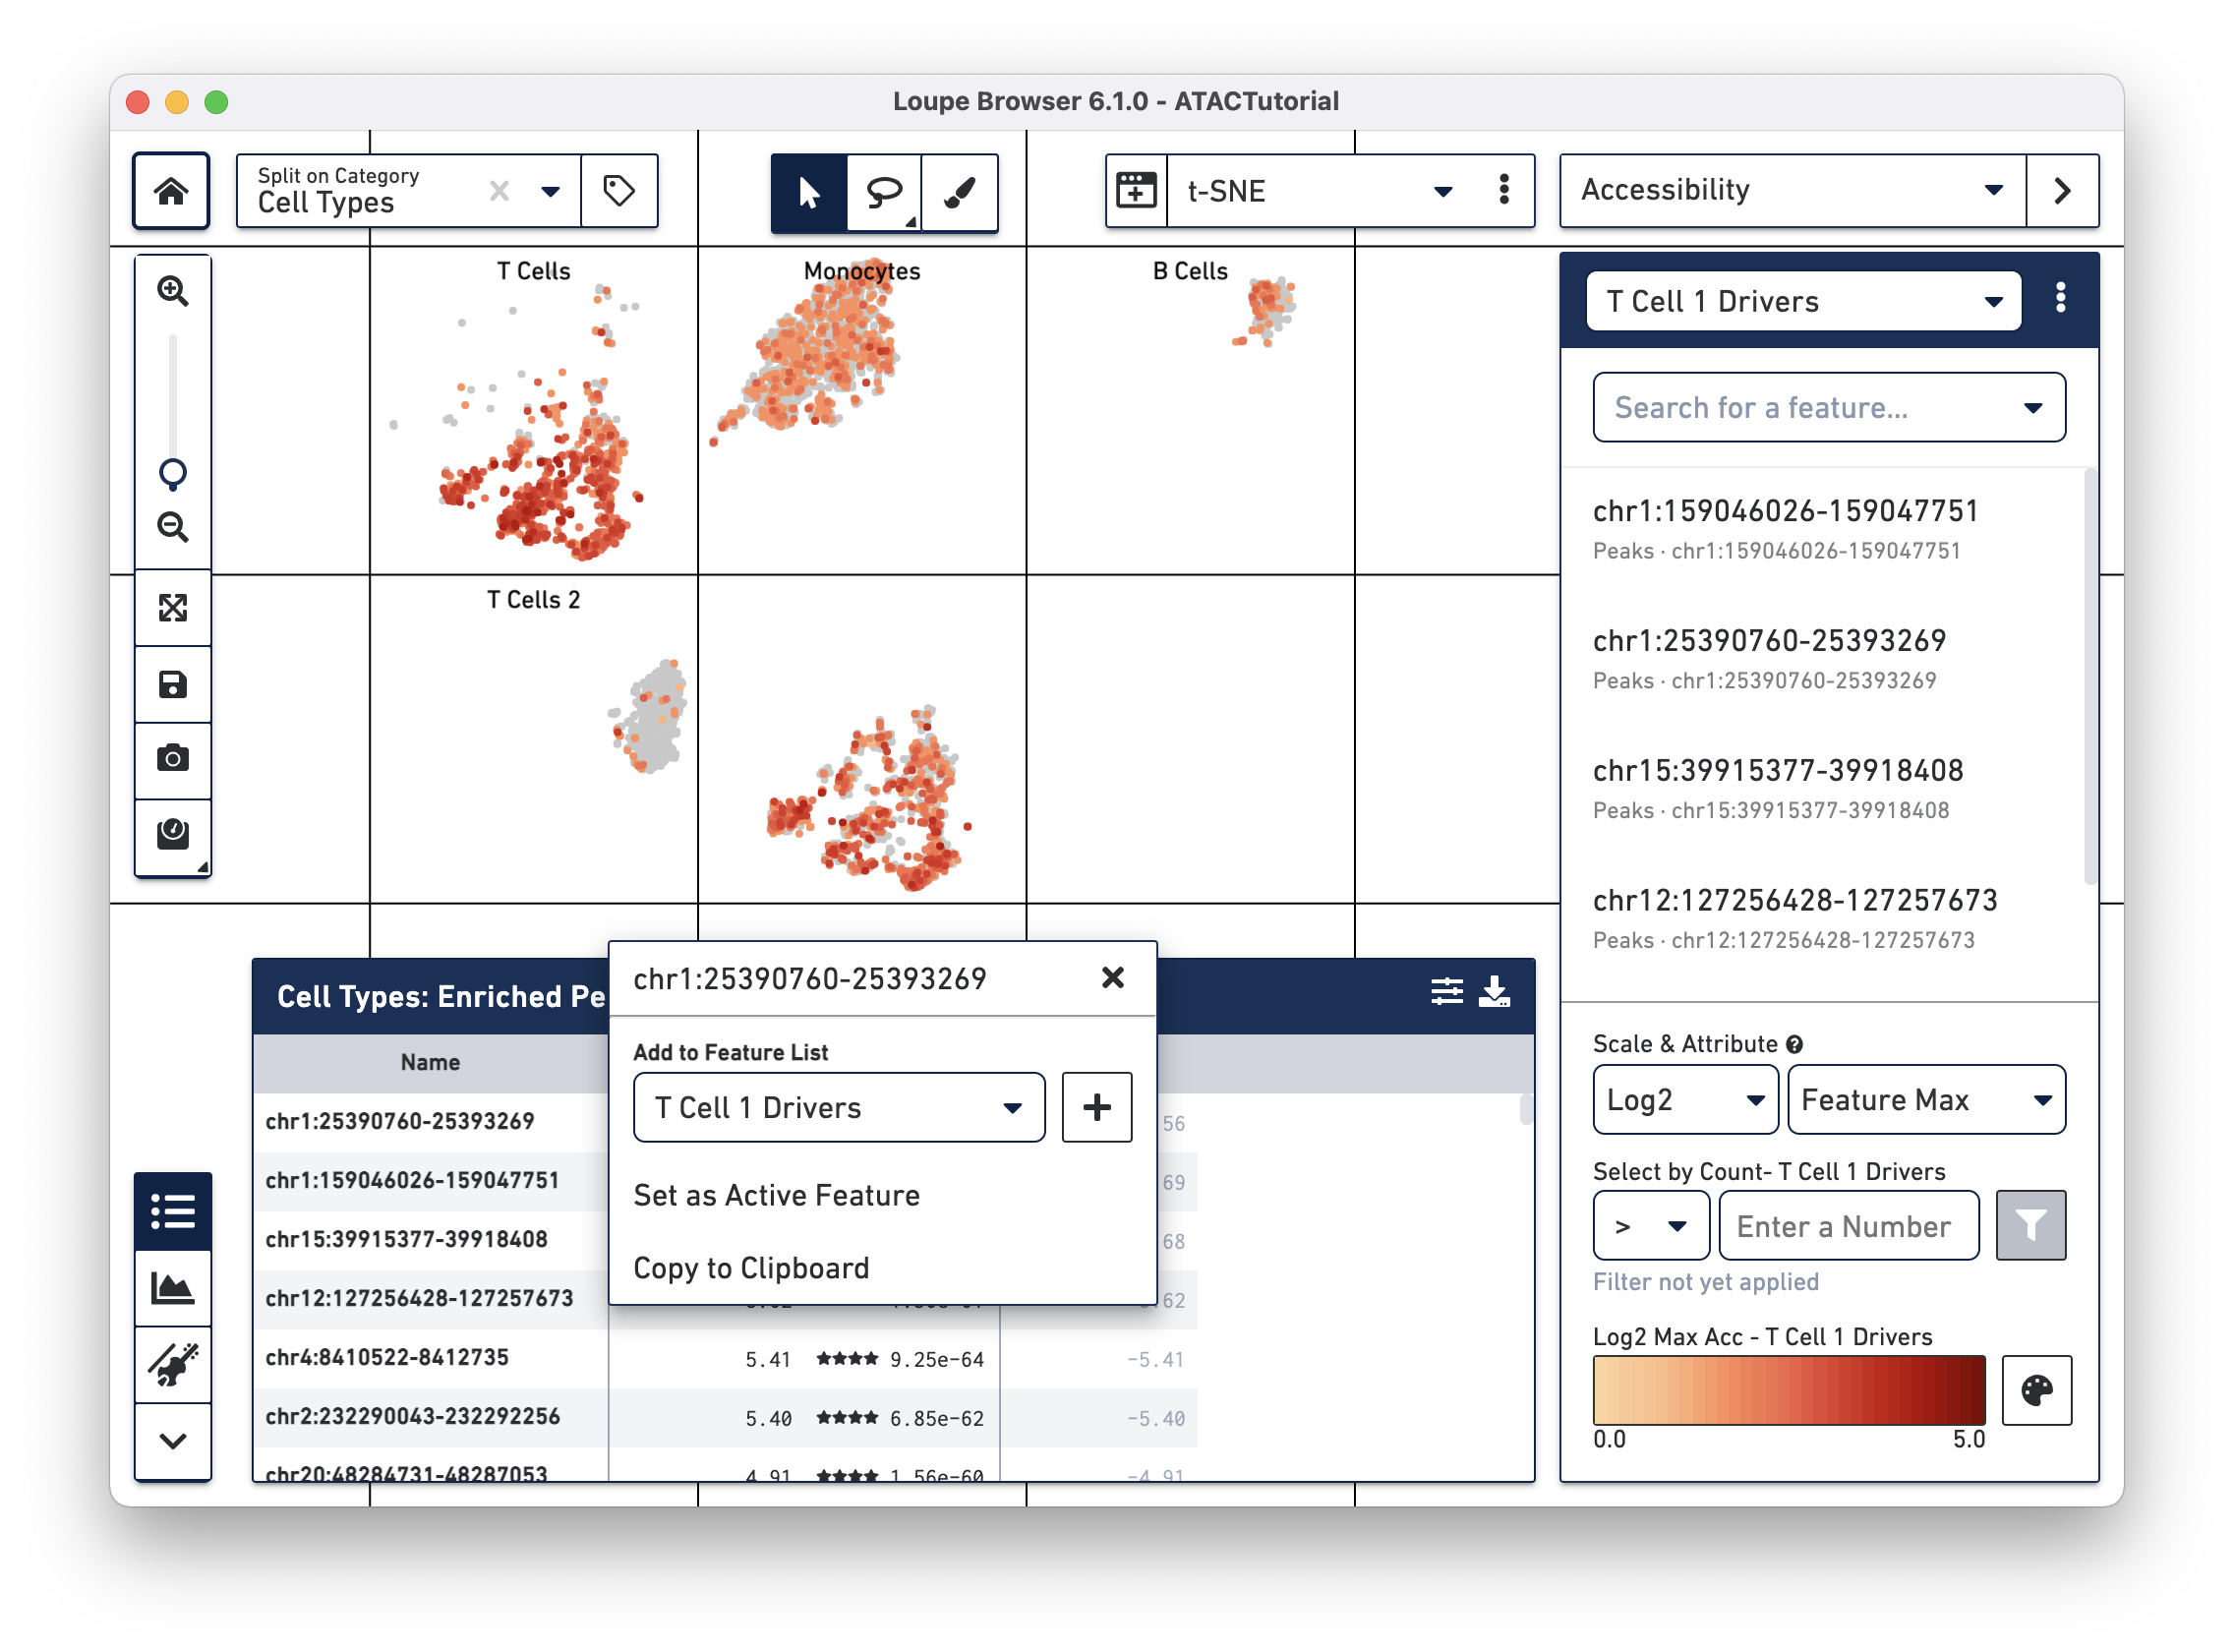
Finally, look for significant peaks between the two T cell clusters. Return to the Categories, and change the Feature Type selector to Peaks. Press the Calculator icon, and wait for a while for the computation to finish.
We will add a few significant peaks in the primary T cell cluster to a feature list. Click on the first five significantly enriched peaks, one at a time, and add them to a new T Cell 1 Drivers list. To create the new list, type T Cell 1 Drivers in the Add to Feature List input field, and select the create new list option. With the list selected, click on the plus icon to add the features to the list.
We can now learn more about these individual peaks. With the T Cell 1 Drivers list selected in Accessibility mode, hover over a peak, and click on the Peak Viewer icon that appears next to the feature. Let's select the first peak in the list, "chr4:6199421-6203901."
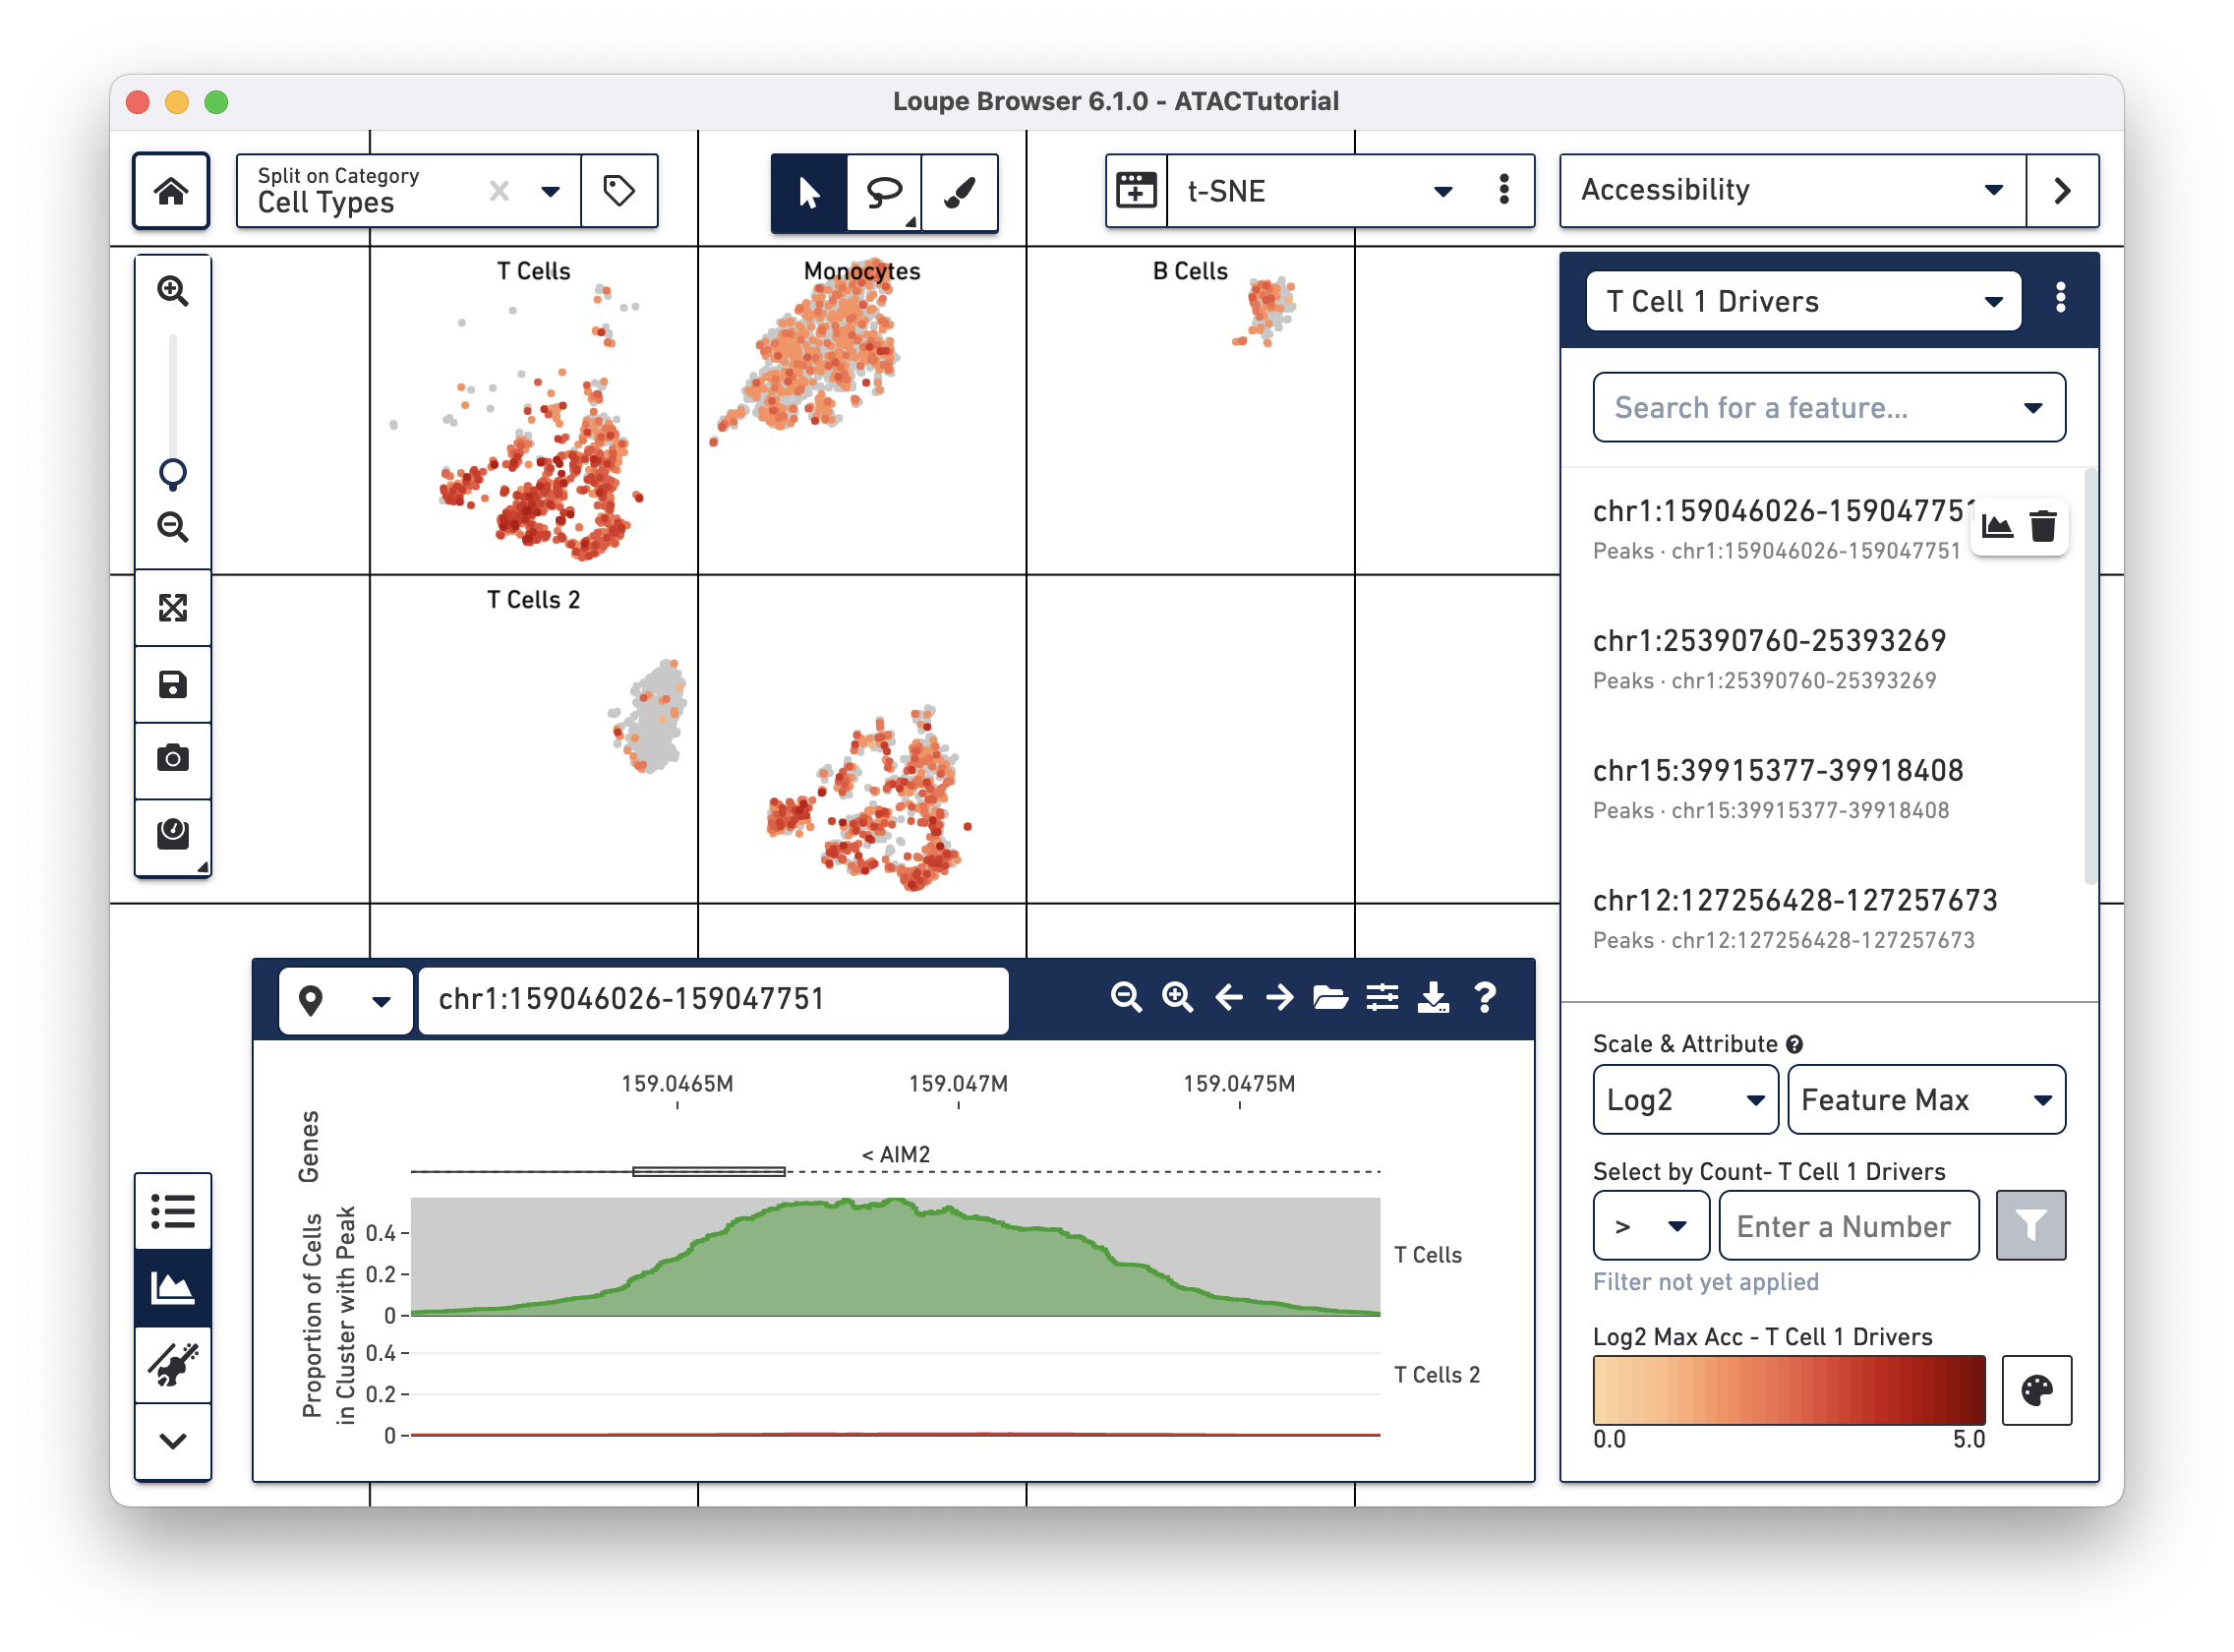
This highlights the peak in the Peak Viewer. Zooming out in the Peak Viewer shows additional context.
In this manner, you should be able to start teasing out additional information about the different cell groups in your data. After analyzing your dataset, saving lists of significant features, and identifying cell types, you can share your findings in a variety of ways with collaborators.
Visit the tutorial on Sharing to find out how.