Cell Ranger ARC1.0, printed on 04/07/2025
Feature linkages are defined as pairs of genomic features, such as peaks and genes, that have significant correlation in signals across cells. Feature linkages provide a basis for inferring enhancer-gene targeting relationships and constructing transcriptional networks. The features with strong linkages are considered to be “co-expressed” and enrich for a shared regulatory mechanism. For example, the accessibility of an enhancer and the expression of its target gene can display a very synchronized differential pattern across a heterogeneous population of cells. A highly accessible enhancer increases transcription factor (TF) binding, which in turn activates (or represses) gene expression. Conversely, when the enhancer is inaccessible, no TF can bind to the enhancer and impact transcription, which leads to reduced target gene expression (Figure 1).
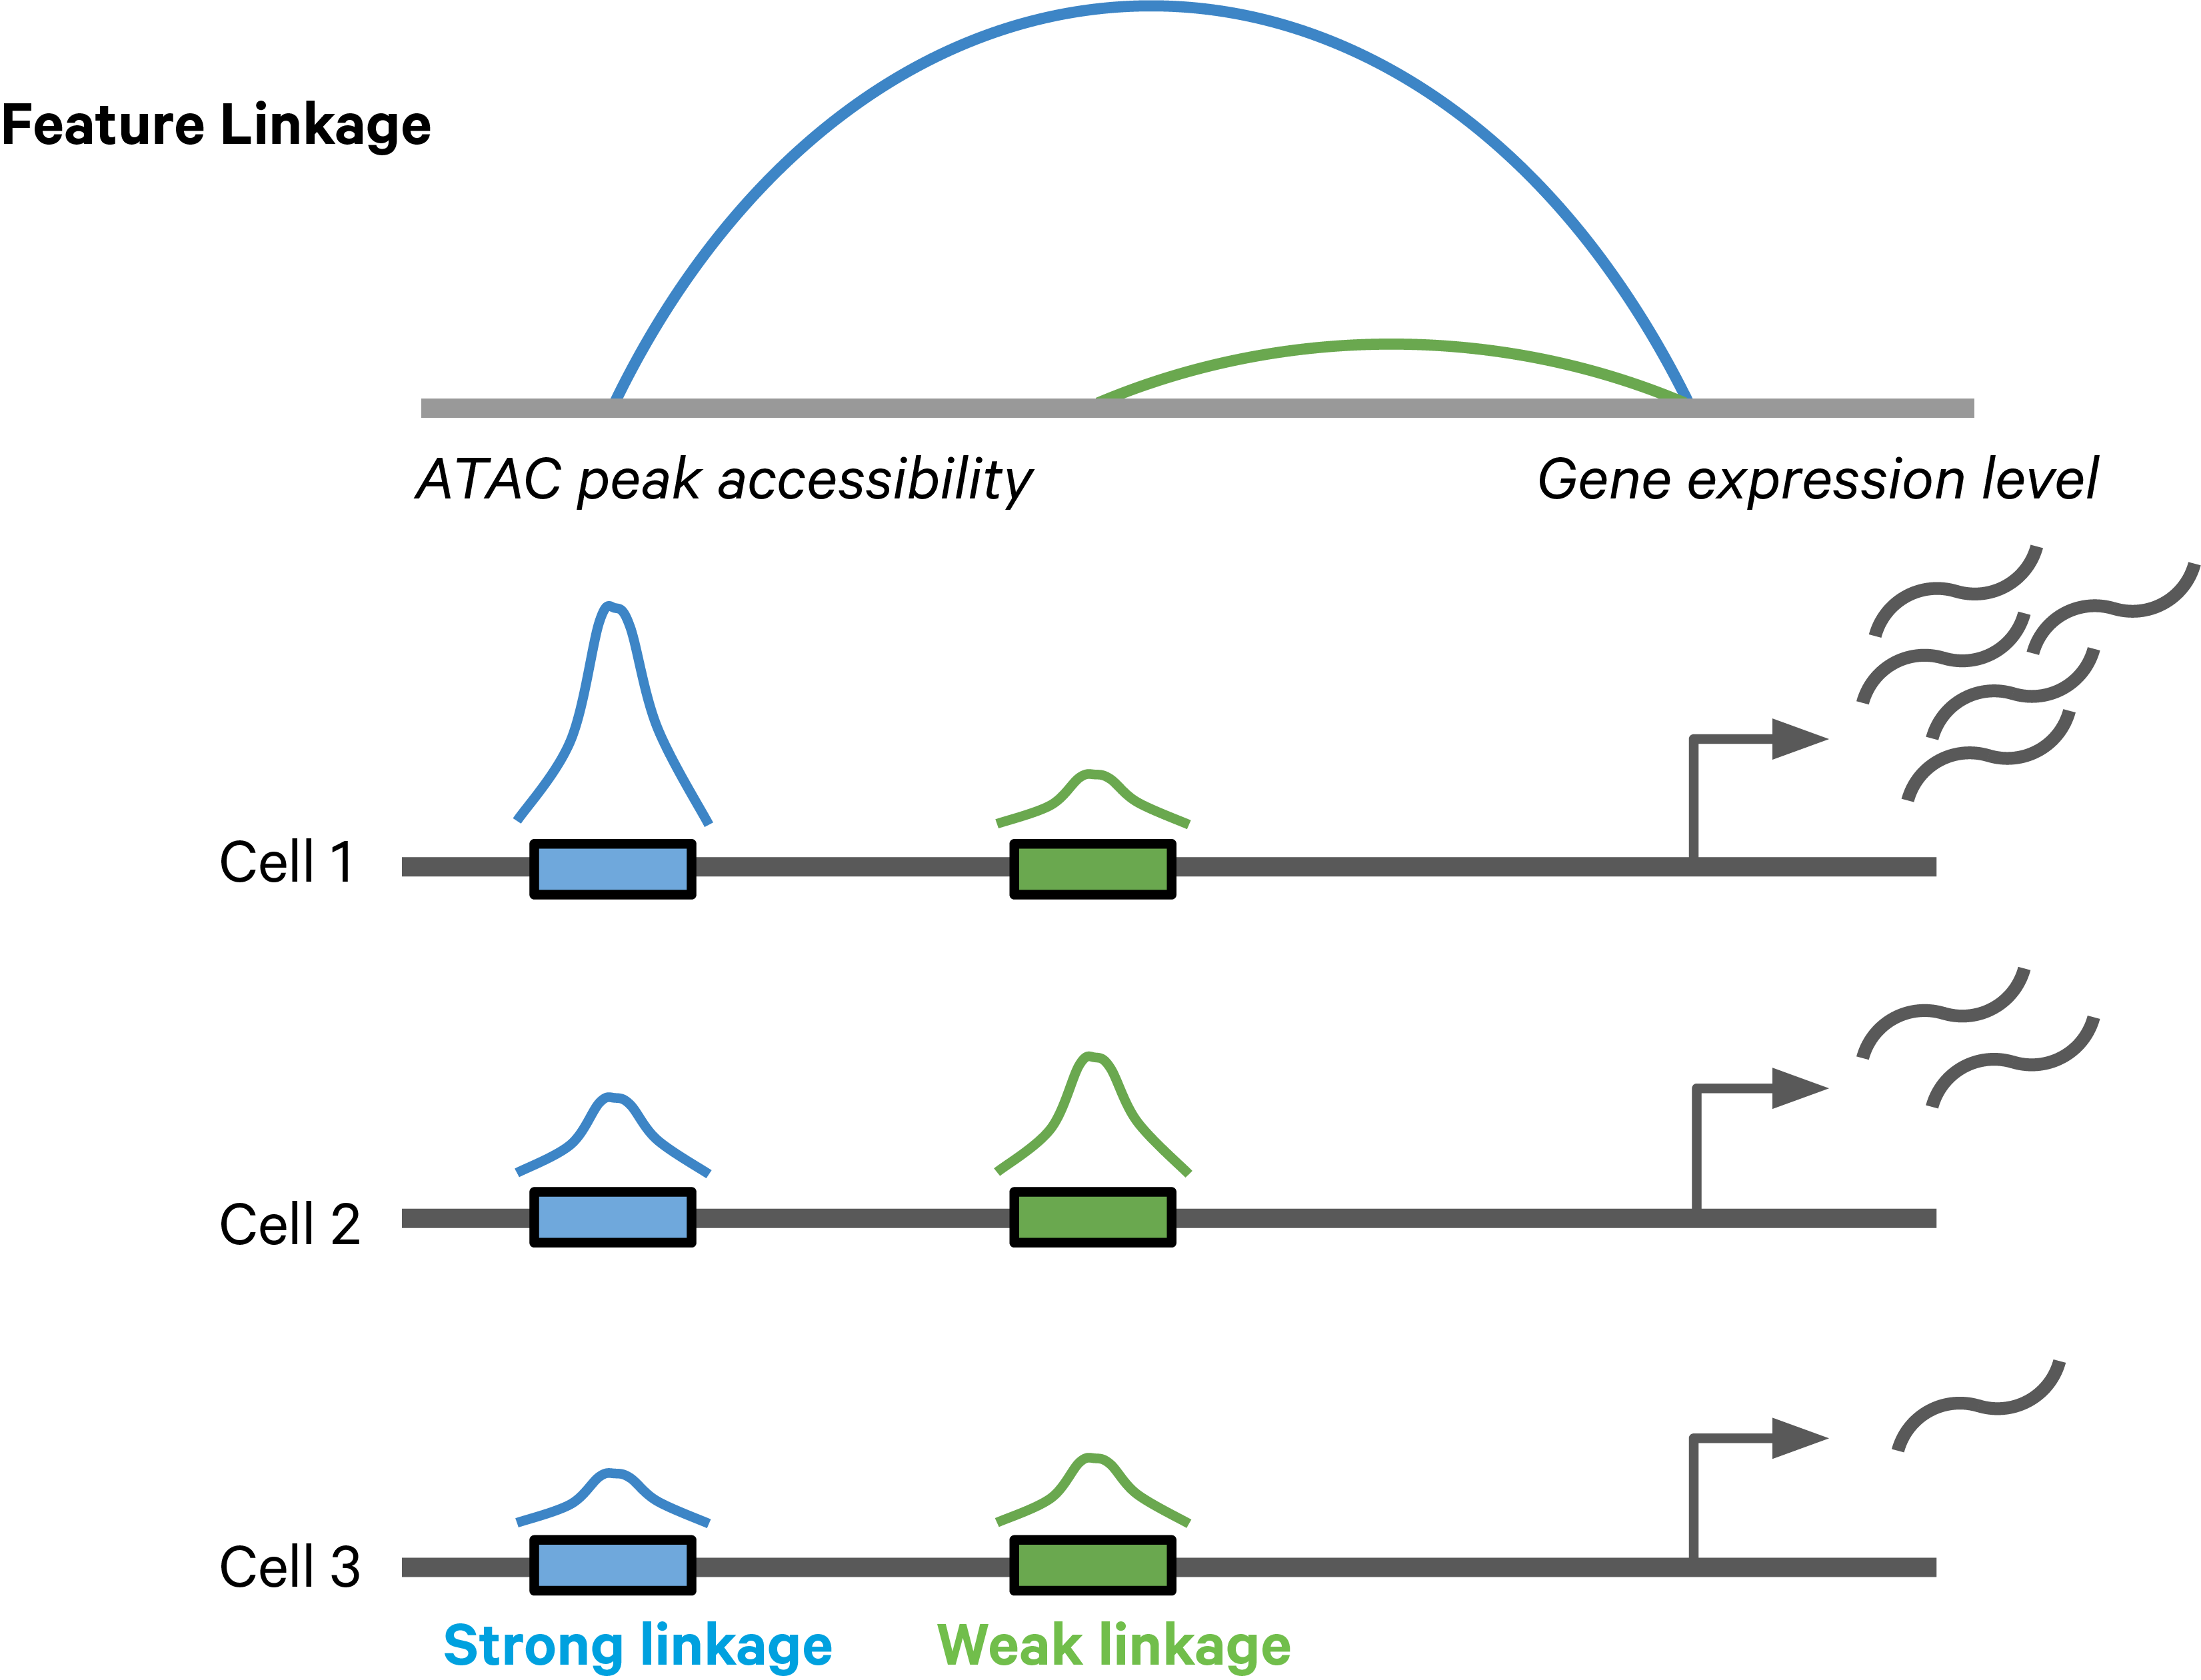
Figure 1. A schematic example of a feature linkage. The arc height denotes the magnitude of linkage correlation. The accessibility of the blue peak is much more correlated with the gene expression level than the green peak, hence the stronger feature linkage.
The computation of feature linkage consists of 2 steps (Figure 2)
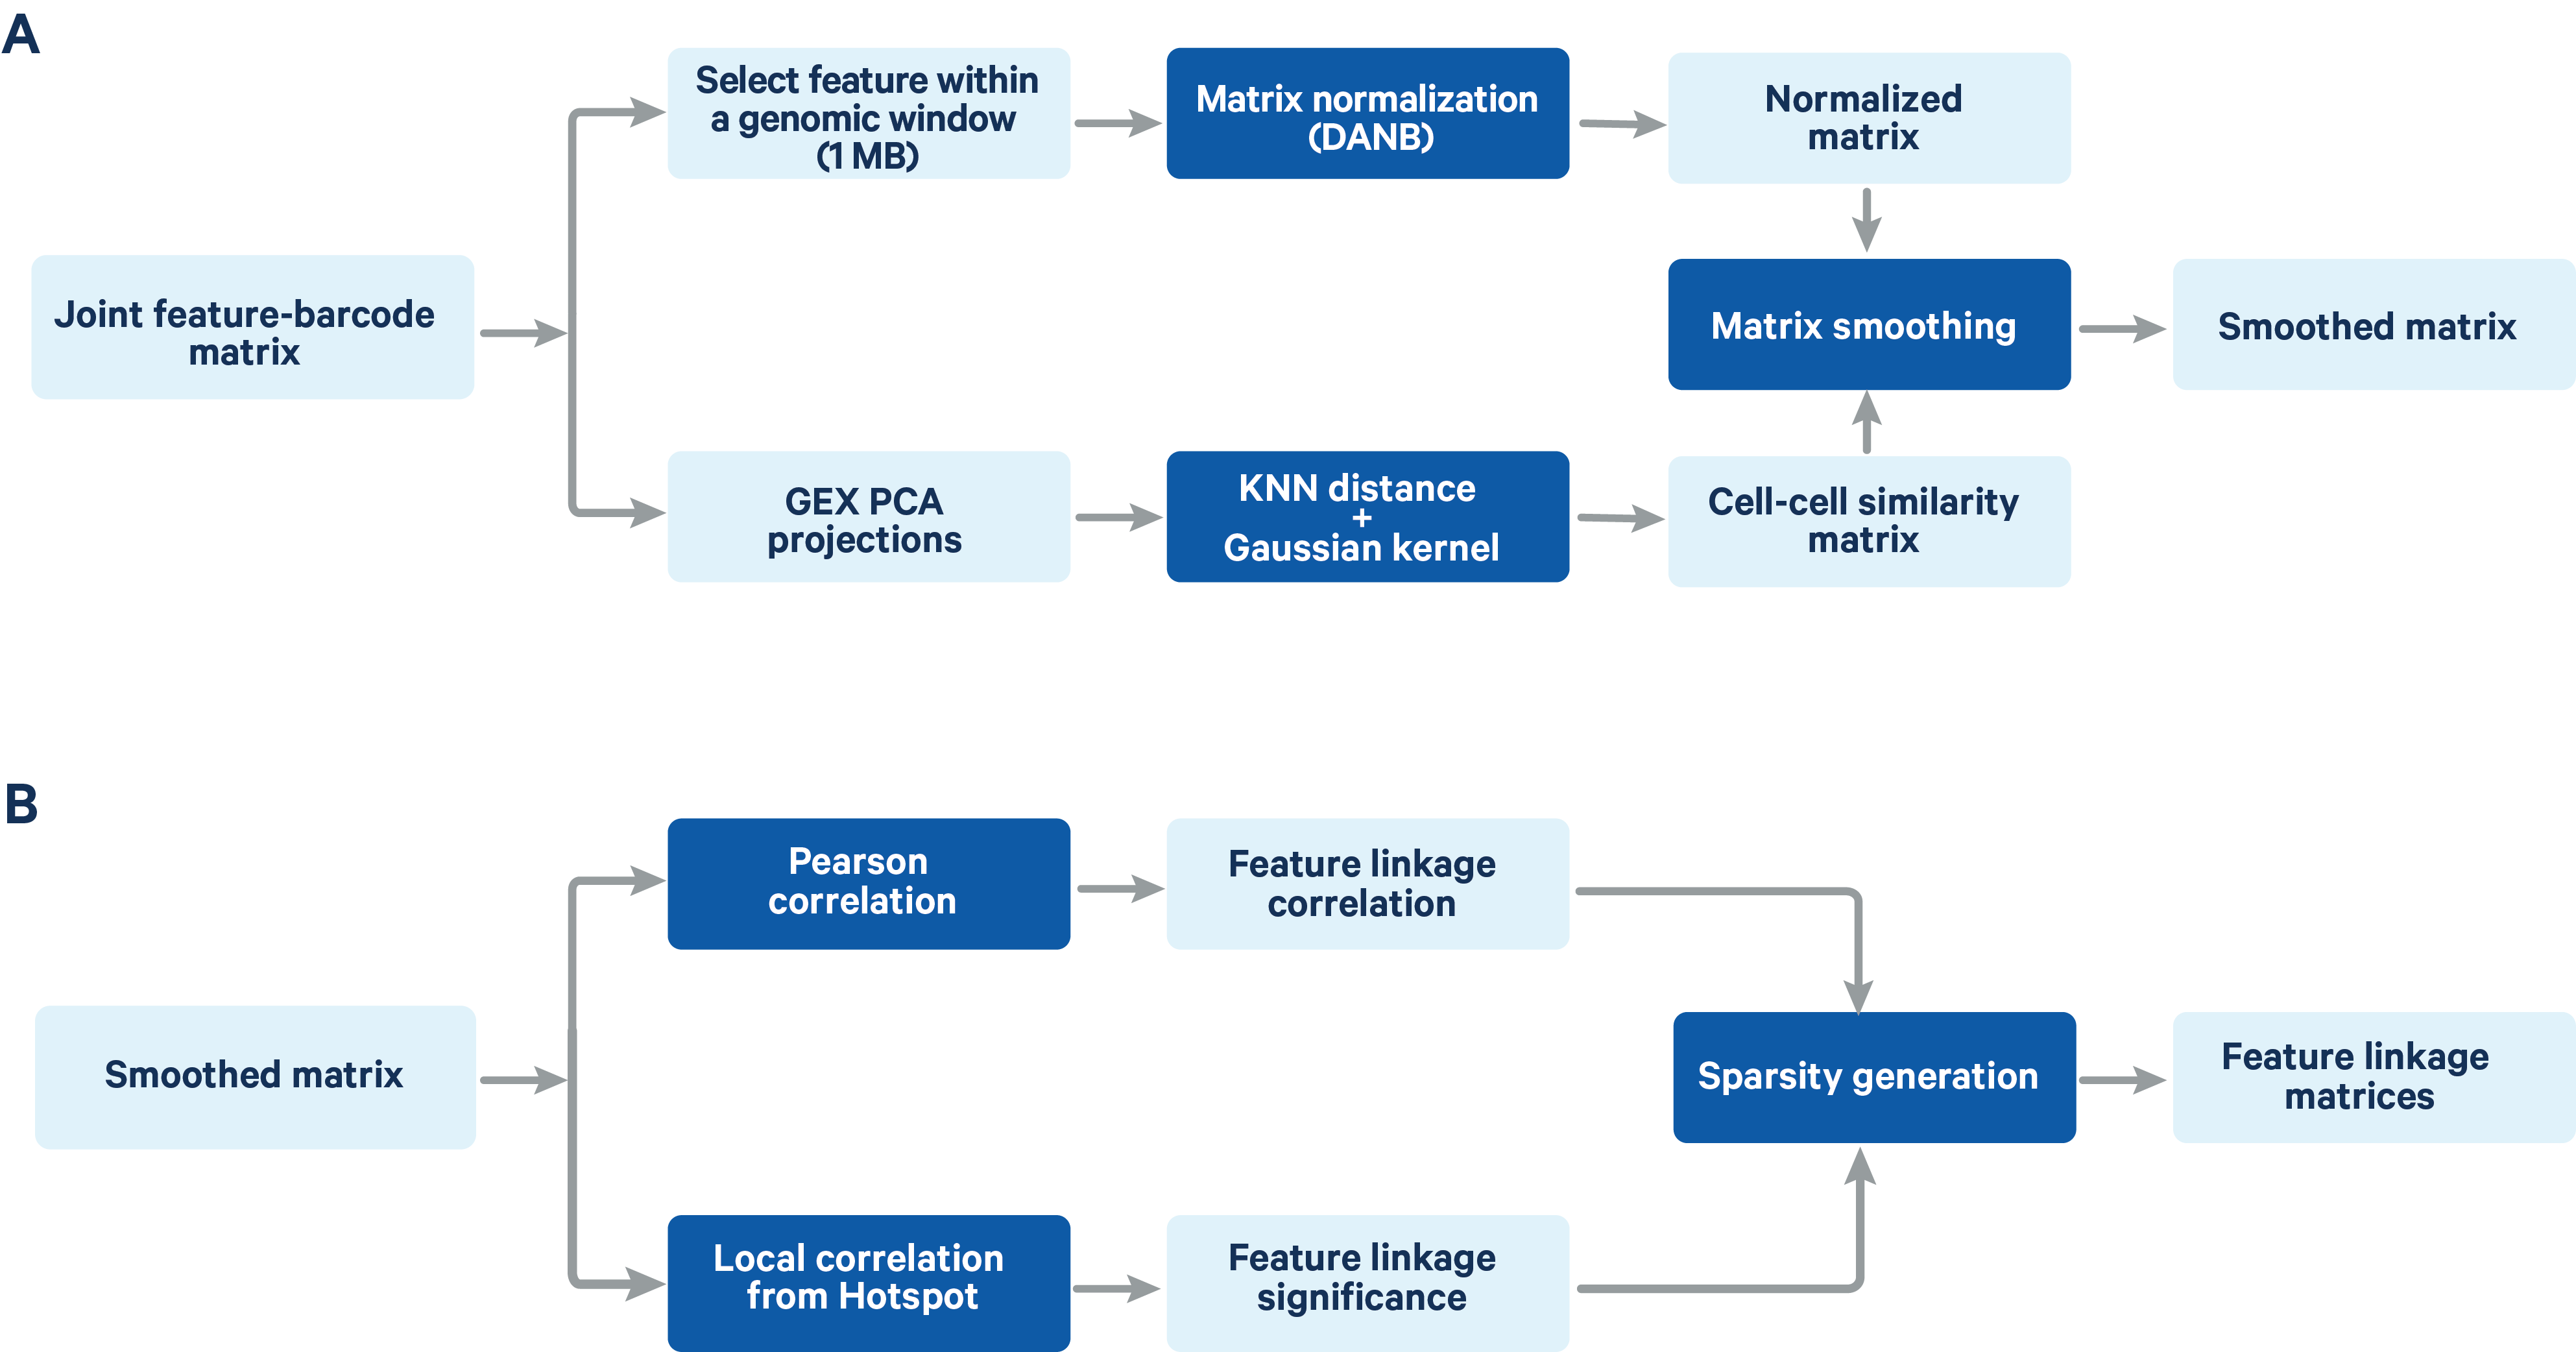 Figure 2. A schematic representation of the feature linkage algorithm Matrix normalization and smoothing (A) and computation of feature linkage matrices (B) is shown in the schematic.
The feature-barcode matrix is normalized using a method based on the depth-adaptive negative binomial normalization (DANB) that was originally proposed by Andrews et al. (Bioinformatics 2019). The ATAC peak-barcode matrix and GEX gene-barcode matrix are normalized independently to accommodate the different signal and sparsity profile of the two data types. The DANB method which was originally proposed for single cell gene expression data has been modified at the dispersion estimation step to make it compatible with both gene expression and ATAC data. Instead of the method of moments estimation of the dispersion in the original DANB method, we computed the maximum likelihood estimator for the dispersion, which has a better fitting performance for ATAC peak features.
Due to the sparsity of single cell data, especially the cut site count in ATAC peaks, signals of a peak and a gene will likely not be detected at the same time in one cell when both are expected to have high expression levels. As a result, a direct computation of correlation or other measure of dependence on the raw counts between two features is unable to distinguish highly co-expressed features from noise (Figure 3).
To clarify with an example, GZMB is a known NK and CD8 T cell marker in PBMC and its expression is highly enriched in NK and CD8 cytotoxic T cells. As the GZMB promoter displays significant NK and CD8 T cell-specific accessibility, the GZMB promoter and the gene are expected to display strong feature linkage (Figure 3A-B). However, because of the sparsity in single cell data, more than 80% of the cells (3094 out of 3799) have zero count in both GZMB gene expression and GZMB promoter. Moreover, more than 40% (355 out of 877) of annotated CD8/NK cells have zeros in both features (Figure 3A). The correlation of raw single-cell counts between GZMB gene expression and promoter accessibility is 0.285, which is lower than what we would expect based on known biology.
To overcome this barrier, we perform matrix smoothing. The value of a feature in a given cell is enhanced by “borrowing” values of the same feature from “neighboring” cells. Here, neighboring cells describe a population of cells whose GEX or ATAC profiles have high similarity, which is determined by applying K-nearest neighbor (KNN) algorithm on the gene expression PCA reduced dimensions. The information “borrowing” is achieved by a weighted sum of signals from 30 closest neighboring cells. The process of the information “borrowing” is called smoothing. After smoothing, putative co-expressed features show a much stronger correlation pattern compared to randomly selected pairs of features. In the GZMB example, the correlation of the smoothed values of gene expression and promoter accessibility is 0.87, with a clear visual pattern of correlation. The promoter of KHNYN, a nearby gene, does not have NK or CD8 T cell-specific differential accessibility. Instead, it has comparable accessibility in all major PBMC cell types. Hence, the linkage between KGNYN promoter and GZMB gene is weak, as evident from the low correlation value (Figure 3D).
The smoothing weight is defined as the Gaussian kernel transformation of the euclidean distance between two cells in PCA space. The Gaussian kernel transformation guarantees that the smoothing weight is high only when two cells have a highly similar gene expression profile and quickly decays to zero when the similarity between cells decreases. This is necessary to prevent over-smoothing in KNN-based methods (Andrews and Hemberg, F1000 Research 2019).
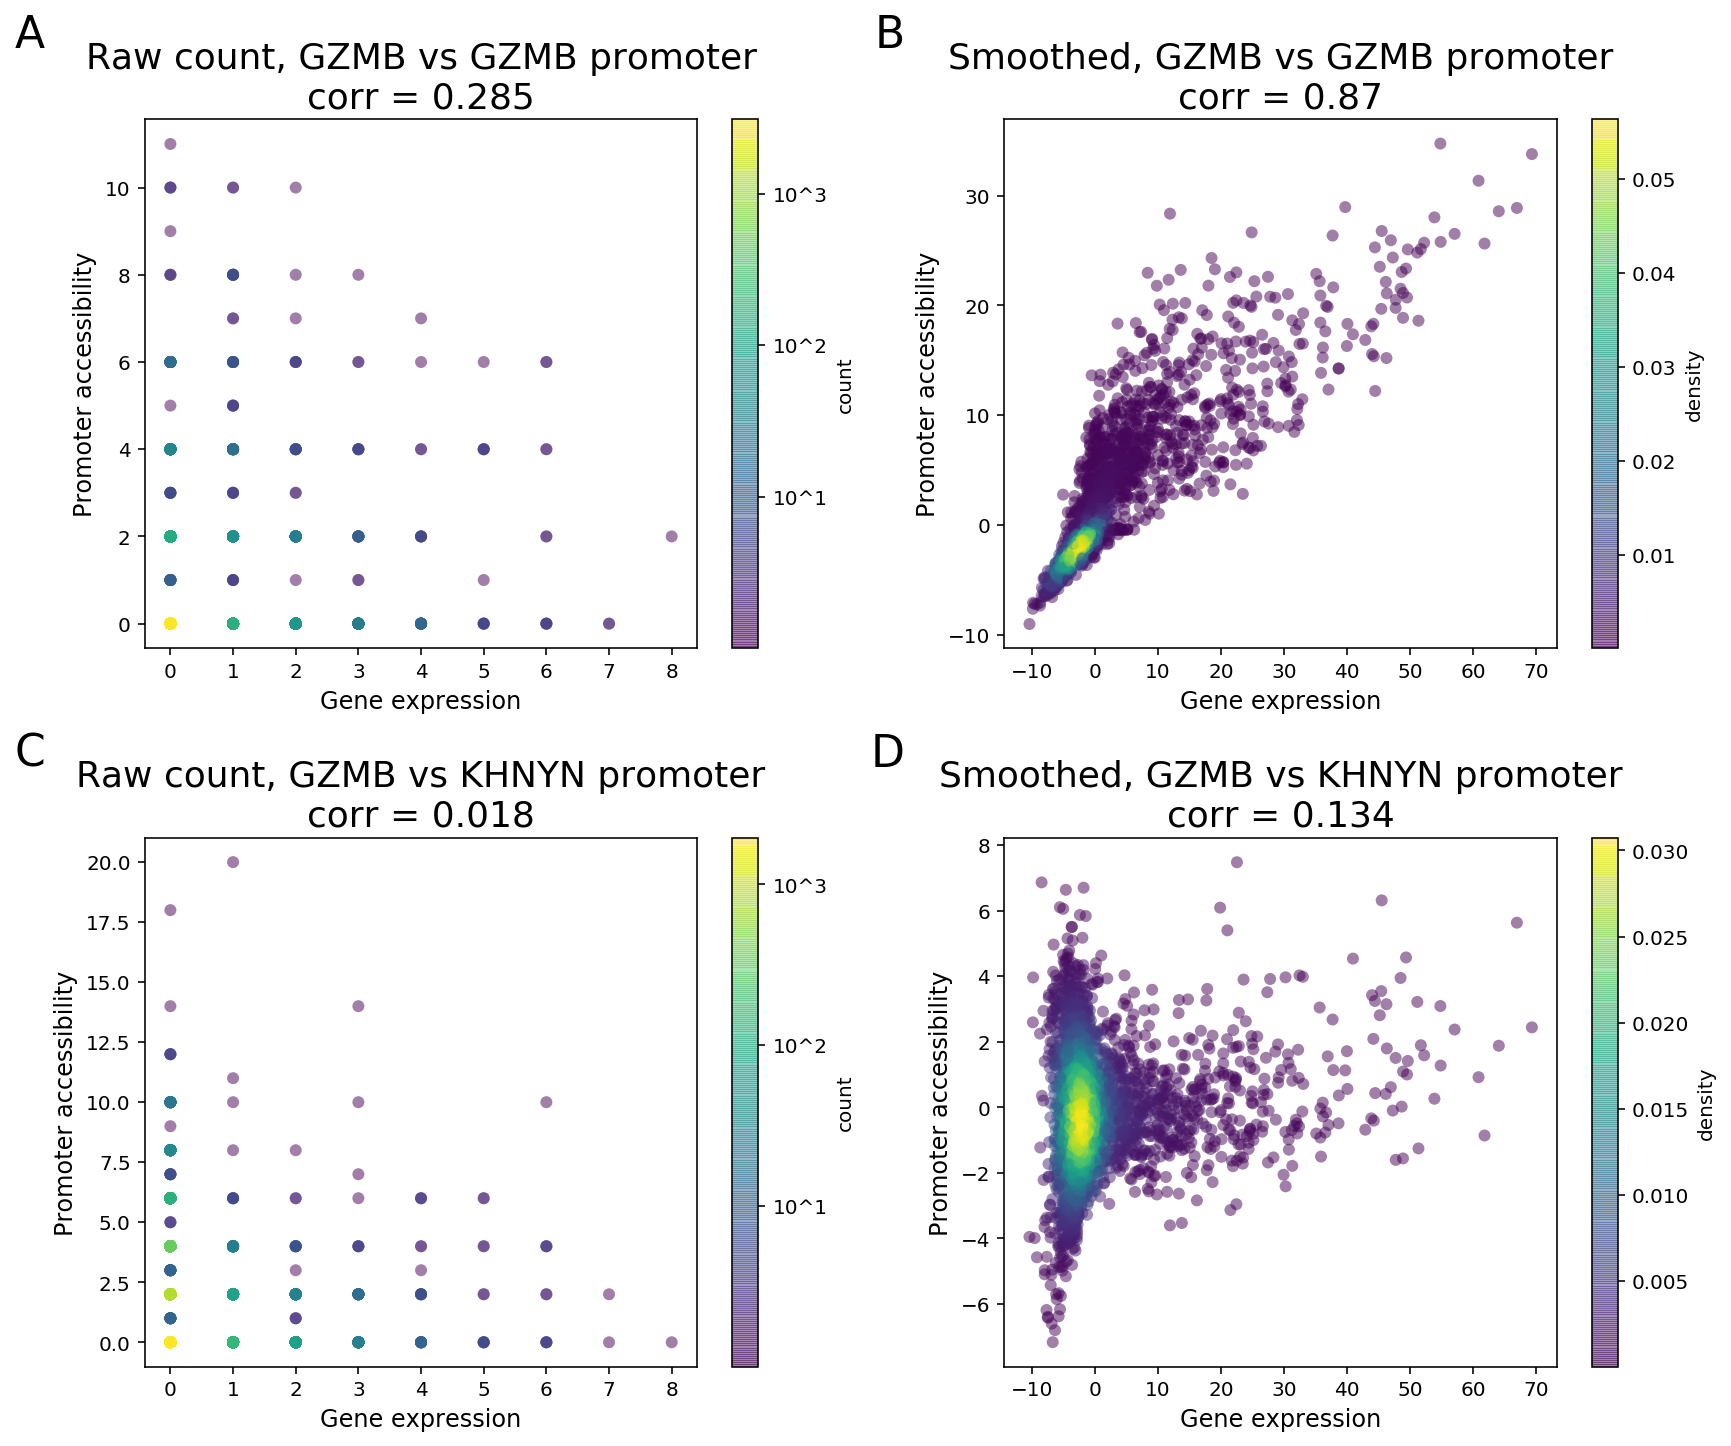 Figure 3. Matrix smoothing improves interpretability of the linkage correlation. Examples of strong feature linkage (A, B) and weak feature linkage (C, D) from a PBMC dataset with 3,799 cells. Raw counts are colored based on the number of barcodes that share the same raw counts (A, C). Note that more than 3,000 cells have raw counts of (0, 0). Smoothed values are colored as the density in the 2-D scatter plot (C, D).
Feature linkage correlation is determined by computing the Pearson correlation coefficient between two features after smoothing. Linkage correlation is a direct and interpretable measure of the linkage strength, and ranges from -1 to 1 (Figure 4). The sign of the correlation indicates a positive or negative association.
Feature linkage significance provides a measure of statistical uncertainty for feature linkage inference and offers another way to contrast strong linkages relative to weak linkages. A modified version of the Hotspot algorithm (DeTomaso et al. 2020) is applied to compute “local correlation” for a feature linkage and the value is transformed to a Gaussian random variable to enable hypothesis testing.
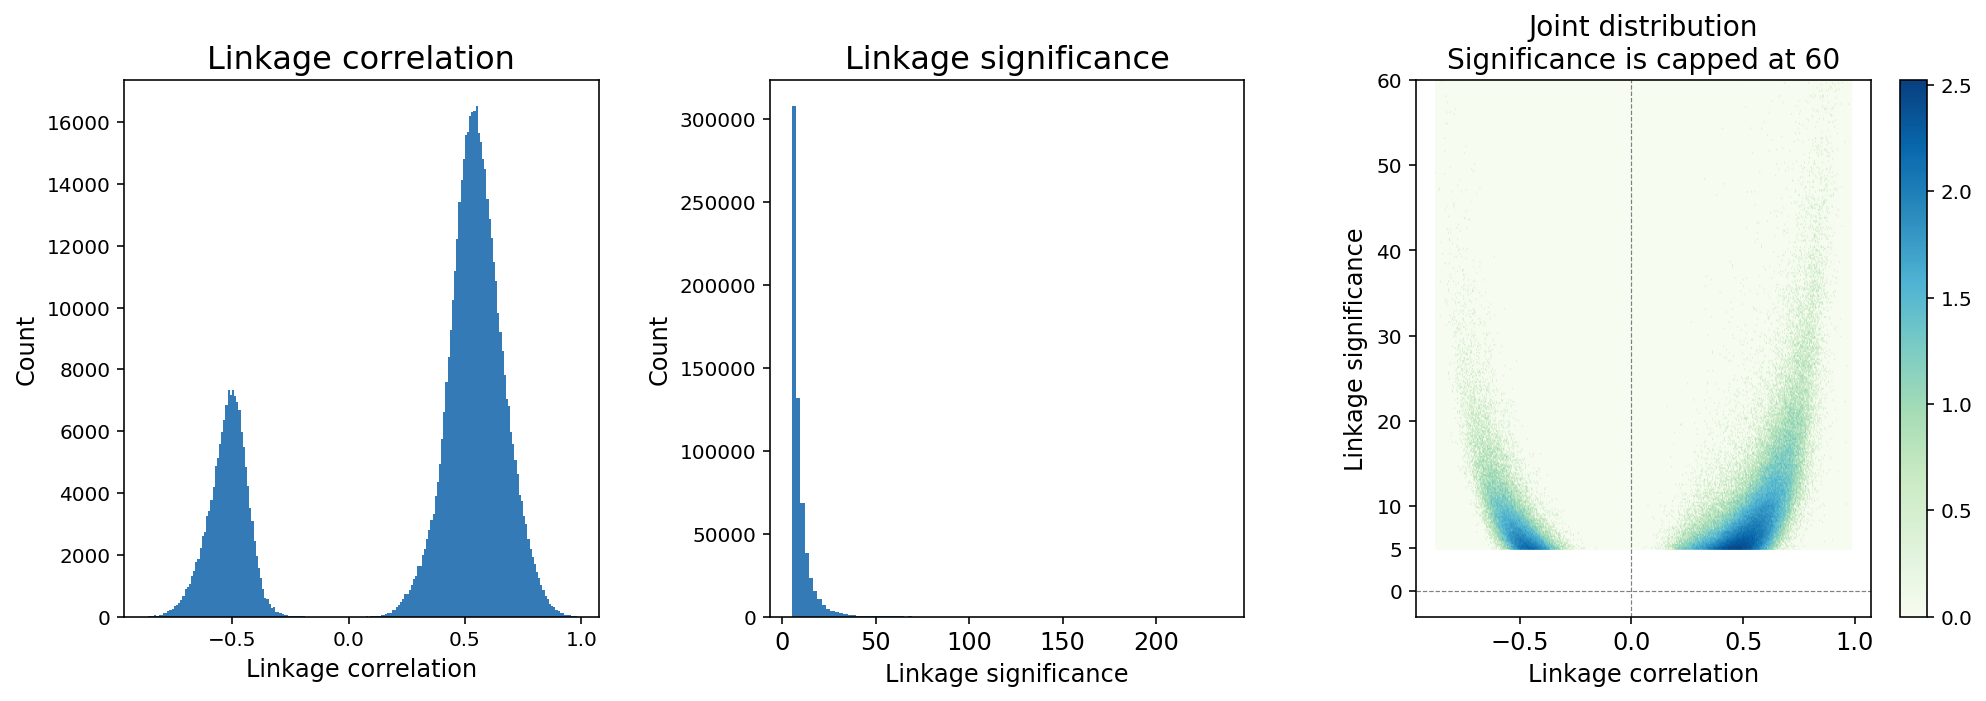 Figure 4. A typical distribution of feature linkage correlation and significance.
Because the number of computable linkages increases quadratically with the number of features, it is expected that the majority of computable linkages are not biologically significant, and sparsity in the inference of feature linkage is expected. We applied a thresholding method in which linkages with significance < 5 are removed from the linkage matrix (Figure 4). The threshold is determined based on an analysis of continuously down-sampling reads and comparing the decay of linkage significance and correlation. A significance threshold of 5 strikes a good balance between retaining linkages with lower correlation scores and stability against downsampling.
Feature linkages describe associations between genomic features. The biological, causal relationship between interactive enhancers or between enhancers and their targeting gene expressions are dependencies generating such associations. Several alternative molecular assays exist that examine these dependencies. For example, H3K27Ac ChIP-seq measures active enhancers, Hi-C measures chromosome conformation, and CRISPR-based enhancer screen tests whether an enhancer is required for target gene expression. Such alternative assays, individually or in combination, characterize enhancers and generate feature linkage candidates with different throughput and different levels of fidelity to the biological, causal interactions. However, when restricting the data source to transcriptome and chromatin accessibility profiling, the feature linkages we infer are candidates that are enriched for causal relationships but do not directly imply causality.
Andrews, T. S., & Hemberg, M. False signals induced by single-cell imputation. F1000Research, 7, 1–36 (2019).
Andrews, T. S., & Hemberg, M. M3Drop: dropout-based feature selection for scRNASeq. Bioinformatics, 35(16), 2865–2867 (2019).
DeTomaso, D., & Yosef, N. Identifying Informative Gene Modules Across Modalities of Single Cell Genomics. BioRxiv, 2020.02.06.937805 (2020).