Cell Ranger DNA1.1, printed on 03/31/2025
| Analysis software for the 10x Genomics single cell DNA product is no longer supported. Raw data processing pipelines and visualization tools are available for download and can be used for analyzing legacy data from 10x Genomics kits in accordance with our end user licensing agreement without support. |
Using everything you have learned about this visualization tool, you can now analyze the MKN-45 cell line. First, reset Loupe scDNA Browser back to its initial state by clicking on the Help button in the menu, then clicking on Load Tutorial Dataset.
First, discover where the MKN-45 cells are in the tree. MKN-45 is characterized by large deletions and a high copy number event in chromosome 7. To check for the large deletions, filter the heatmap for where the copy number is 1 by clicking 1 in the heatmap legend and then clicking Show Only Copy Number 1. A closer examination reveals the bottommost node (group 919) is enriched for MKN-45 cells.
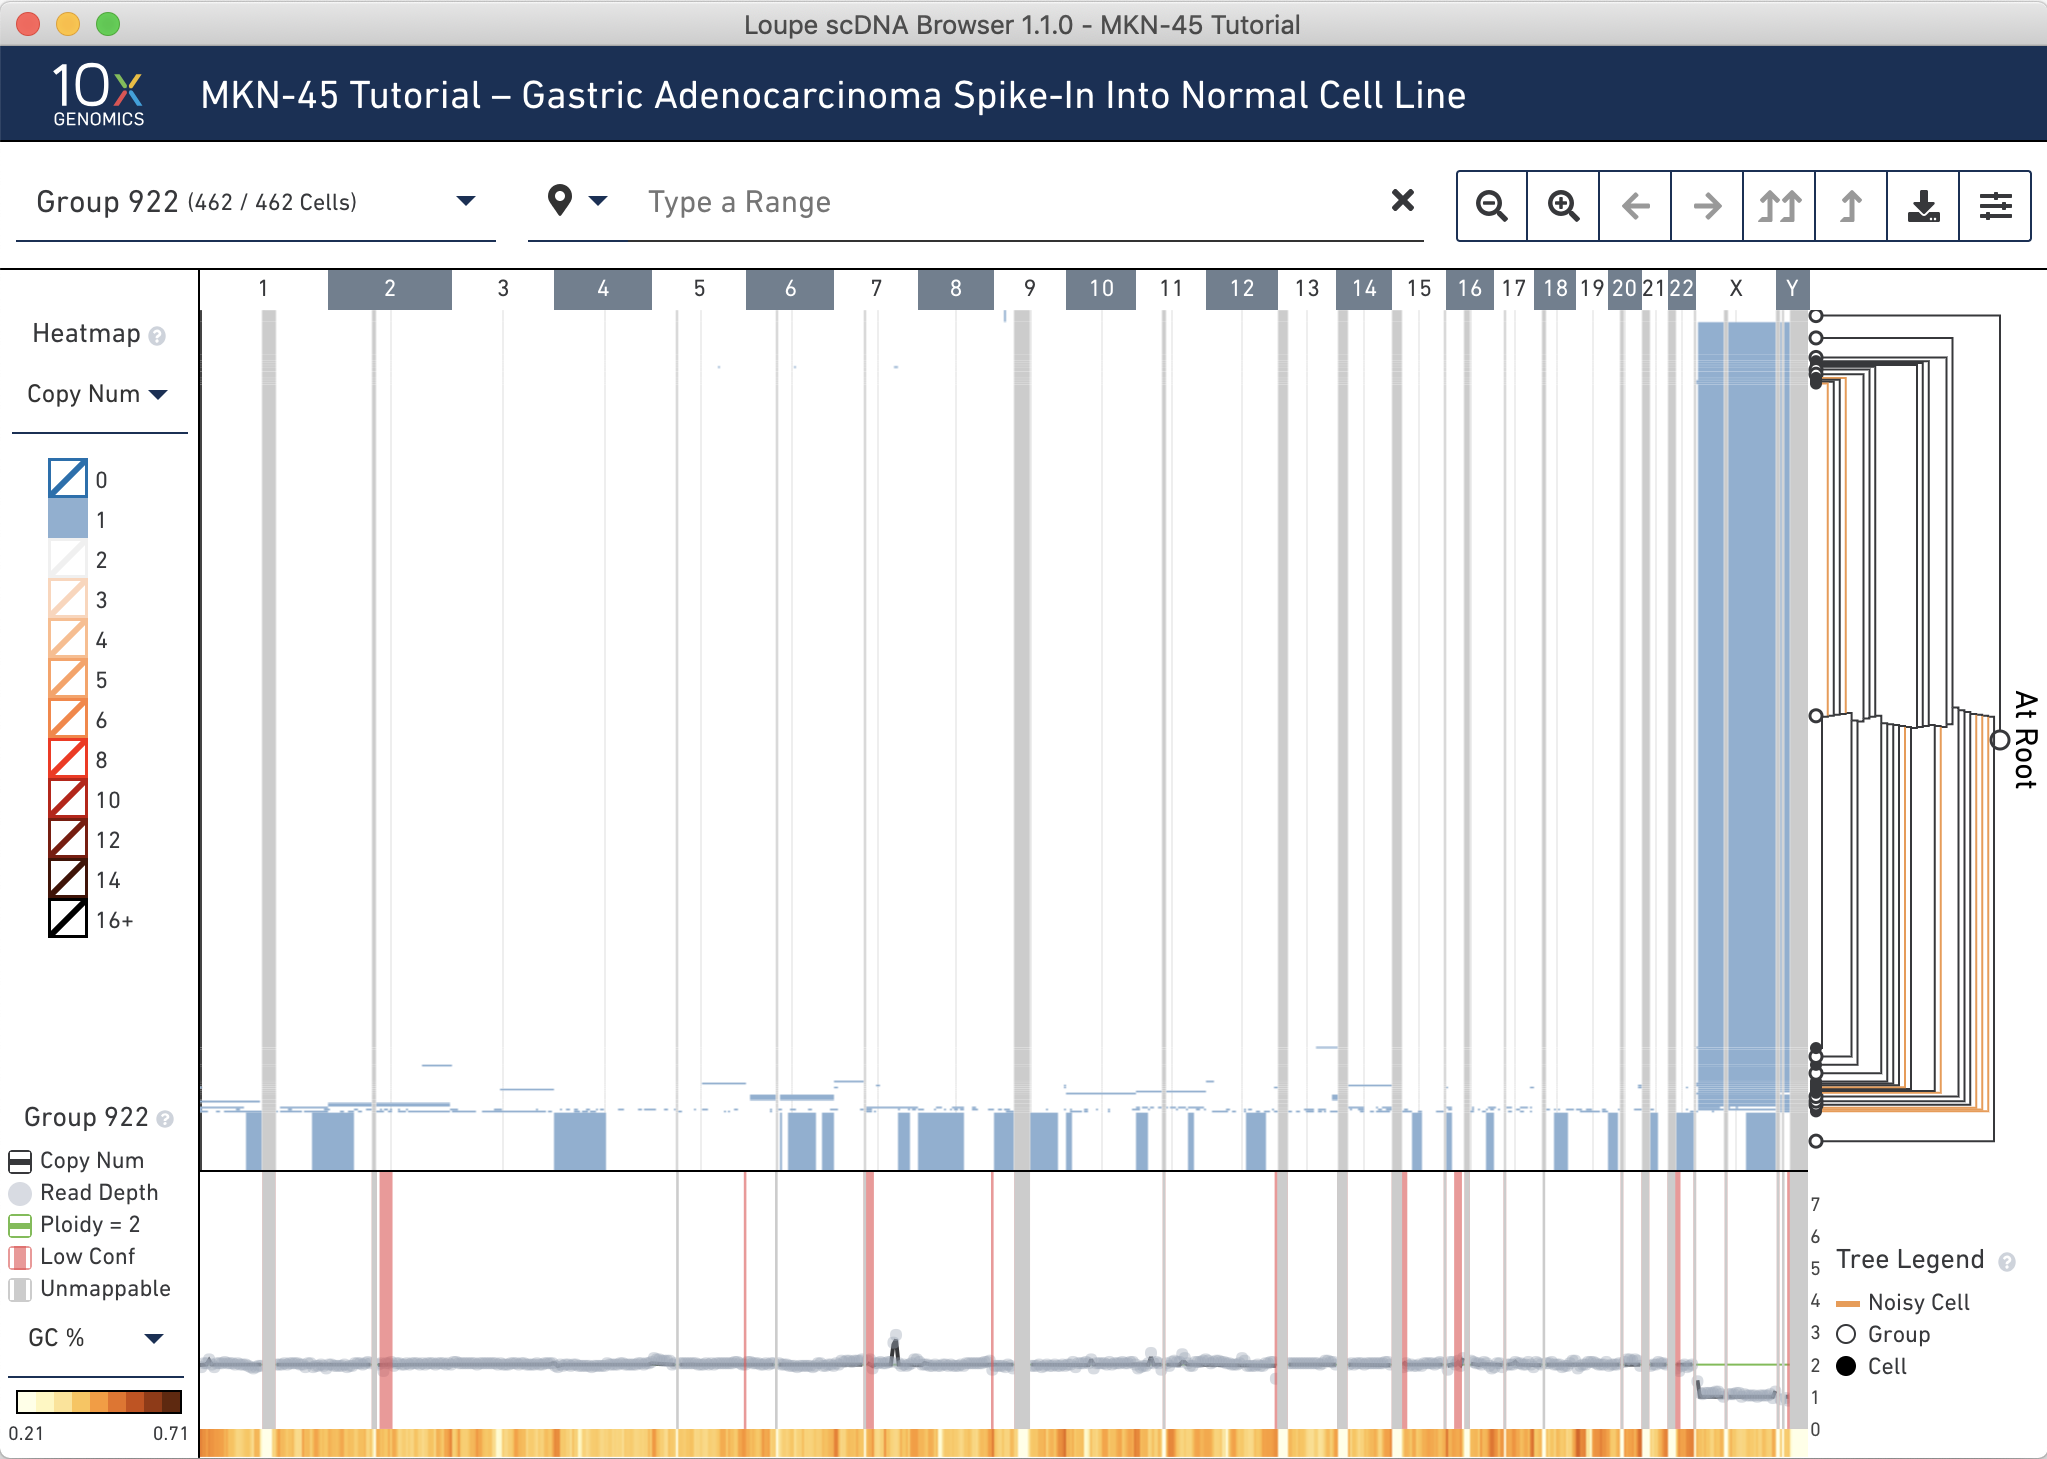
Reset the heatmap coloring by clicking anywhere on the colorscale and selecting Show All Copy Numbers.
To check for the copy number events, notice the narrow, dark vertical band at chromosome 7 in groups 919 and 920. Click and drag to zoom into this region to inspect it more closely. Hovering over these bins display the copy number. Many of these bins have copy number greater than 16 and are colored black.
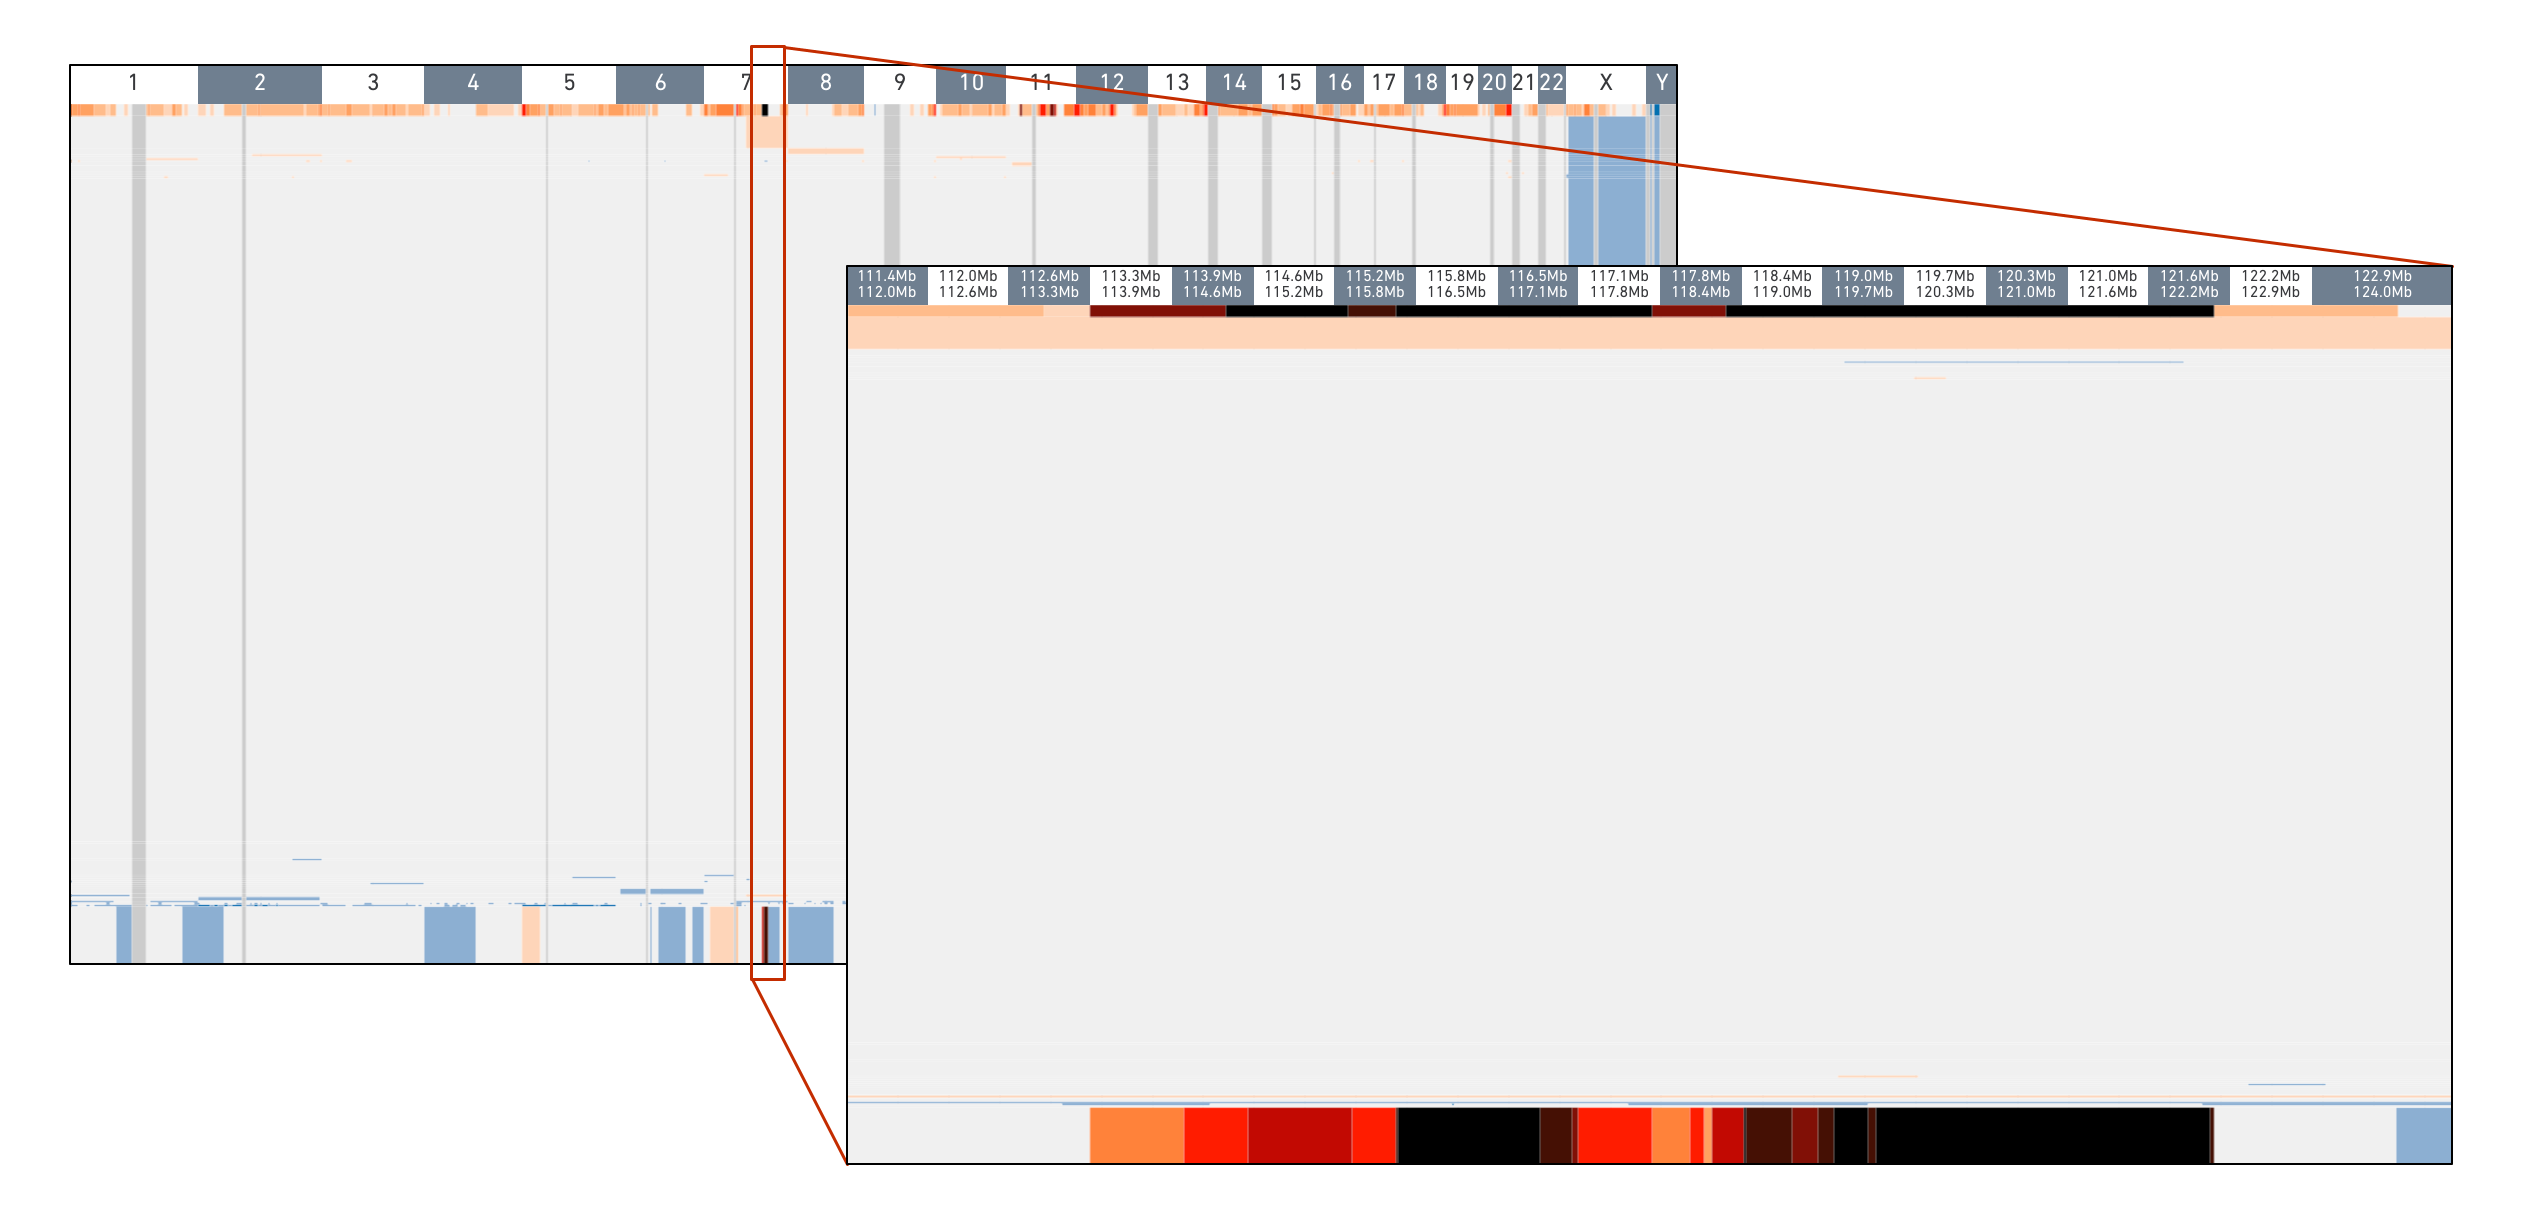
Both these analyses indicate that these groups contain similar cells -- the MKN-45 spike-in cells.
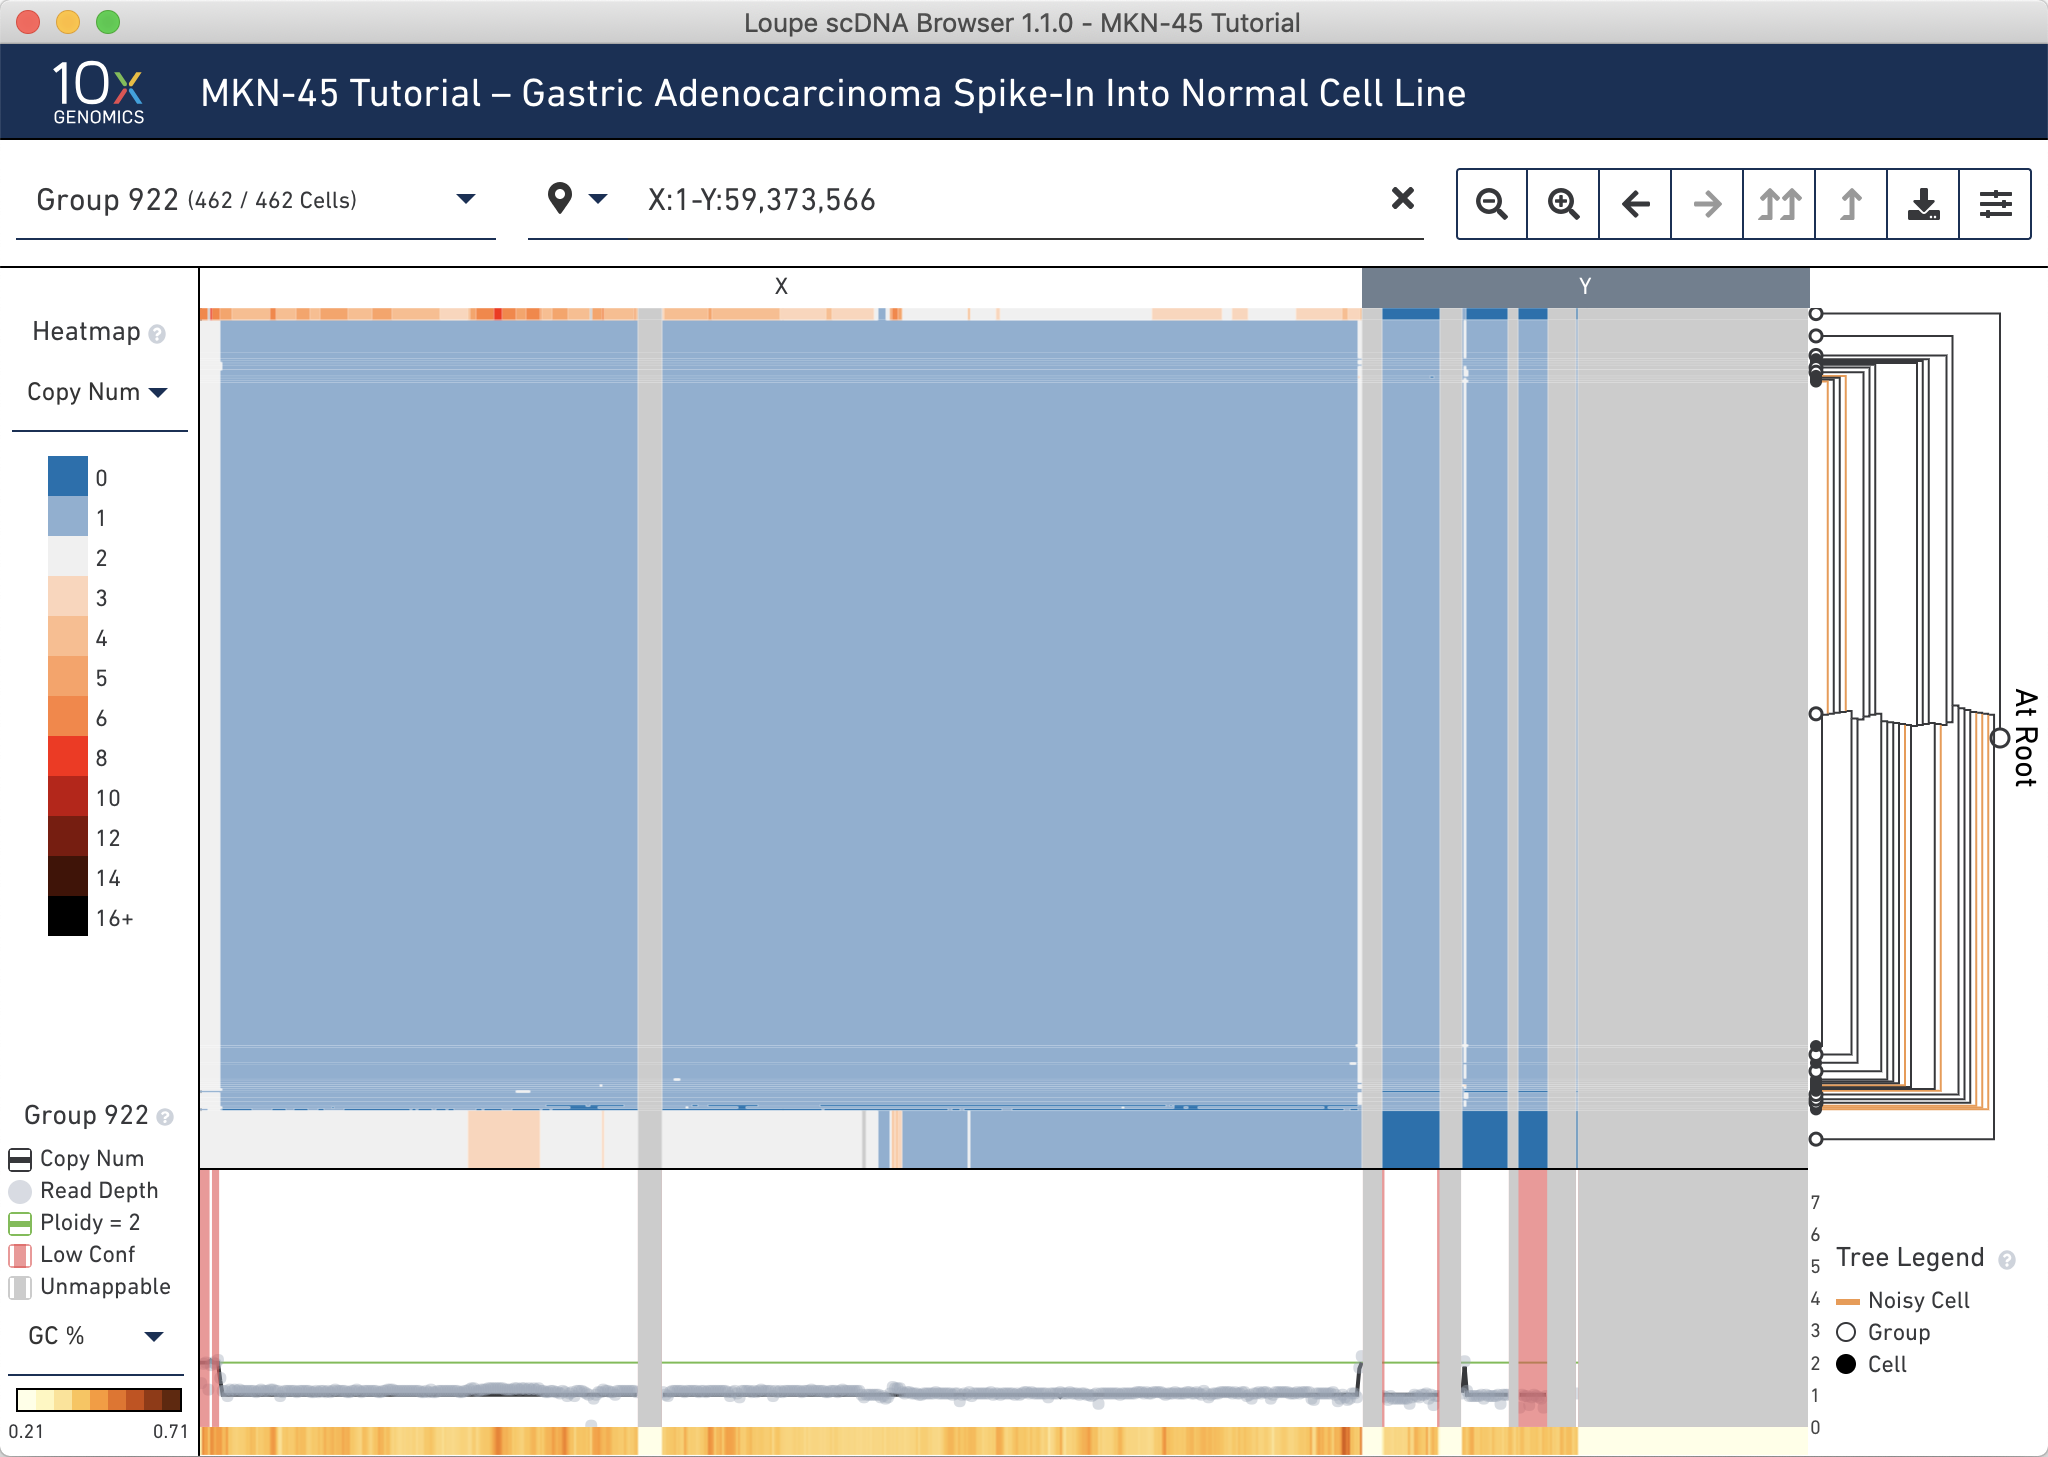
We can validate this another way. Since MKN-45 are female cells and BJ are male, these two cell lines can be differentiated by looking at the copy number of the sex chromosomes. Type the range X:1-Y:59,373,566 into the genomic range selector and press Enter. You can see that the presumed MKN-45 cells in Group 919 and Group 920 have no reads mapping to the Y chromosome, while the majority of other cells have one X and one Y.
Finally, verify that the spiked-in MKN-45 cells appear at about the expected ratio. Reset the view by clicking on the x to the right of the genomic range selector.
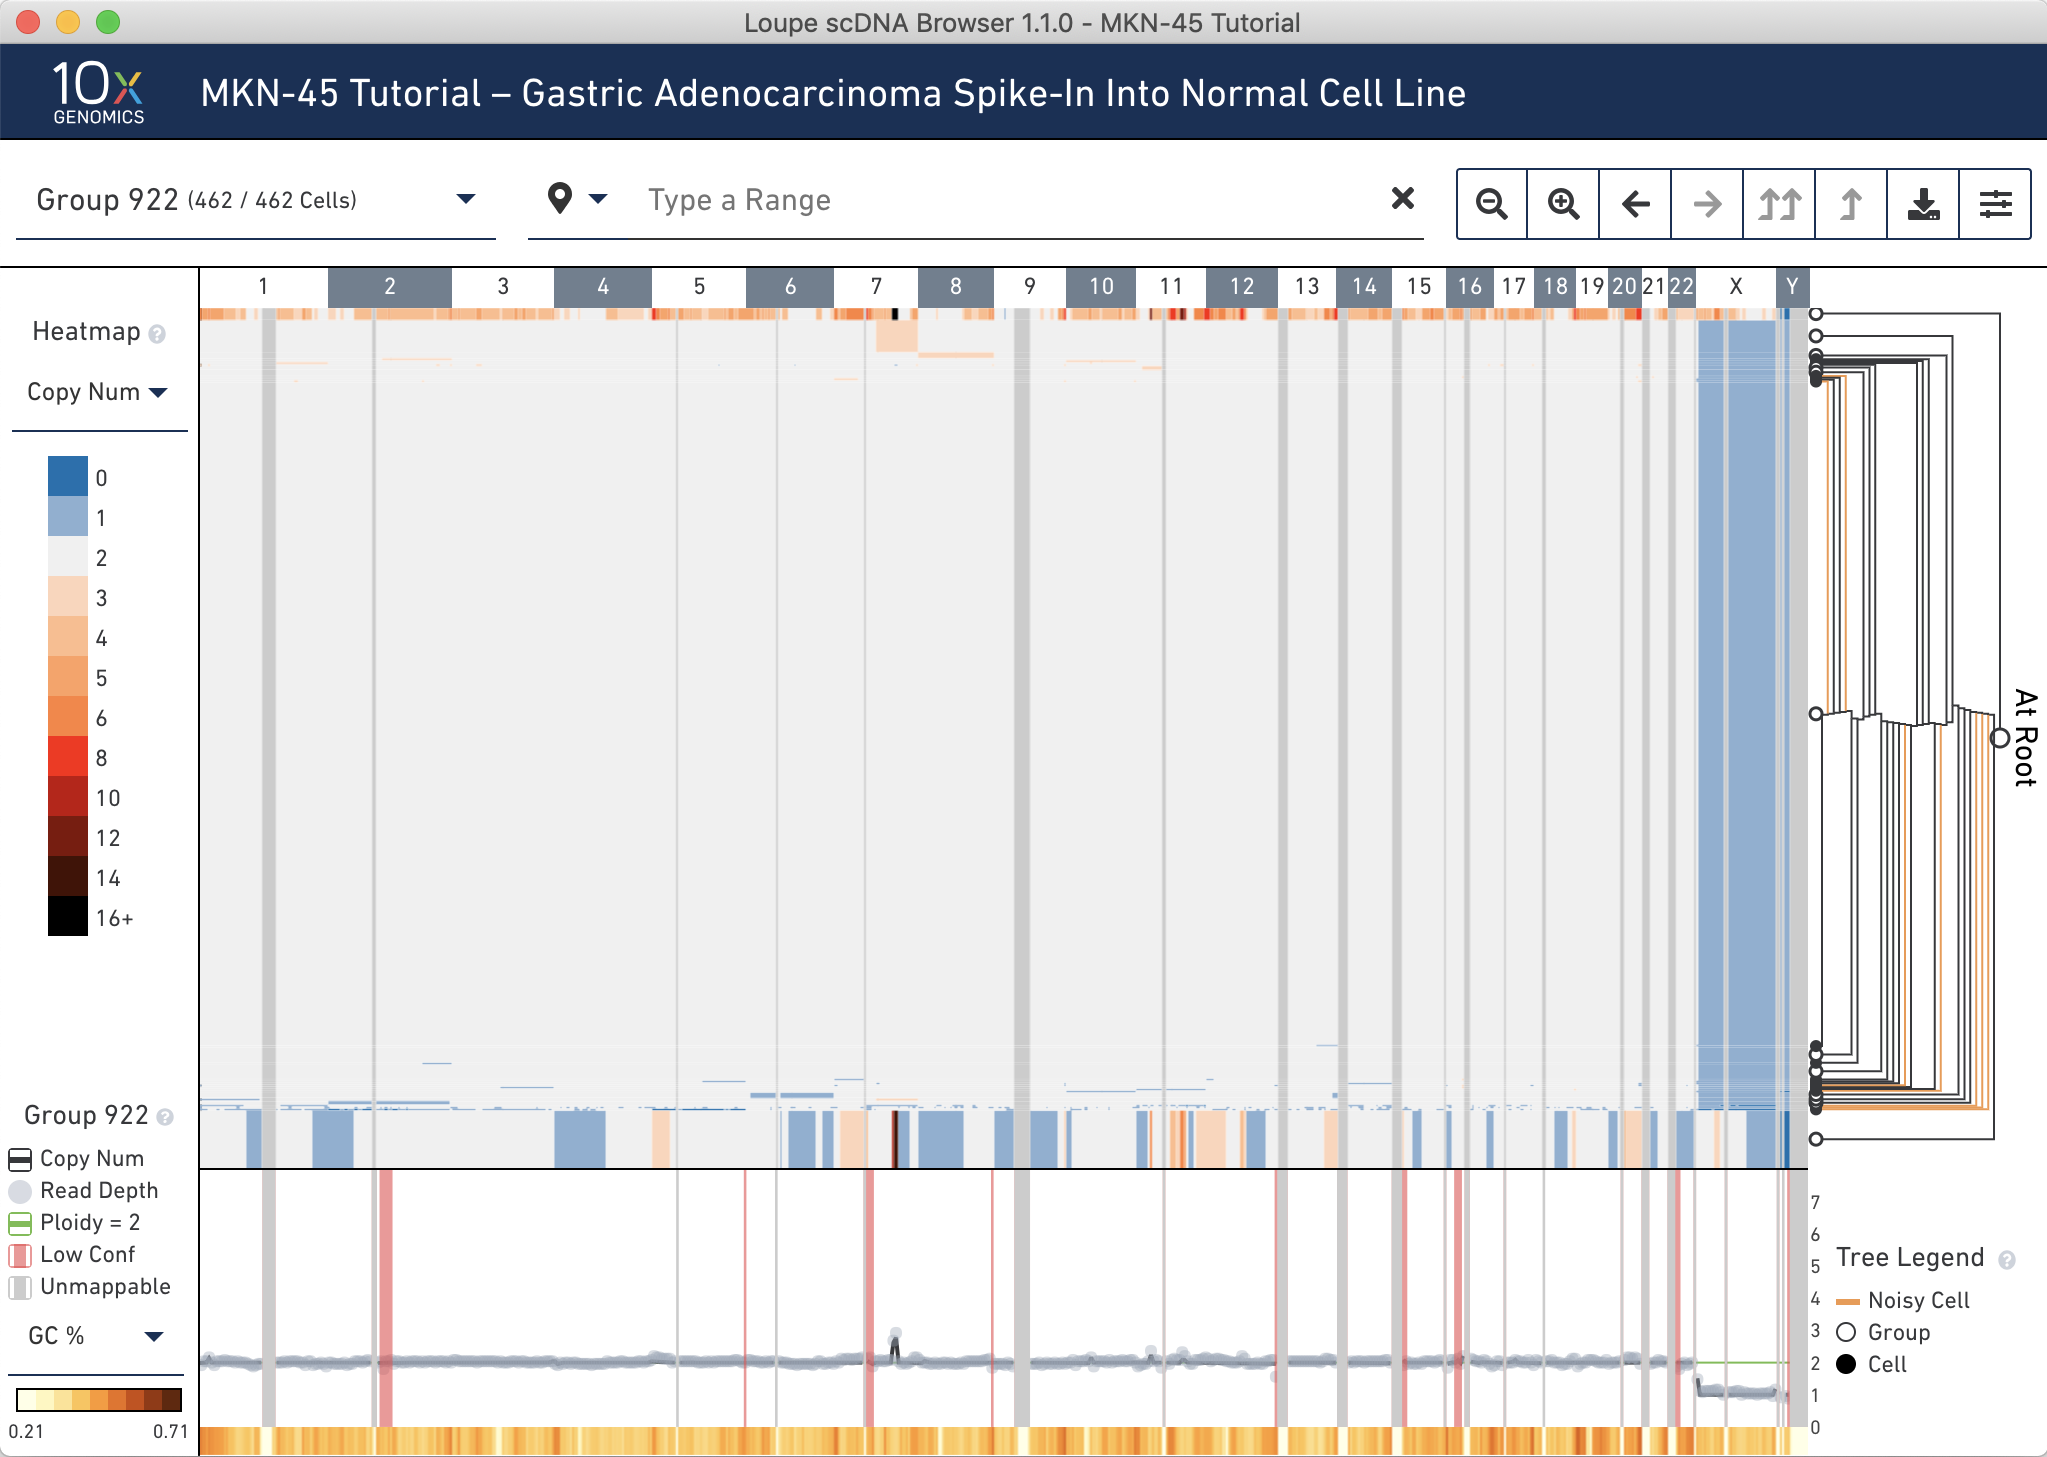
The observed ratio–the sum of Group 919 and 920, is 37/462 cells, or 8.0%.
Now that the two MKN-45 groups have been identified, let's find the MKN-45 cells with non-noisy profiles.
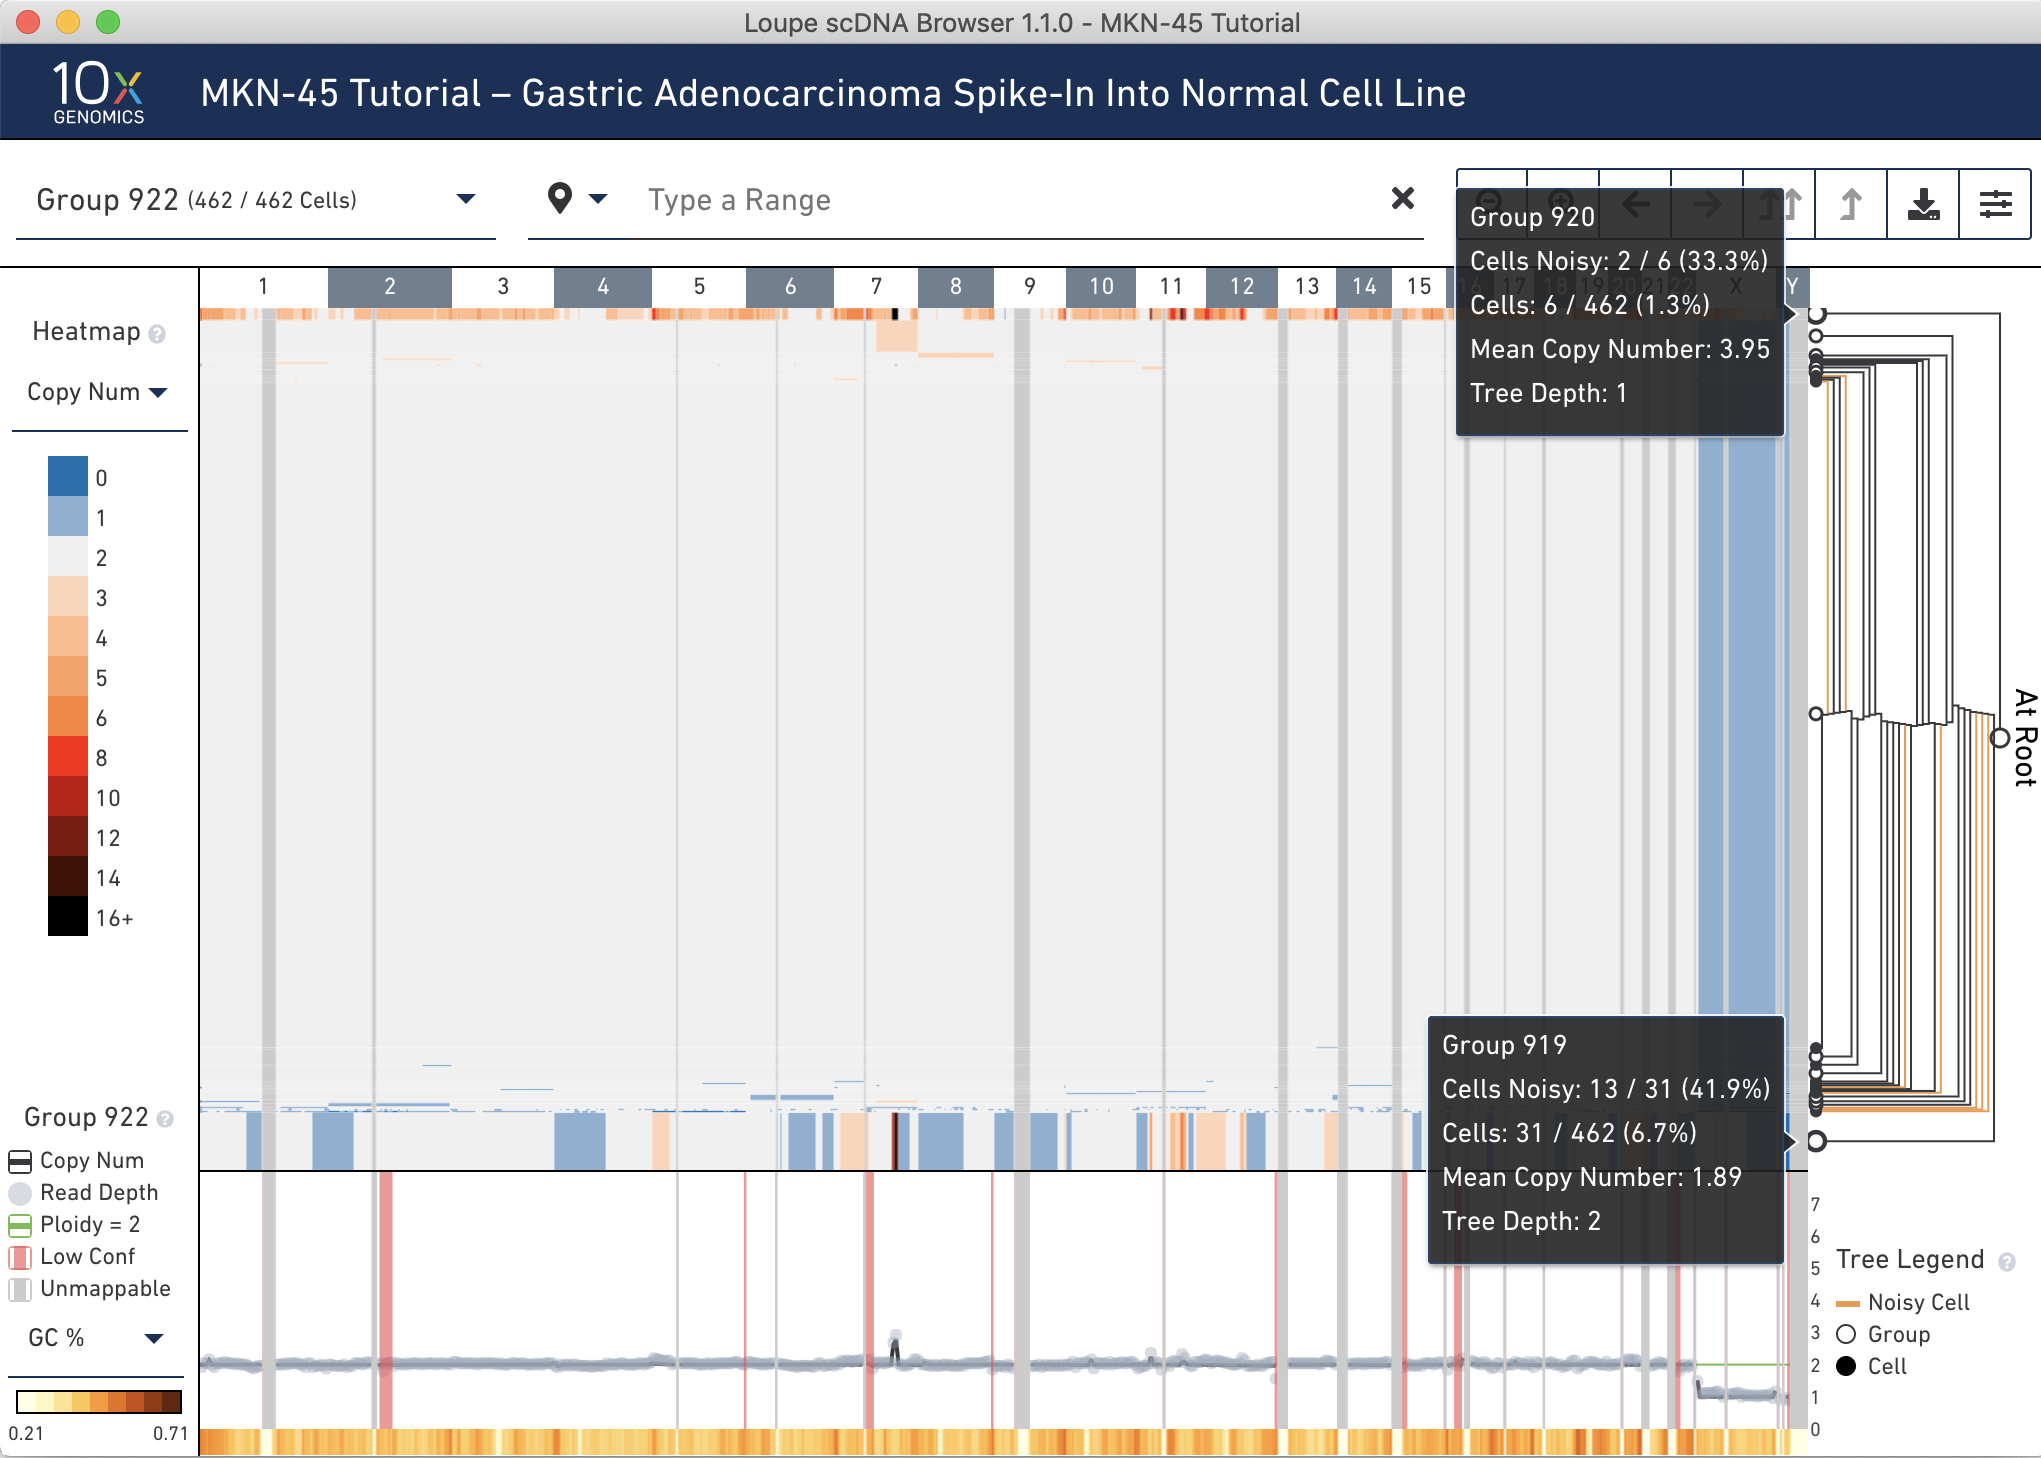
Hover over the Group 919 and 920 nodes in the tree to discover the number of noisy cells within each node. Hovering over the nodes shows that 33% of cells in Group 920 are marked noisy, while only 6.7% of cells in Group 919 are marked noisy. Also observe the difference in mean copy number between the two groups. It is likely that Group 920 is comprised of replicating MKN-45 cells. See the Cell Ranger DNA documentation for more information about replicating cells.
Next, click the to Group 919 node.
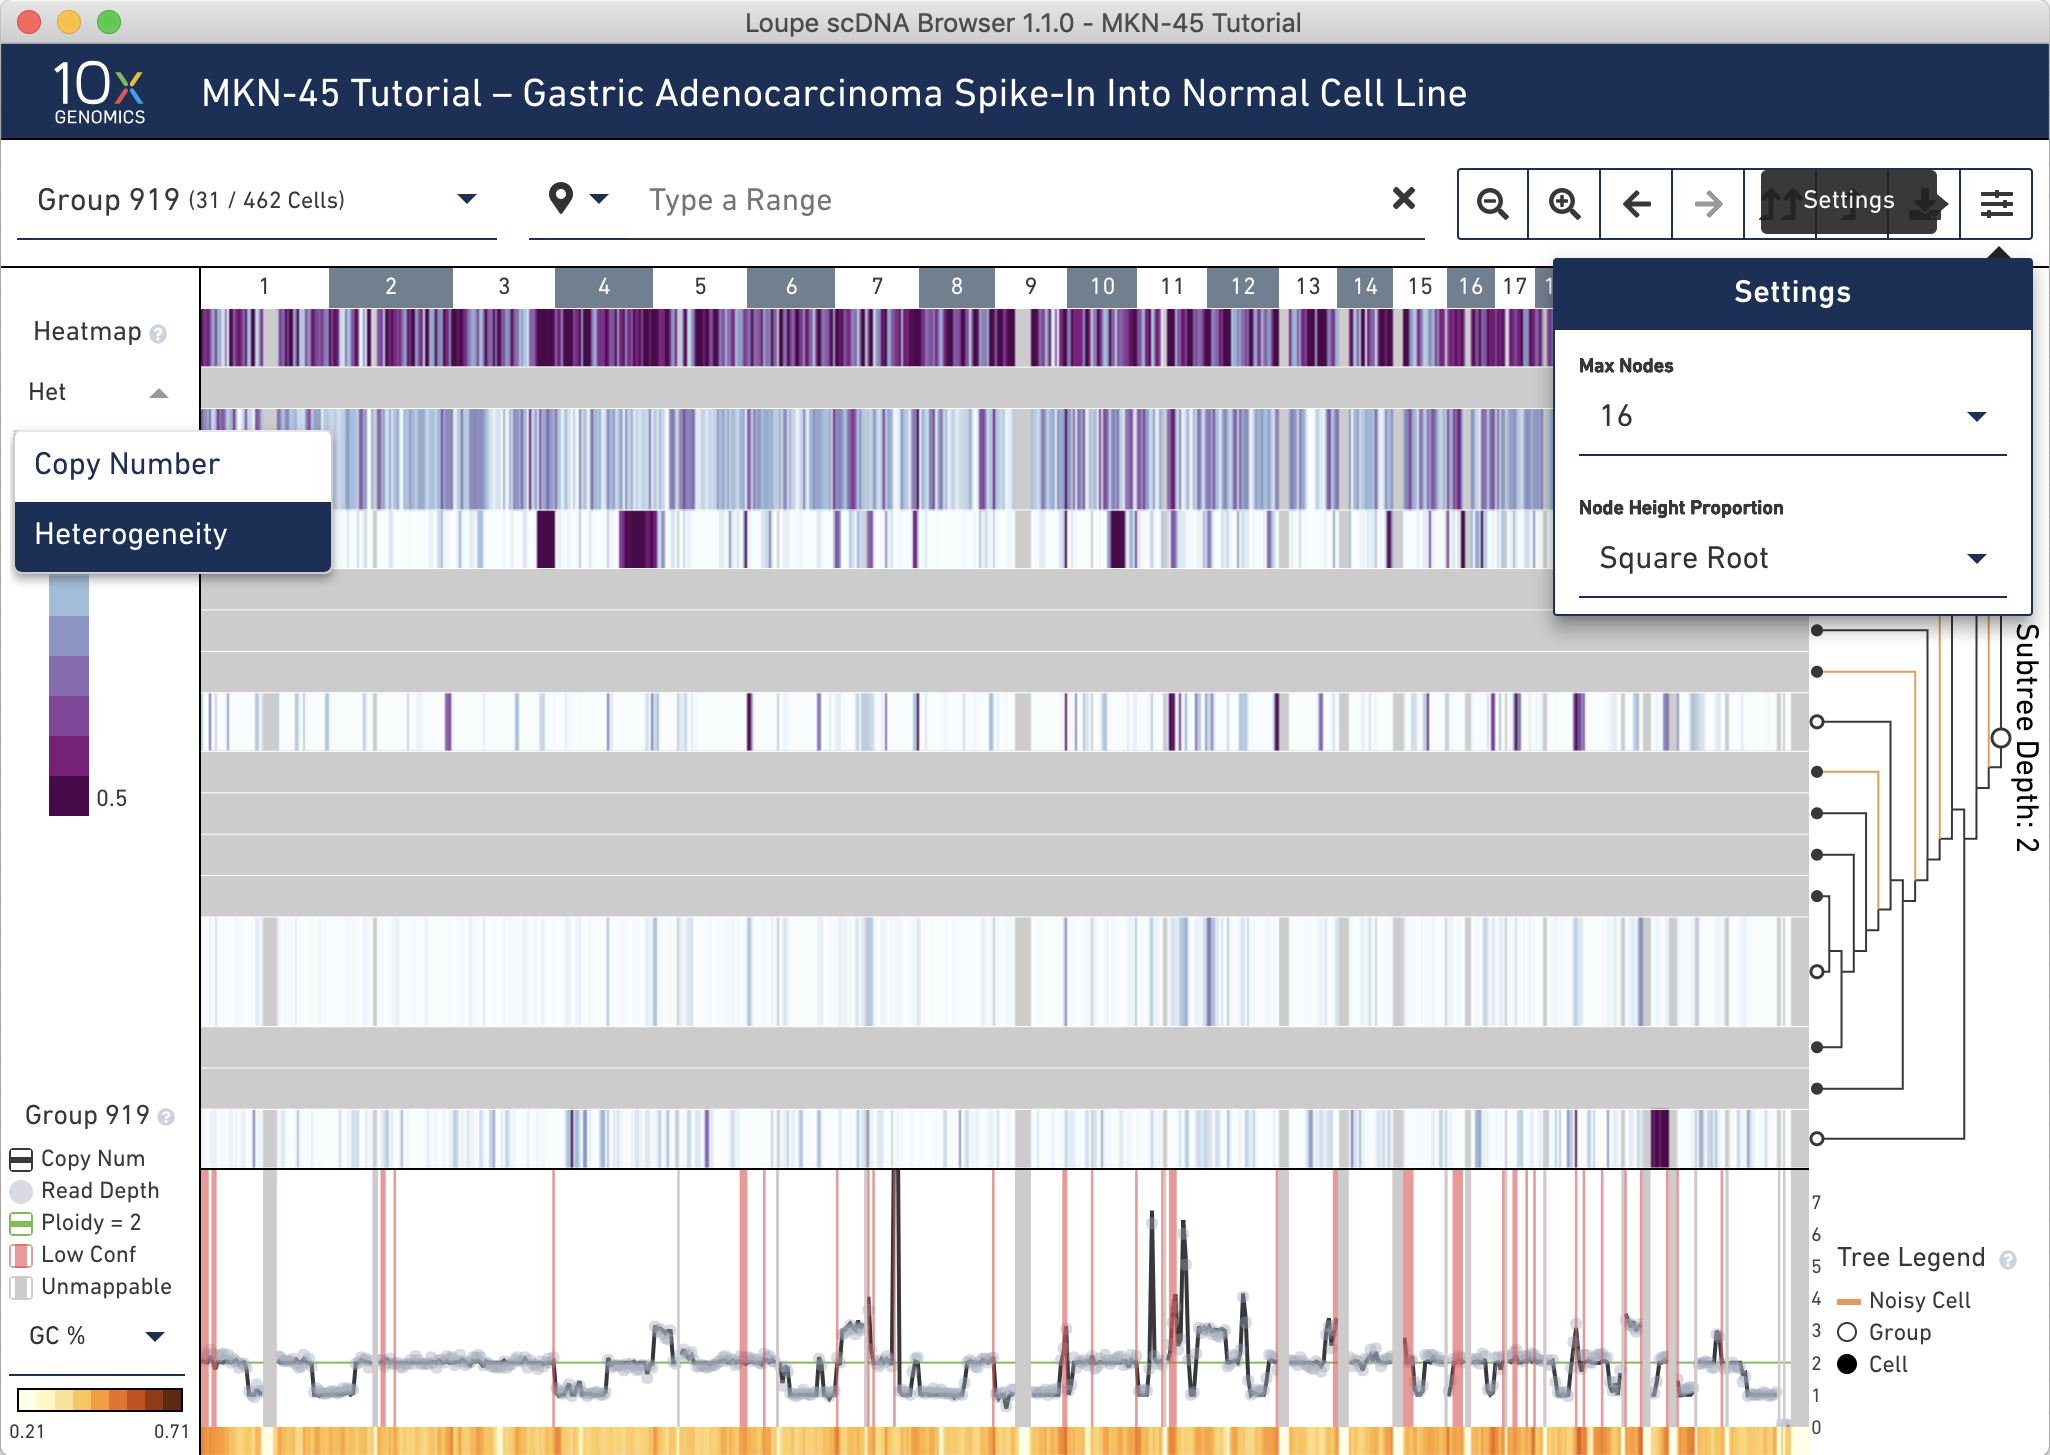
To look for groups within which may contain noisy cells, first change the settings to show at most 16 cells and use Square Root node height proportions, then switch the heatmap to display heterogeneity using the heatmap mode selector. We had to select only 16 cells otherwise the heterogeneity would be grayed out, as all 31 cells would have been visible. The heterogeneity heat map can be used to find small noisy subgroups, subclones in large datasets that merit further investigation, or regions of high variability.
It is clear that the two topmost groups (917 and 909) have higher heterogeneity than the other intermediate nodes. Hovering over these groups confirms this; 100% of cells within these groups are classified as noisy. There are four other single cells marked as noisy in this group (orange lines).
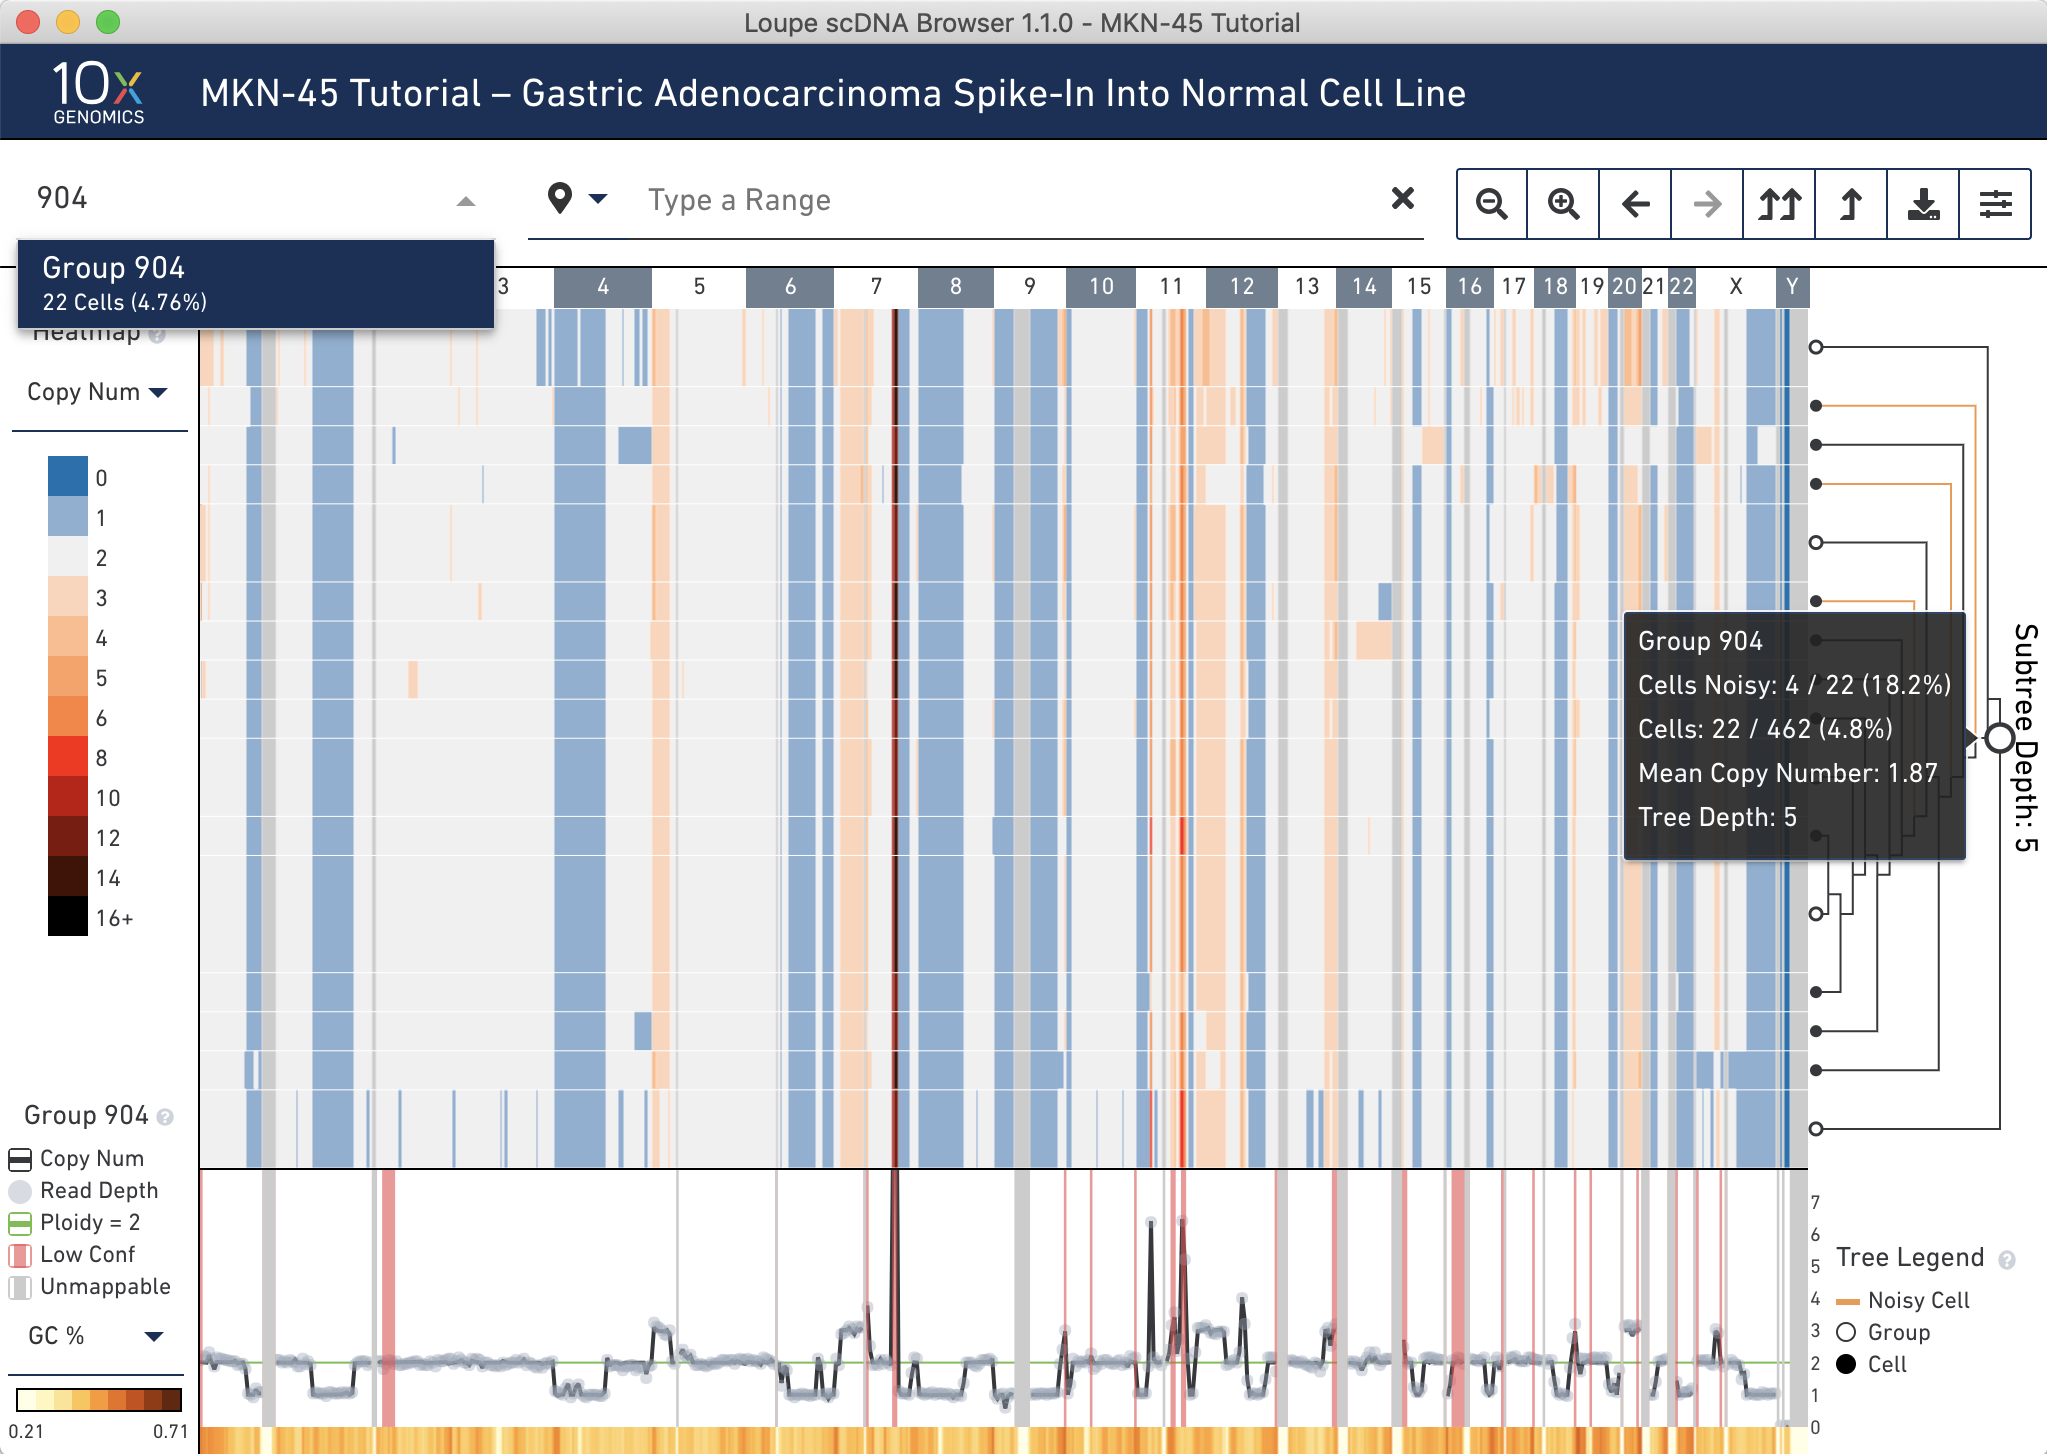
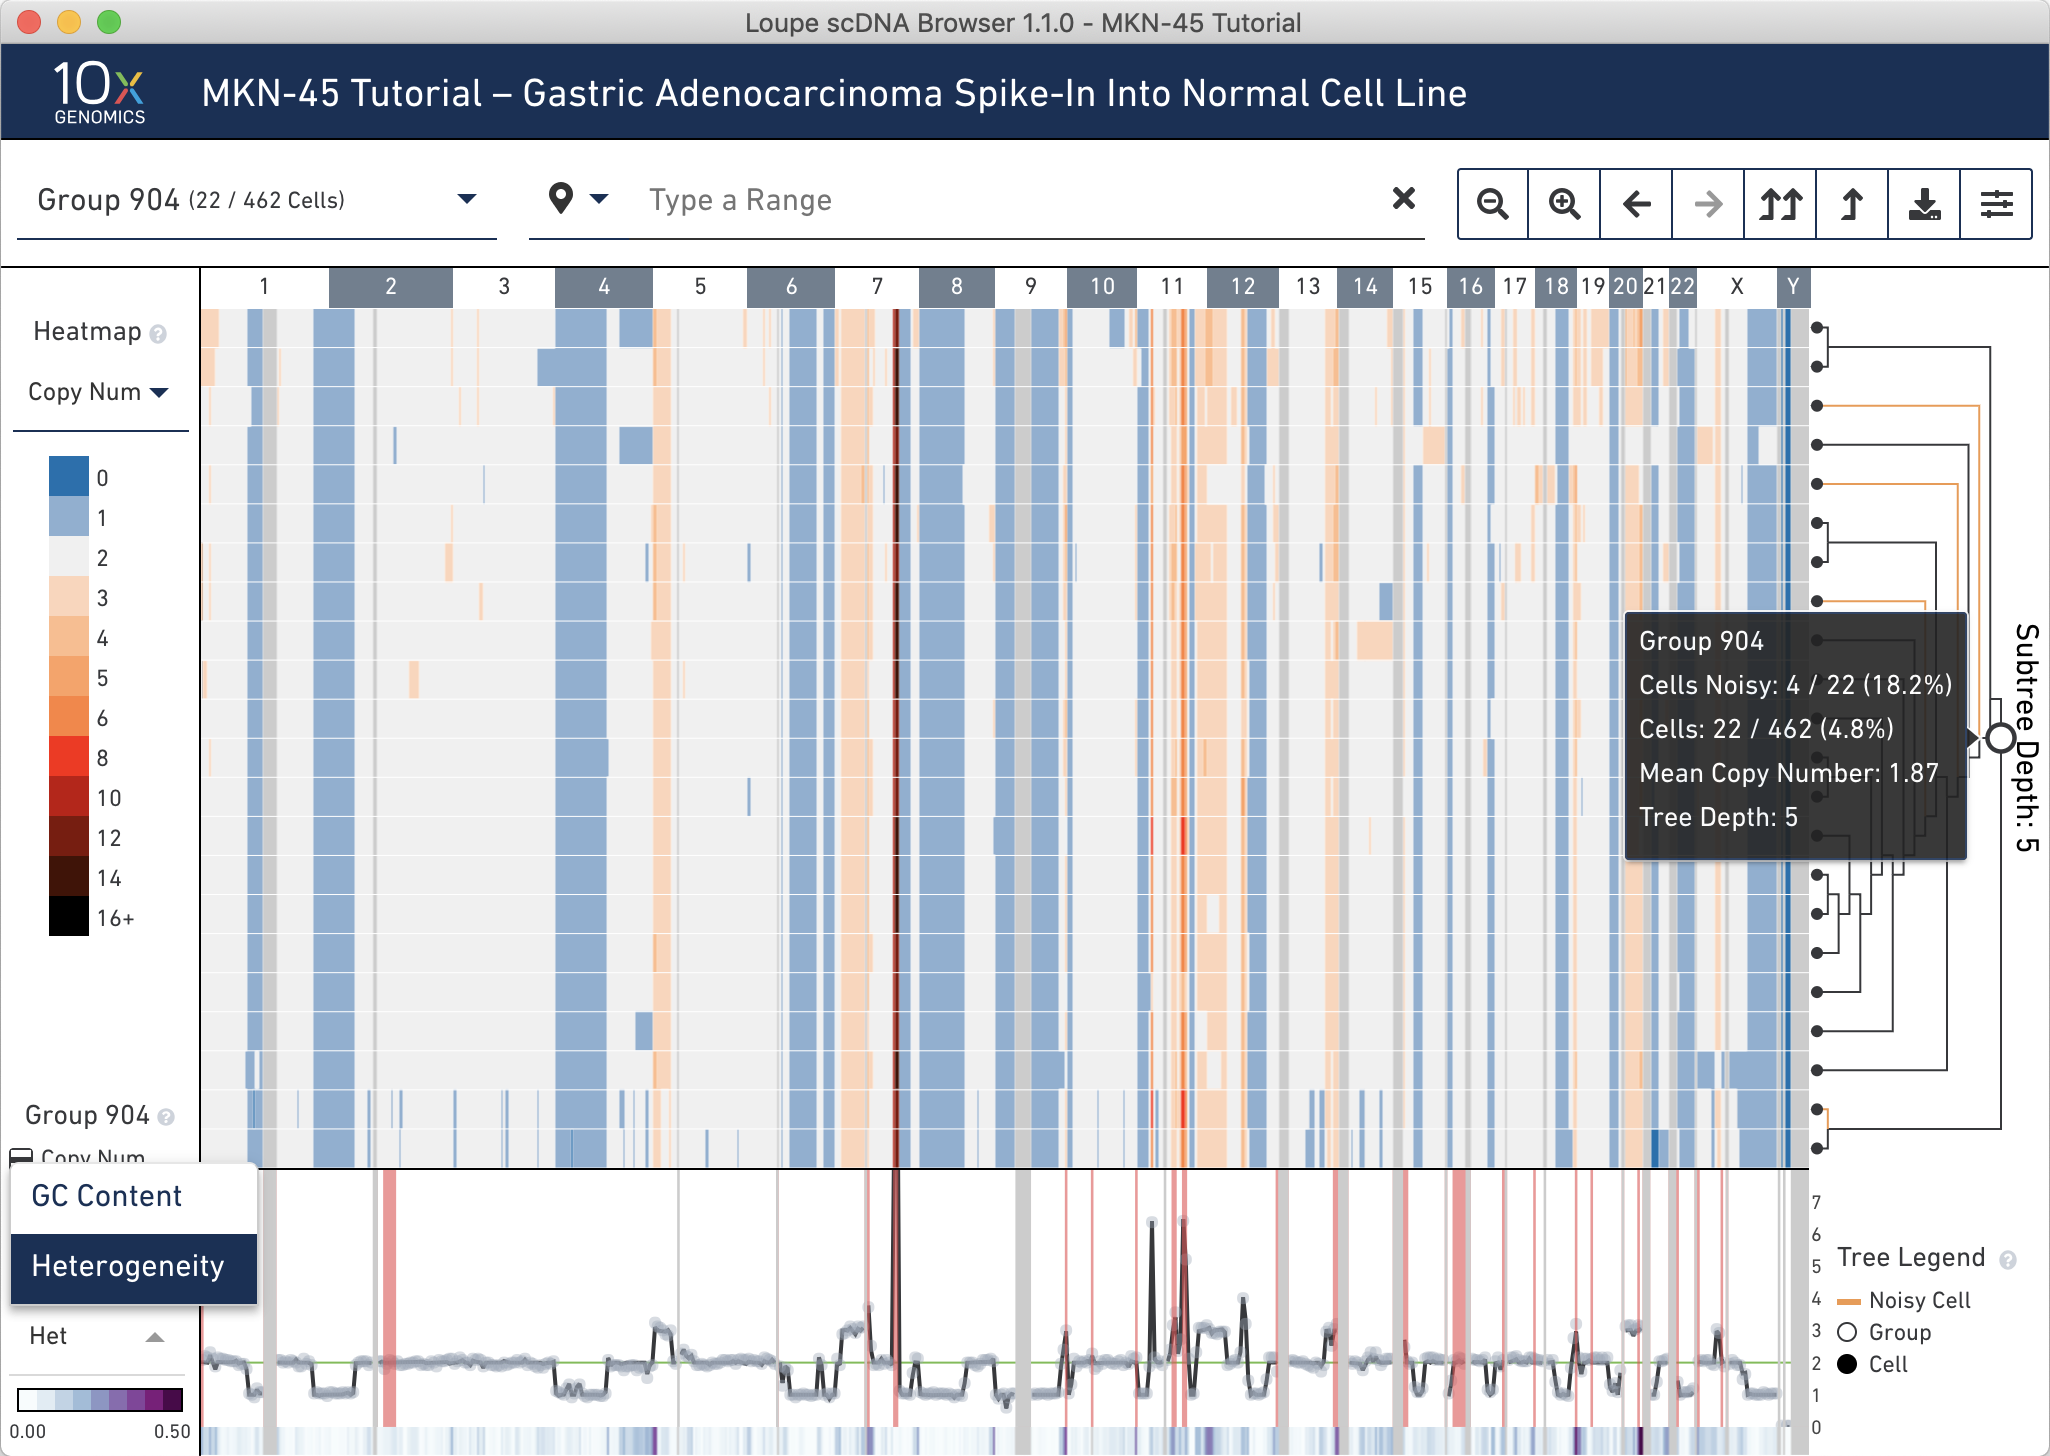
Next, switch back to displaying Copy Number through the heatmap mode selector. Using the tree, find an internal node within this subtree that minimizes the number of noisy cells without losing non-noisy cells. Group 904 looks like a good candidate. It is an intermediate node in the tree. If it is difficult to find this node by hovering in the tree, navigate directly to the node using the group or cell selector in the navigation. Do this by clicking to open it, typing 904, then selecting Group 904 from the dropdown.
Group 904 contains 22 cells. To view all the cells at one time, go into the settings dropdown again and change the max nodes to 32.
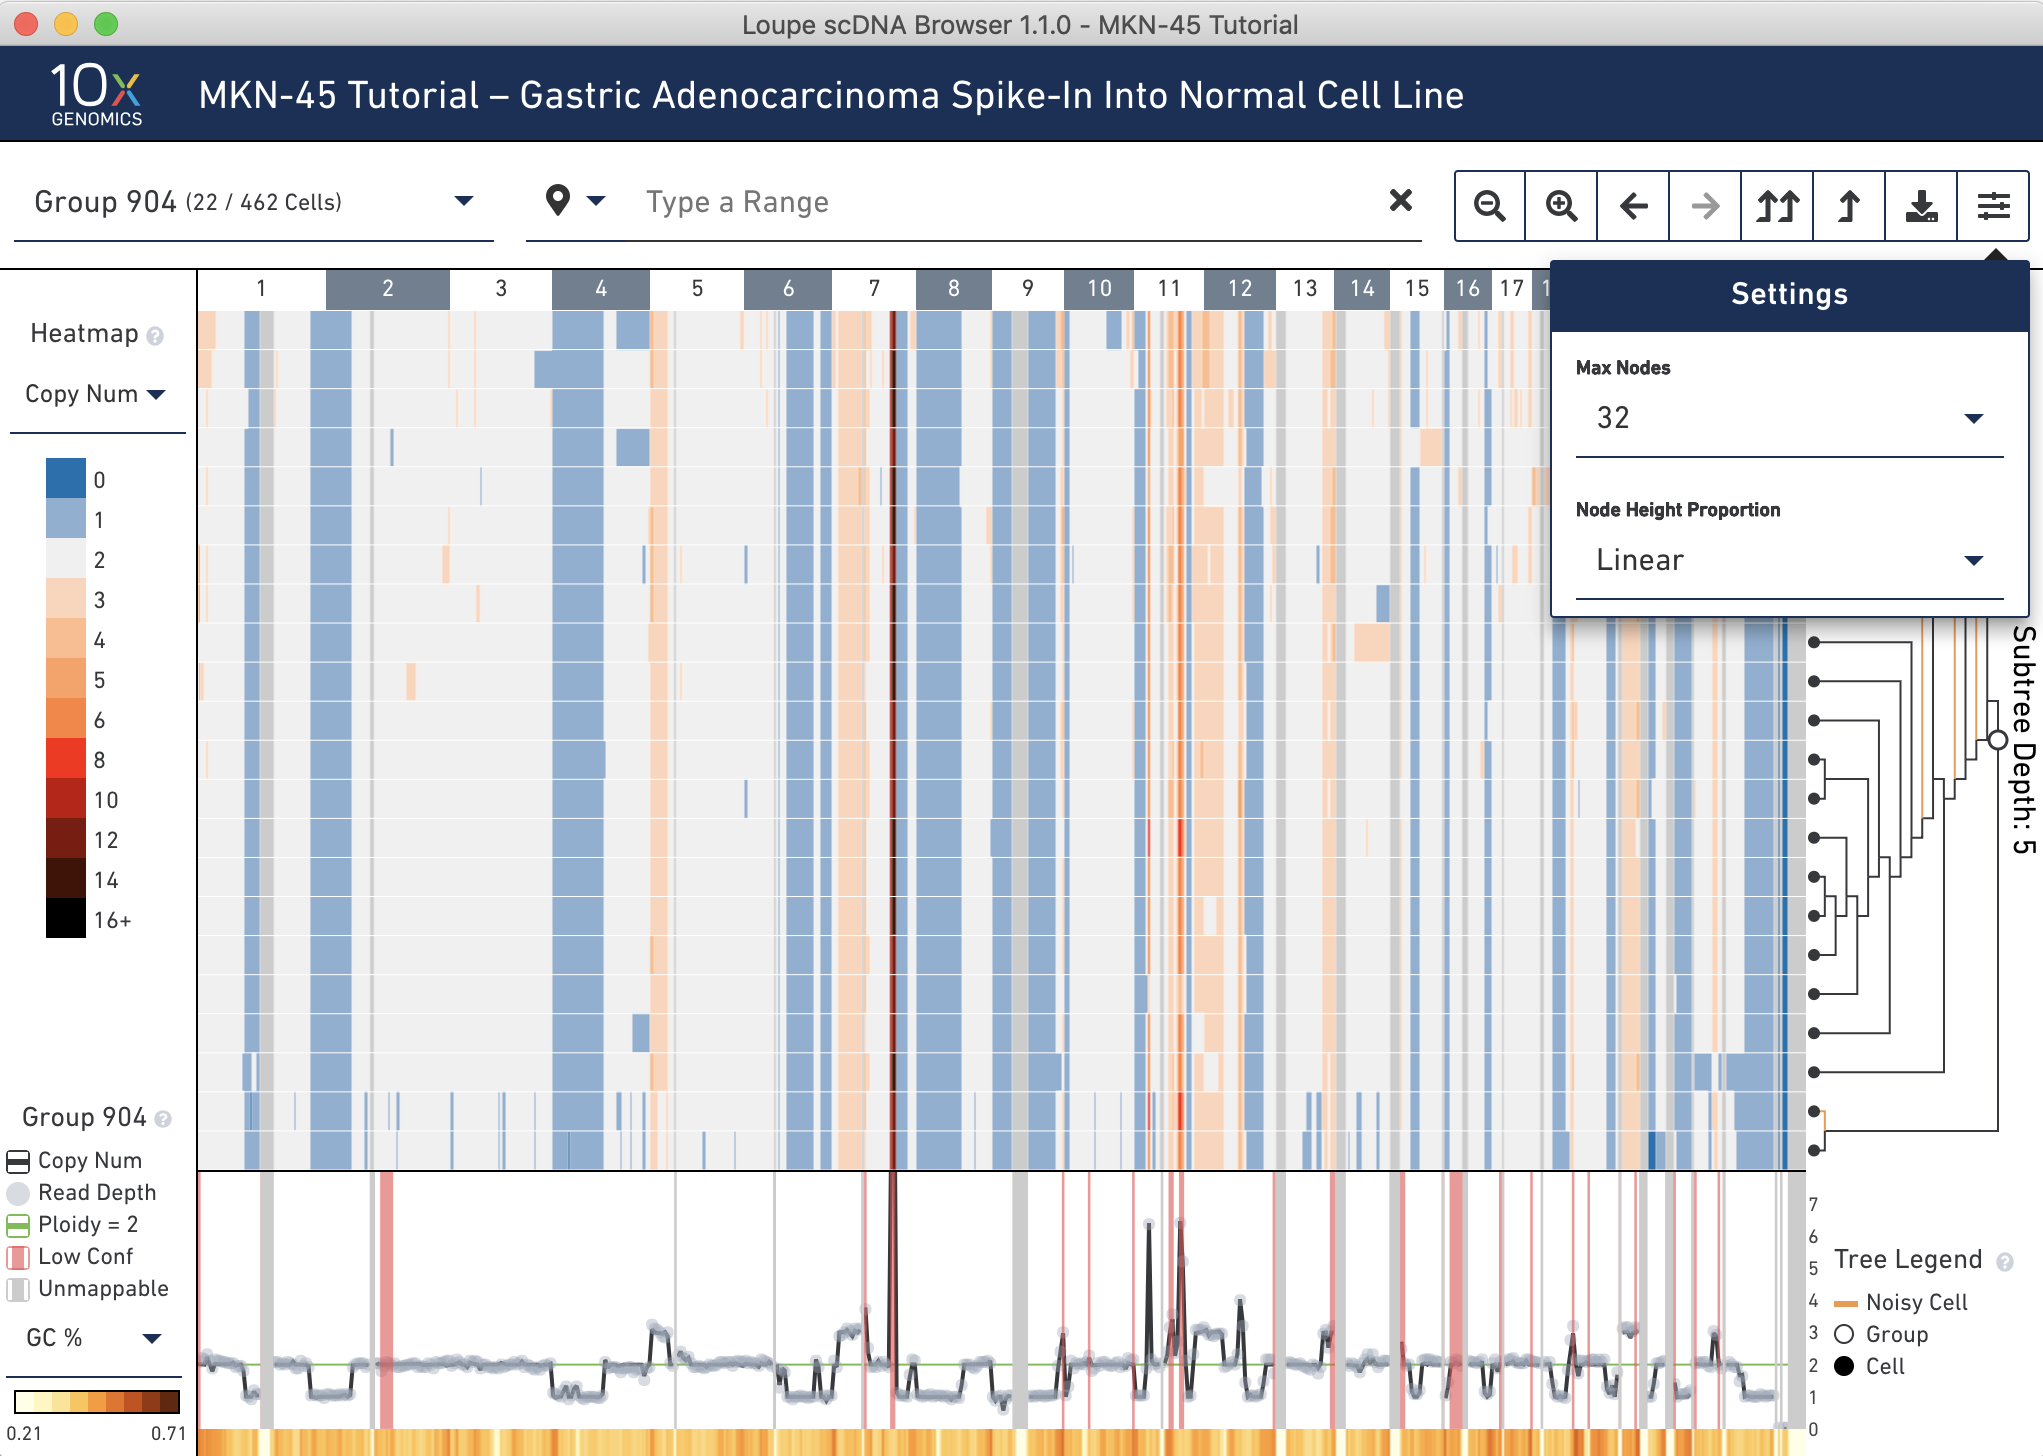
It looks like there are 4 noisy cells in this group. Confirm this by hovering over the subtree root (the larger open white node) in the tree to find the number of noisy cells in this group. If you reconfigure the trace colorbar selector at the bottom left to Heterogeneity, you can now refer to the trace at the very bottom to check that this group has low heterogeneity. By visual inspection, it looks like there is very low heterogeneity in almost all bins in this node. Hovering over the trace confirms this.
Now that you have identified the MKN-45 cells in this group, cross-validate this using known gene markers in MKN-45 cells from a publication.
A review of molecular characterizations in gastric cancer cell lines [1] includes MKN-45. This paper finds the following characteristics in MKN-45:
We can validate these findings amongst the MKN-45 cells in Loupe scDNA Browser. To zoom in on a gene of interest, click on the landmark icon in the Navigation panel and select 'Gene':
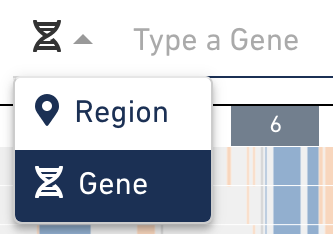
It is then possible to search for genes using this selector by gene name or ID. Type 'CDKN2B' into the genomic range selector, and press Enter. The heatmap will show the 20kb bin containing the gene, as well as the annotation in the trace. Clearly you can see the deletion:
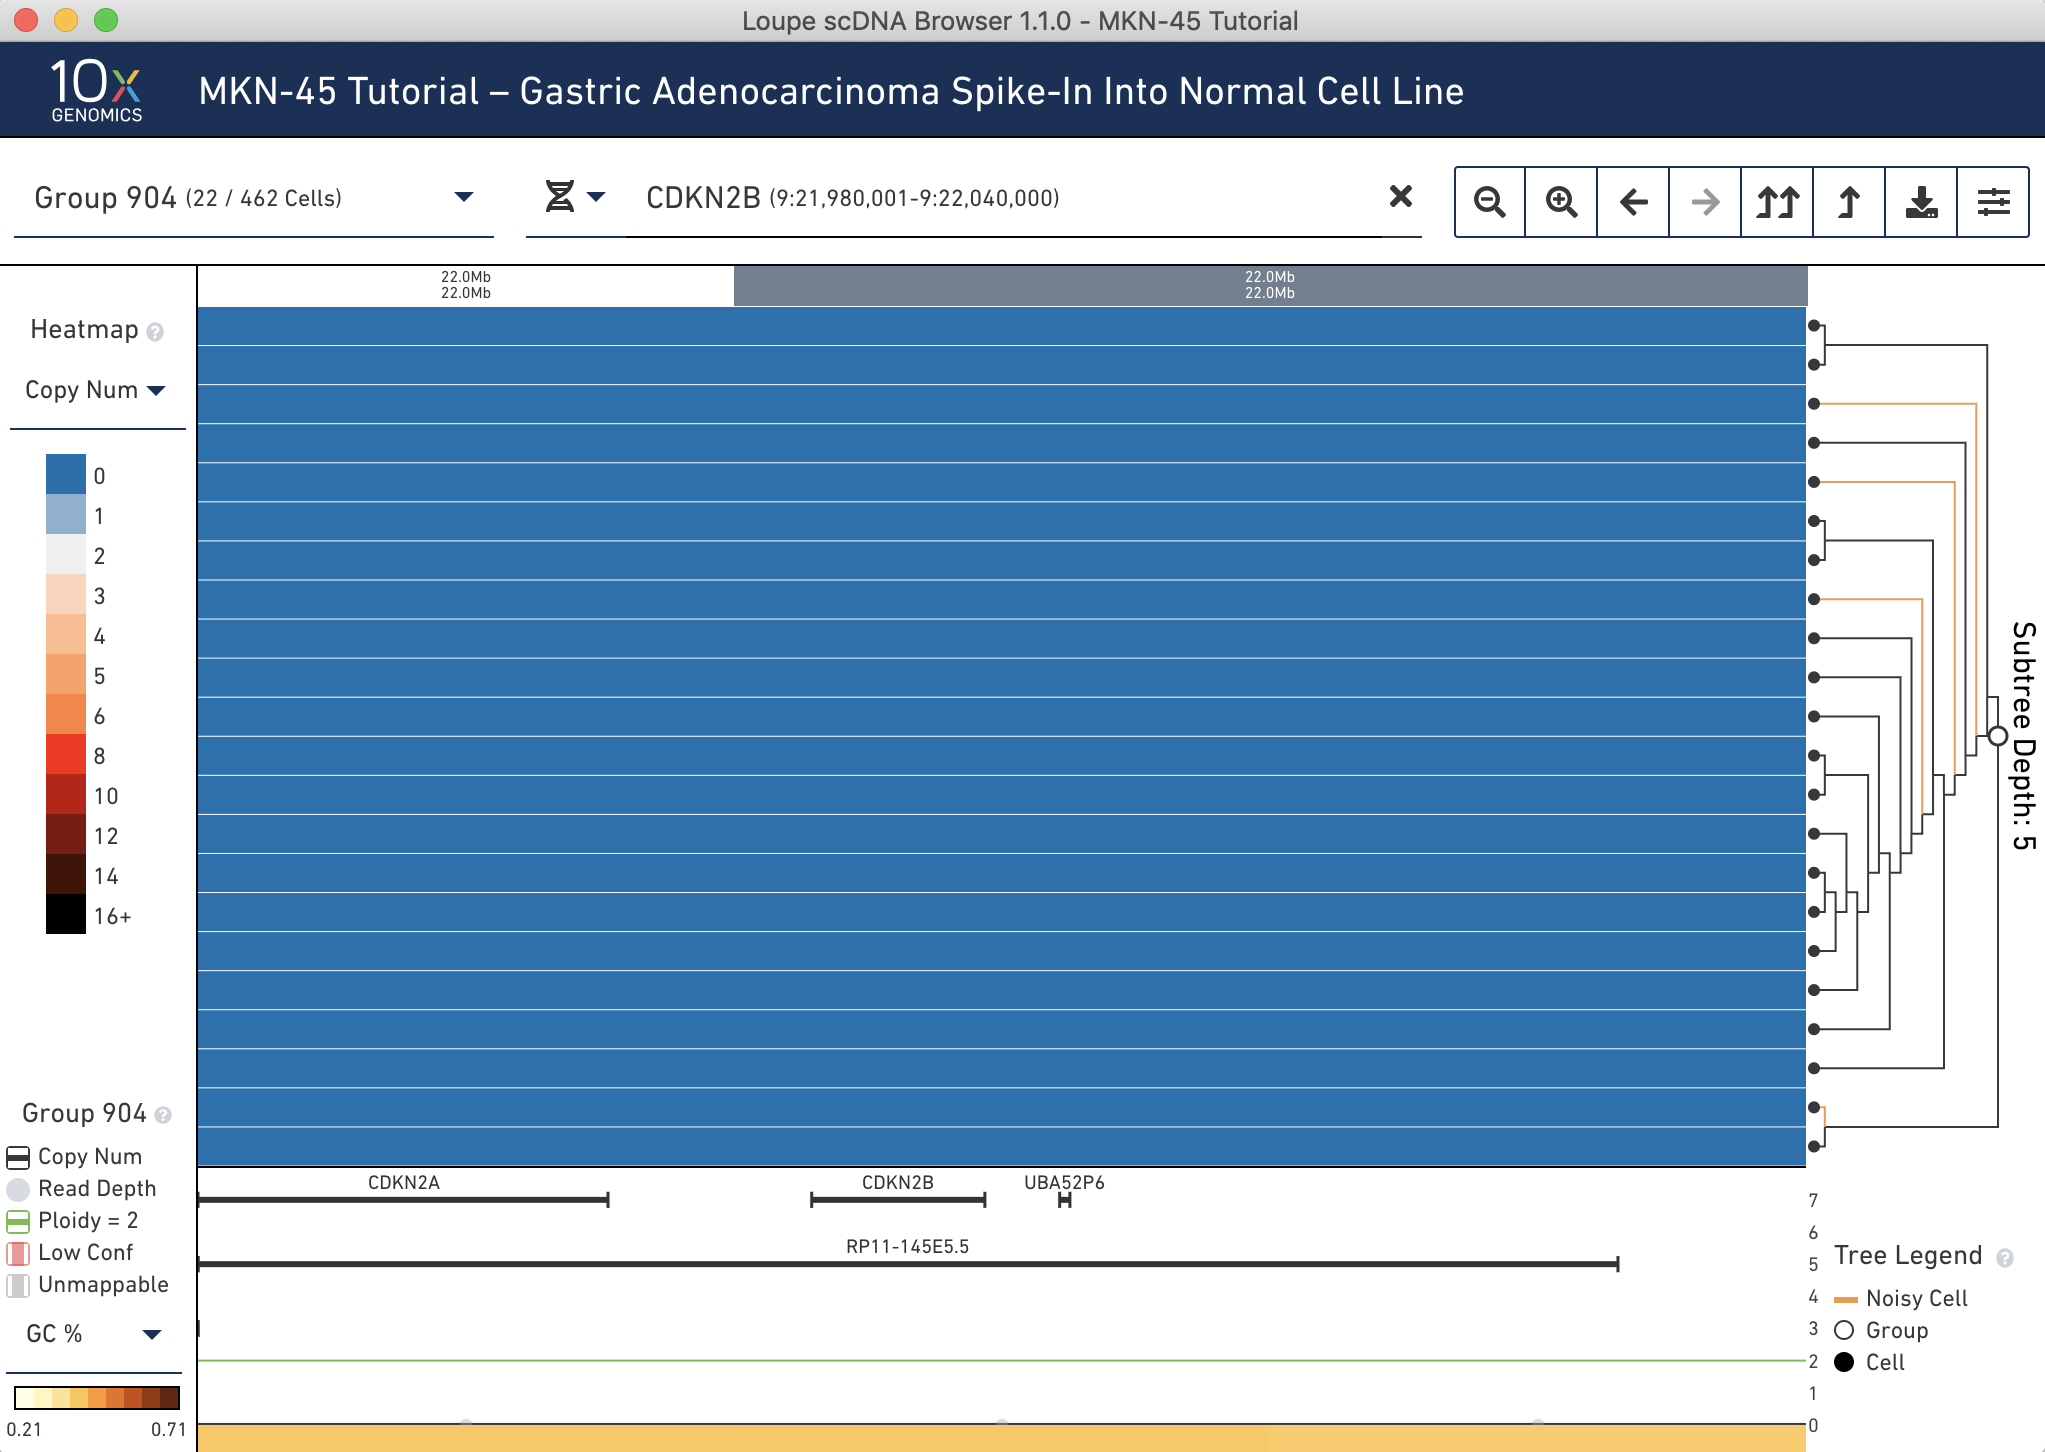
You will also be able to see extremely high amplification around MET, the deletion in CDKN2A, and a wild-type TP53. It is quite amazing that it is possible to see all of these clearly at the single cell level.
Congratulations! You have made it through the Loupe scDNA Browser tutorial. Now you are fully equipped to analyze any dataset using this software.
[1]: Yokozaki, H. (2000). Molecular characteristics of eight gastric cancer cell lines established in Japan. Pathology International, 50(10), pp.767-777.