Cell Ranger DNA1.0, printed on 04/08/2025
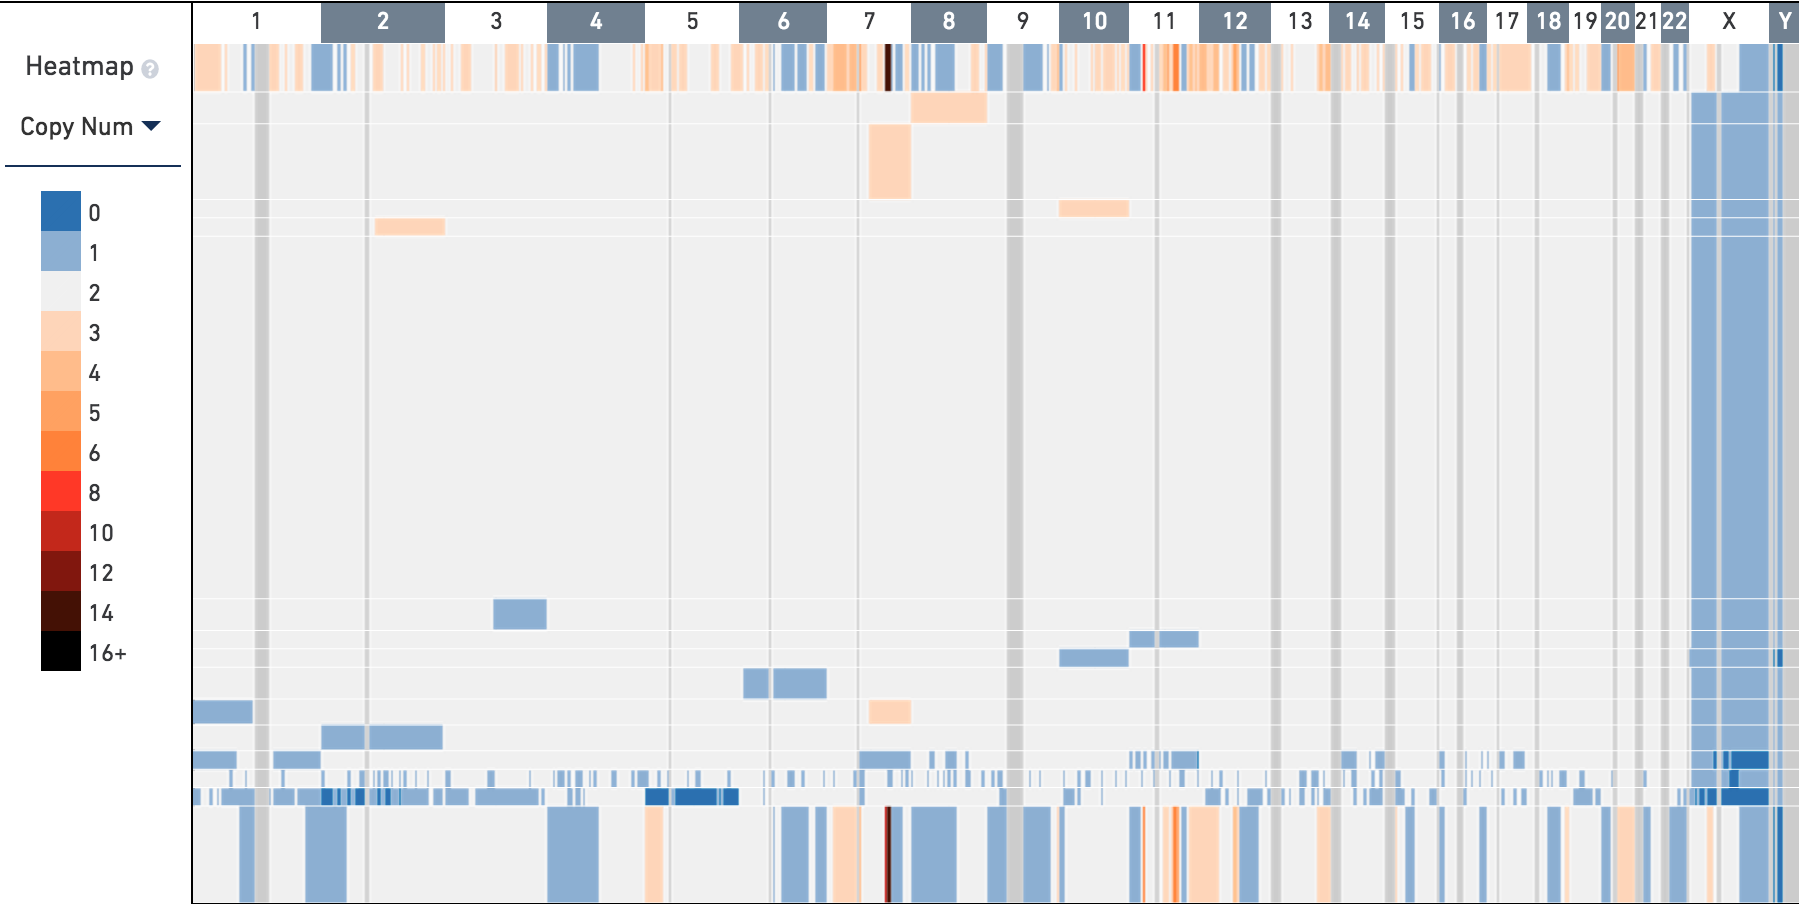
When you first open the MKN-45 tutorial dataset, the heatmap displays copy number data for the entire genome, across the top 16 descendant nodes of the top tree root. Each node represents either a group of cells or an individual cell.
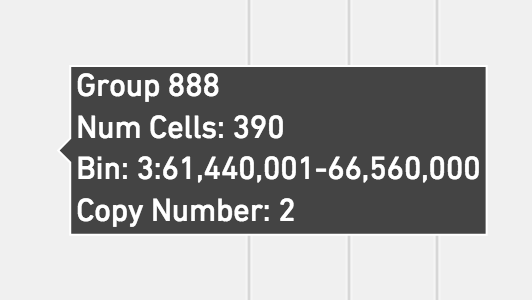
Each rectangle in the heatmap represents either a copy number call or the heterogeneity for a region in the genome, depending on the current mode of the heatmap. When viewing wide segments of the genome, copy number calls and heterogeneity are downsampled and averaged into larger bins. Zooming into narrower regions will reveal calls down to 20kb resolution. Hover over the heatmap to determine the bin range and exact copy number of a particular region.
The genomic region labels display chromosome labels or a genomic range within
a chromosome if only one chromosome is displayed. This sample dataset contains
Ensembl-style chromosome names which do not contain a chr prefix. The names of
the contigs are determined by the reference that is used when running the
cellranger-dna pipeline.

You can use the genomic region labels to zoom into the genome. To do so, click
on a chromosome label. The genomic region input updates to show the currently
visible chromosome. The bins are now also updated to show locations within that
chromosome. Click the x button in the genomic range selector within the
Navigation panel to return to the full genome.
The colors for each bin are referenced in the heatmap legend. Each copy number value is discretized from 0 to 6, then one color for every two copy numbers from 8 to 16 is shown.
You can adjust the coloring of the heatmap through the legend. First, you can
highlight regions with a particular copy number. To do so, click on a color box
in the legend, and select Show Only Copy Number X in the menu. You can reset
the heatmap by clicking anywhere on the legend and selecting
Show All Copy Numbers.
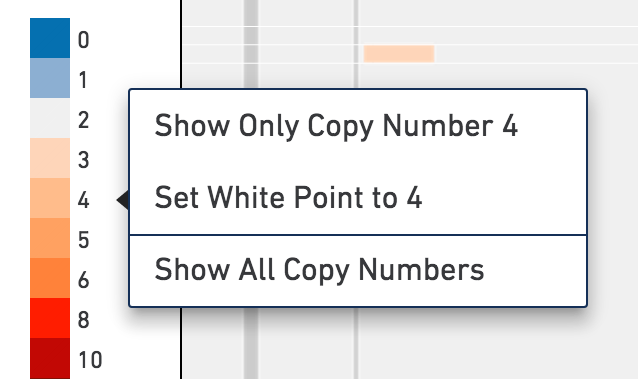
You can also adjust the white point of the color scale, which may be appropriate
for viewing samples with higher natural ploidy. To modify the white point, click
on the legend at a color and select Set White Point to X. All colors less than
the new white point becomes a shade of blue, and all colors greater than the
white point are a warm color. Reset the white point to 2 by clicking where the
legend is 2 and selecting Set White Point to 2.
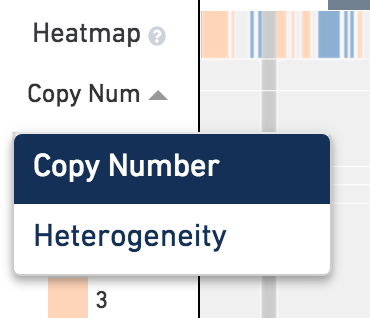
You can also view the heterogeneity of nodes through the heatmap. To do so, click on the heatmap mode selector, which will be set to "Copy Num" by default.
In the toolbar, the rightmost button contains settings for the heatmap. Click on the settings button to explore those options.
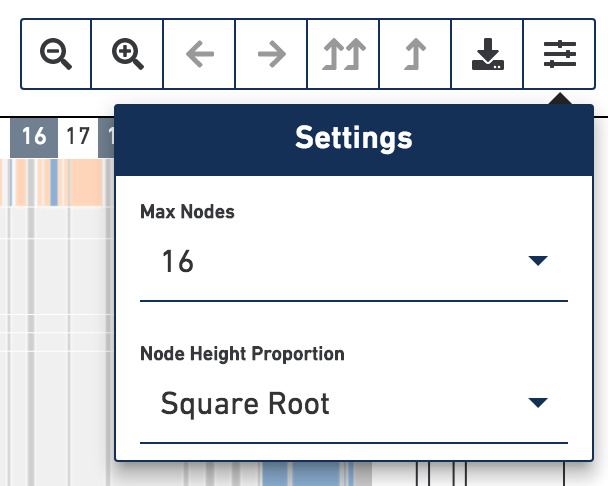
The max nodes option limits the maximum number of nodes displayed in the heatmap at a time. Selecting higher numbers will display more nodes in the heatmap. However, the browser's performance degrades when 128 or greater is selected. Please exercise caution when setting max nodes to 128 or greater as the interface may become slow.
The node height proportion option determines how the heights of the rows are
scaled. By default, the height of each row corresponds to the square root of the
number of cells that are descendants of that node. Normalizing by square root
makes it easier to see smaller groups and single cells. When viewing the heatmap
in Linear mode, nodes with low numbers of cells become hard to see, but it is
easier to interpret the relative size of each group of cells.
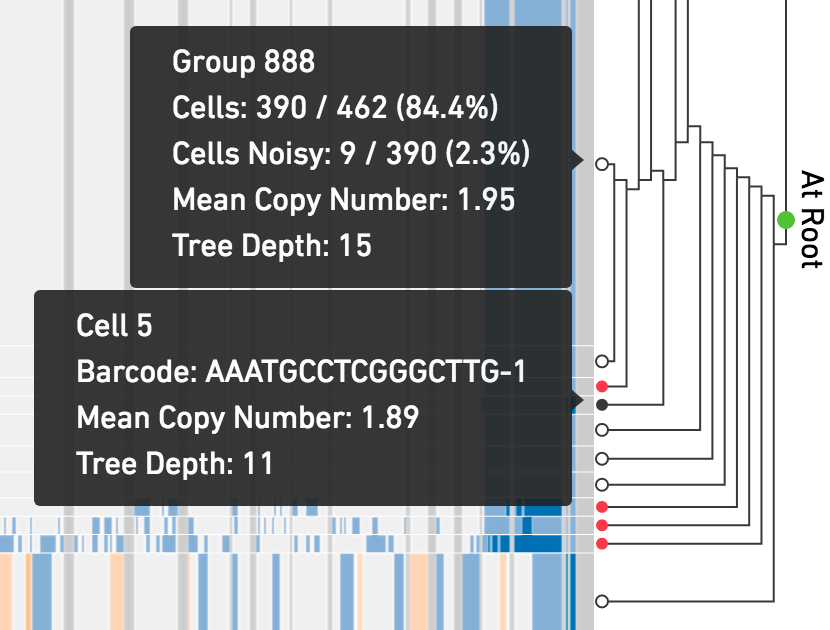
The displayed tree is a subtree of the full cell hierarchy computed by the pipeline. Each leaf in this subtree is labeled using symbols so that it's easy to tell which leaves are cells, and which are groups of cells. In the tree, open circles are groups of cells and solid circle nodes are single cells. Red solid circles are indicative of a noisy cell. A cell is marked as noisy if its read depth profile is more variable than other cells in the sample or if there is uncertainty that the cell's copy number scaling is correct. Cells undergoing replication are often marked by the pipeline as noisy. The root node in this subtree is labeled with a green filled in circle.
Hovering on any node displays additional information about that node. Hovering over a group or cell shows different data.
Click on any node in the tree, internal or leaf, to navigate directly to that node. There are also two buttons on the toolbar that allow you to navigate upward in the tree. Clicking on the single up arrow navigates one level up in the tree, and clicking on the double up arrow returns you to the root. Additionally, there's an indicator to the right of the tree that displays the depth of the current subtree's root node.
Loupe scDNA Browser shows a fixed number of descendant nodes from the subtree root, in order to performantly scale to samples with many thousands of cells. The nodes are selected using a greedy algorithm that starts at the current root and expands the open node with the greatest number of leaves. To see more nodes concurrently, click on the Settings button as explained in the Heatmap Options.
In this sample, there were a total of 462 cells identified and a total of 923
nodes in the tree. Each group or cell is identified by a unique id. Since the
tree generated is a binary tree, we can compute the number of total nodes in the
tree using the number of cells (leaf nodes) and the equation
(2 * number of cells) - 1 = number of nodes in tree. However, since our nodes
are 0-indexed, the ids will range from 0 to (2 * number of cells) - 2,
inclusive. The highest node id will always be the root node since the tree is
constructed using a bottom-up approach. In this case, the root node is named
Group 922, for our tree of 923 nodes. When we load a dloupe file, Loupe scDNA
Browser will always initially display the root node of the tree.
Remember that each non-leaf node in the tree represents a group of cells. For each intermediate node in the tree, the CNV calling algorithm is run using all the reads in all the descendant cells in that group. To read more information how the tree is created and how copy number for intermediate nodes is determined, please refer to the Cell Ranger DNA documentation.