Cell Ranger DNA1.0, printed on 04/08/2025
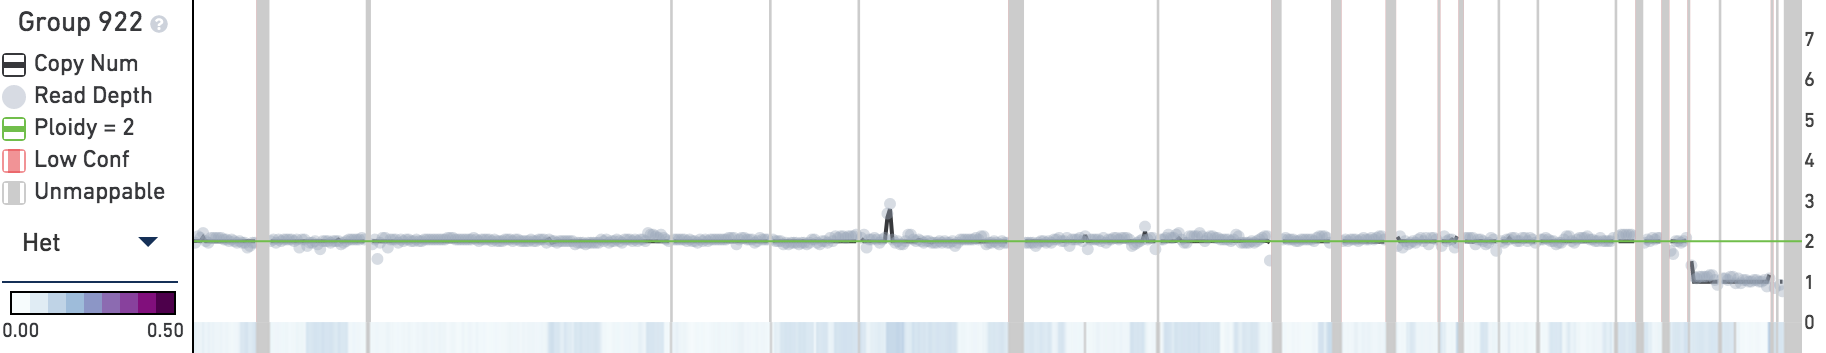
The trace displays copy number, read depth, and other data about the current subtree root. When you first open the MKN-45 tutorial dataset, the trace will contain information about the root node of the entire cell hierarchy, labeled Group 922. The trace, in contrast to the heatmap, shows data about the currently selected group or cell, not data about the descendants of the selected node.
The trace displays the following data for the current root group or cell:
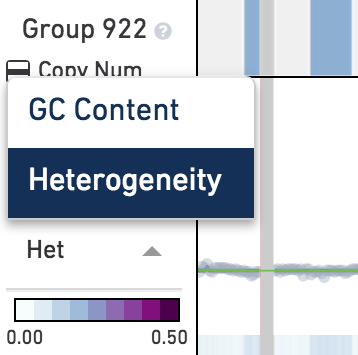
Below the main plot is a colored strip which, by default, displays the heterogeneity of copy number calls at this node. Remember that heterogeneity is only defined for groups of cells and is undefined (gray) for single cells. To switch this colored strip to display the GC content of the underlying genome instead, click on the trace colorbar selector and select GC Content.
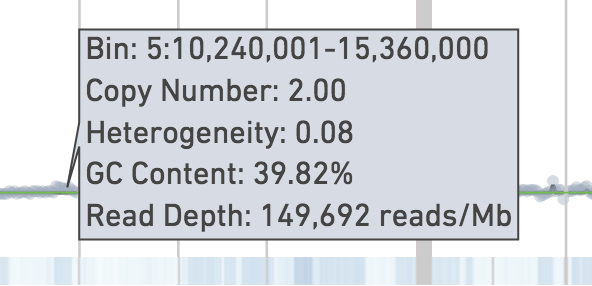
Hovering on the plot displays the exact numbers of aforementioned data: genomic range of the bin, ploidy, heterogeneity, GC content, and read depth.