Cell Ranger DNA1.0, printed on 04/02/2025
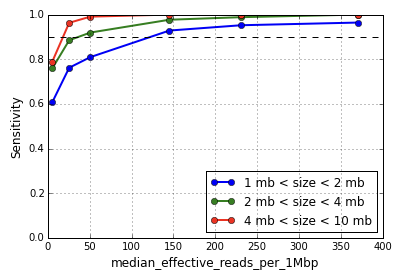
Defined as the median number of non-duplicate reads with mapping quality at least 30 per megabase (MB) per cell, this metric captures the number of effectively usable reads per MB for CNV calling. CNV sensitivity and positive predictive value are functions of this metric, with greater median effective reads increasing the resolution of event calling. As shown in Figure 1, CNV detection sensitivity for events in the size range 1-2 MB begins to degrade around 150 median effective reads per MB, and sharply so around 50.
The median fraction of total reads in a cell that are duplicates and have mapping quality at least 30. Duplicate reads with high mapping quality arise from both PCR amplification during library preparation and during the sequencing itself. The number of duplicates scales with the depth of sequencing; increasing the depth increases the number of duplicate reads. In the recommended sequencing configuration this value is typically < 15%, and greater values imply either a problem during the library preparation process or due to excessive numbers of duplicates generated during the sequencing itself.
MAPD is a measurement of the bin-to-bin variation in read coverage that is robust to the presence of CNVs, and is an indicator of the evenness of whole genome amplification (WGA). Garvin et al. use this statistic, which they call MAD, to evaluate their DOP-PCR WGA technique to MALBAC and MDA, finding their DOP-PCR method has MAPD values in the 0.1-0.3 range, relative to MDA with MAPD values in the 0.4-0.6 range.
MAPD, or the Median Absolute deviation of Pairwise Differences, is defined for a vector v[i] as follows:
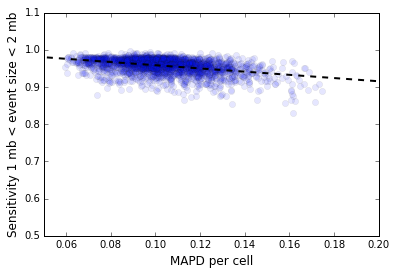
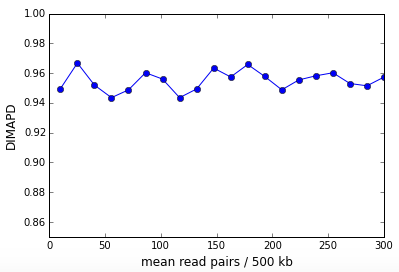
d[i] = ( v[i] - v[i+1] )/Mean(v),d[i] defined as Median(|d[i] - Median(d[i])|).In our context, the vector v[i] represents the number of mapped de-duplicated read pairs per 500 kb genome bin, either before or after GC normalization, restricted to the mappable regions of the genome. Note that this metric is different from the MAPD metric used to measure the quality of microarray data where the vector v[i] is the log intensity: that metric uses the median of absolute values instead of the median absolute deviation. The normalized MAPD is a predictor of CNV detection sensitivity. Figure 2 below shows the inverse variation of the sensitivity for CNV detection with MAPD for the 5k MKN-45 Gastric Cancer Cell Line dataset for 2,408 cells in Group 9303 that represents the majority clone.
The median normalized MAPD for this dataset is 0.10. Shown below are three cells from this dataset, 44, 45 and 46, with MAPD values of 0.12, 0.15, 0.08. Cells 44 and 46 have comparable sequencing depth per cell, but cell 44 has a higher MAPD because of higher bin to bin coverage variation caused by active DNA replication. Cell 45 has a higher value of MAPD compared to cell 46 because it has lower sequencing depth and consequently higher bin to bin variation in read coverage caused by sampling effects.
Cell 44: effective reads per MB = 603, normalized MAPD = 0.12, normalized DIMAPD = 1.37.

Cell 45: effective reads per MB = 147, normalized MAPD = 0.15, normalized DIMAPD = 0.92.

Cell 46: effective reads per MB = 619, normalized MAPD = 0.08, normalized DIMAPD = 0.89.

As the examples above illustrate, the sequencing depth is a major contributor to the MAPD. The figure below shows the MAPD plotted against read depth for an in-silico simulation where the read counts were sampled from a Poisson distribution whose mean was varied. The MAPD varies inversely with the square-root of the read depth.
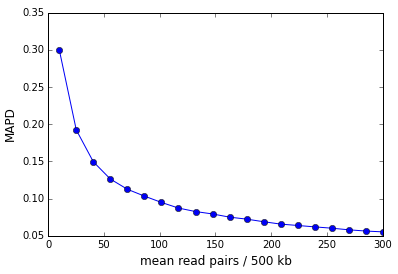
In the case of perfectly Poisson distributed reads the MAPD asymptotes to zero in the limit of infinite sequencing depth (and infinite library complexity). In reality, there is a non-zero asymptote that represents the dispersion in the finite number of library molecules across bins.
Unfortunately, MAPD is dependent on sequencing depth, making it difficult to compare across samples. For this purpose we have devised DIMAPD, a depth-independent analogue.
DIMAPD or Depth Independent MAPD is constructed from the MAPD and is approximately depth independent. It is constructed by multiplying the MAPD per cell with the square root of the read depth per cell for all cells in the sample. After multiplication, the non-zero MAPD asymptote presents as a linear growth with the square root of read depth. We correct this linear trend and the result is the DIMAPD per cell. In Figure 3 above, the DIMAPD values for cells 45 and 46 are comparable demonstrating that DIMAPD successfully subtracts out sampling effects due to sequencing depth. Cell 44 on the other hand has a higher DIMAPD that reflects the high coverage variation due to DNA replication. The figure below shows the DIMAPD as a function of depth for the in-silico simulation described above and is clearly depth independent.
High values of DIMAPD can be used to detect cells that have high bin to bin variation in read coverage and we use this property to flag cells in the sample that are "noisy". This noise could be a consequence of biological factors like DNA replication or cells that have undergone apoptosis or technical workflow issues like incomplete cell lysis or denaturation of DNA. Note that MAPD cannot be used for this purpose since a noisy cell and a cell with low sequencing coverage would both have high MAPD values.
MAPD and DIMAPD are robust to the presence of CNVs. The table below shows the median and inter-quartile range for DIMAPD for five datasets.
| Dataset | Median DIMAPD | Inter-quartile range DIMAPD |
|---|---|---|
| 5k MKN-45 Gastric Cancer Cell Line | 0.96 | 0.11 |
| 1k Nuclei from BJ Fibroblast Euploid Cell Line | 0.99 | 0.04 |
| 1k Cells from BJ Fibroblast Euploid Cell Line | 0.97 | 0.04 |
| BJ with 10% MKN-45 Spike-In | 0.98 | 0.05 |
| 1k BJ with 1% MKN-45 Spike-In | 0.97 | 0.04 |
A cell can have high DIMAPD due to underlying biological reasons or due to the library preparation workflow. Some common reasons include:
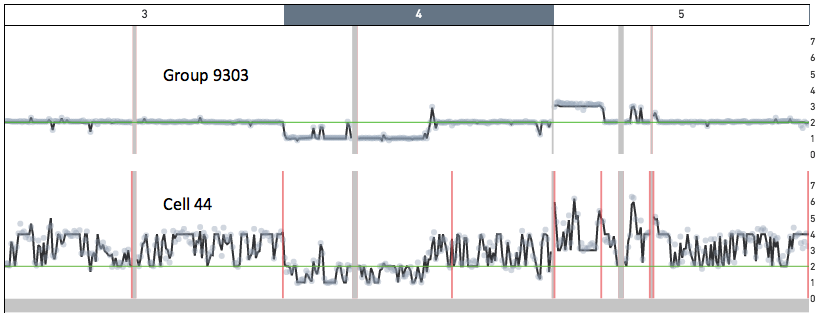
DNA replication: when a cell that is actively undergoing DNA replication is processed through the system, the resulting copy number across the genome shows oscillations between states X and 2X where X is the expected copy number. For example, in a normal diploid cell autosomal regions with an expected copy number of 2 will instead show fluctuating copy number states 2, 3 and 4. Since replication proceeds in stages, cells that are very early or very late in S phase will not necessarily have high values of DIMAPD. The distance function employed in the agglomerative clustering step segregates these replicating cells separately from their non-replicating peers; making it easier to filter them during downstream analysis.
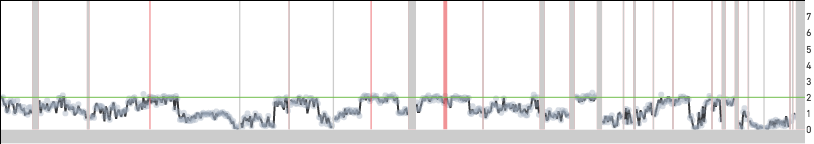
Cell 44 in the 5k MKN-45 Gastric Cancer Cell Line dataset provides an example of a cell undergoing DNA replication. Shown below are snapshots of chromosomes 3, 4 and 5 for Group 9303 - a group of non-replicating MKN-45 cells - and for cell 44. In Group 9303, most of chromosome 3 has copy number 2, chromosome 4 has a ~ 100 Mb copy number 1 region, and chromosome 5 has a 35 Mb copy number 3 region. A region of copy number X in Group 9303 has copy number ranging from X to 2X in cell 44.
Wavy profiles: when the DNA in a cell is degraded or due to imperfections in the workflow we occasionally see "wavy" read count per bin profiles. Cell 380 in the 1k Nuclei from BJ Fibroblast Euploid Cell Line dataset is one such example: