Cell Ranger DNA1.1, printed on 04/02/2025
| Analysis software for the 10x Genomics single cell DNA product is no longer supported. Raw data processing pipelines and visualization tools are available for download and can be used for analyzing legacy data from 10x Genomics kits in accordance with our end user licensing agreement without support. |
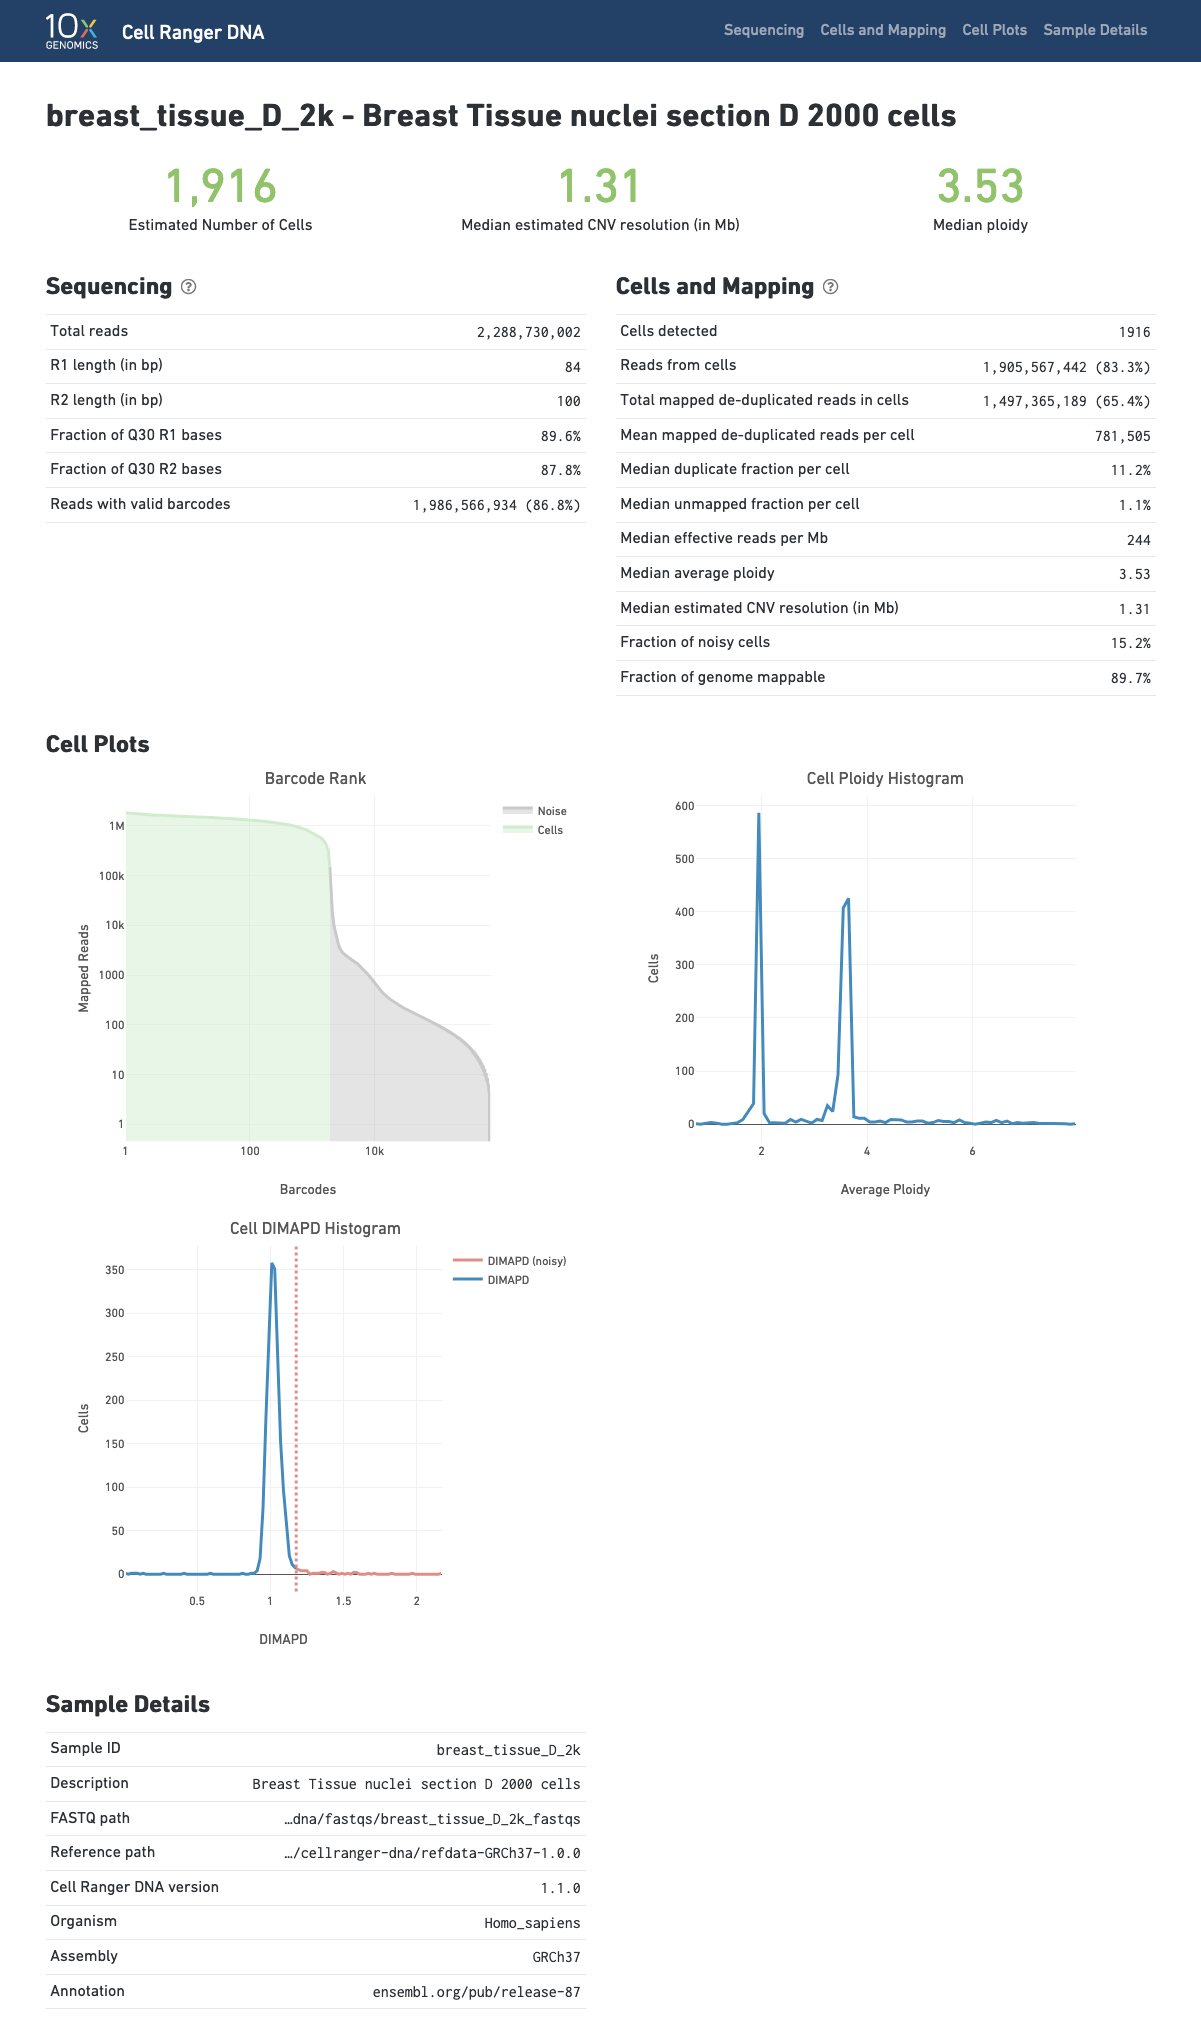
The cellranger-dna cnv pipeline outputs a HTML file containing a set of summary metrics that describe sequencing quality and various characteristics of the detected cells.
Click the '?' in the upper right corner of each dashboard for more information on each metric.
The Barcode Rank Plot shows the distribution of non-duplicate reads with mapping quality at least 30 per barcode and which barcodes were inferred to be associated with cells. The y-axis shows the value that cellranger-dna uses to call cells and the x-axis is the number of barcodes below that value. A steep drop-off is indicative of good separation between the cell-associated barcodes and the barcodes associated with empty partitions. The --force-cells option can be used to override the cell calling algorithm as explained here.
The Reads-per-cell histogram shows the coverage distribution of non-duplicate reads with mapping quality at least 30 per cell.
The Cell-Ploidy histogram shows at a glance the average ploidy per cell across the different cells in the population. When a normal diploid sample is run the vast majority of cells form a peak around ploidy 2.
The page also records the cellranger-dna cnv inputs: the FASTQ file path, the reference genome path and the software version, which serves as a sample tracking aid.