Cell Ranger DNA1.1, printed on 03/29/2025
| Analysis software for the 10x Genomics single cell DNA product is no longer supported. Raw data processing pipelines and visualization tools are available for download and can be used for analyzing legacy data from 10x Genomics kits in accordance with our end user licensing agreement without support. |
In most experiments, we see a handful of single cells with unique copy number events that are not seen in other cells in the sample. The figure below shows one such example of a single cell in the 1k Cells from BJ Fibroblast Euploid Cell Line dataset, cell 534, showing a copy number gain that is not seen in other cells.
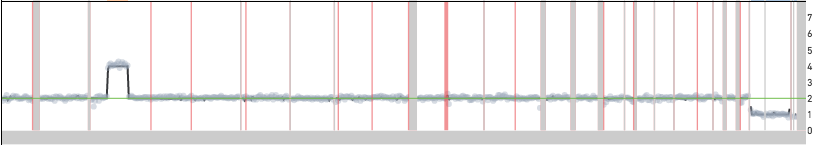
Such events could be a reflection of true biology in the input sample or due to technical artifacts of the library preparation workflow. It is difficult to differentiate between these possibilities when looking at a single cell, but when the same event is seen in multiple cells it is very likely to be a true CNV. If the event is truly present in a small fraction of cells in the sample, increasing the input cell count will increase the probability of seeing multiple cells with the same event. Along the same lines, if the same event is seen across multiple replicates it is likely due to a true copy number event and not a technical artifact.
We report the integer copy number across the genome for single cells and groups of cells. It is important to note that for a given cell it is possible that the true copy number state differs from the copy number state we report by an integer multiple. For example, a normal diploid cell in the G2 cell cycle phase that has duplicated its genome and is tetraploid can be called by the algorithms as a diploid cell. This is because in the absence of copy number variation, the algorithms assume that a cell with no events is diploid. Even in cells with significant copy number variation the scaling algorithm heuristically assumes that the least possible copy number state that fits the data is the most likely. For example, if a cell had copy number 6 on chromosome 1 and copy number 4 on all the remaining chromosomes, the algorithms would report copy number 3 on chromosome 1 and copy number 2 on the remaining chromosomes since that is the least possible integer copy number state that can explain the data. For such samples, you can run the pipeline and use the options --min-soft-avg-ploidy=M and --max-soft-avg-ploidy=N to try to force the scaling algorithm to give solutions with mean ploidy above and below M and N, respectively.
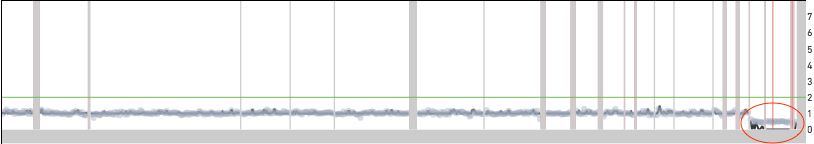
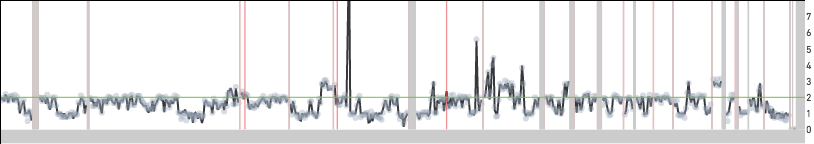
Excess noise in the read count data can also produce off by integer multiple errors. Shown below are two examples of cells where the copy number across the genome is underestimated by a factor of two. In both cases, the red ovals point to locations in the genome where the copy number estimate does not match the read count data. If both cells were to be scaled at twice the reported copy number, the segments in the red ovals would be at integer copy number levels. Cell 649 is a normal male diploid cell with one copy of the X and Y chromosomes. The scaling algorithm error results in all the chromosomes having half the true copy number. The X and Y chromosomes have copy number 0 because the copy number is forced to be an integer.
Cell 649 from the 1k Nuclei from BJ Fibroblast Euploid Cell Line dataset
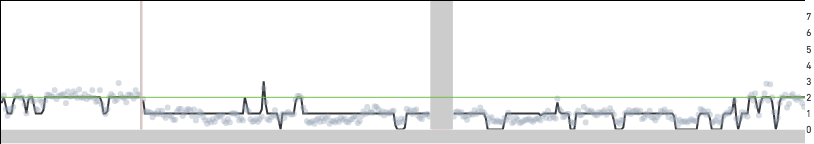
Cell 242 from the 5k MKN-45 Gastric Cancer Cell Line dataset
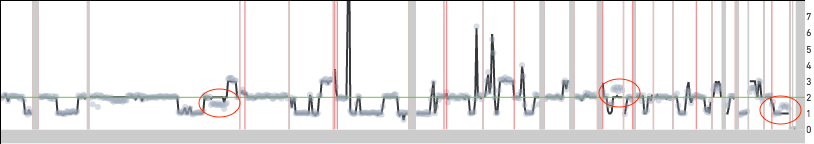
Cell 395 shown below is an example of a cell that is reported as having twice the copy number over most of the genome. Unlike the cells shown above the read data in this case lines up well with the copy number calls. Moreover, there are long segments of the genome with copy number 3 (odd) highlighted by the red ovals. If this cell were to be scaled similarly to the other MKN-45 cells, these segments would be at half-integer values. This cell has two copies of the MKN-45 genome and this could be a biological event or a cell doublet.
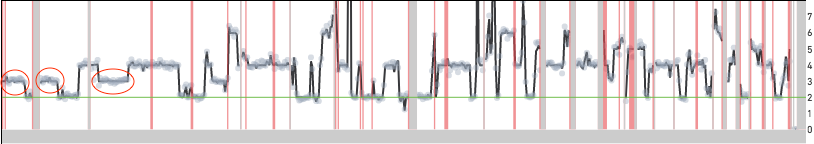
Replicating cells are some times scaled to half their true copy number. MKN-45 cells have an approximate mean copy number over the genome of 1.8 and this implies that a replicating MKN-45 cell should have mean copy number between 1.8 and 3.6 based on how much of the genome has been replicated. A cell in G2 phase that has finished replicating its genome completely is indistinguishable from a cell in G0/G1 phase. In both cases, cells would be scaled to an mean copy number of 1.8. Cells in S phase can sometimes be scaled to half their true copy number and cell 98 below is one such example with an average copy number of 1.6. However, the true mean copy number across the genome should be 3.2 and this is made clear in the zoomed in view of the bottom panel—the read data can be fitted to half-integer values.
Cell 98 from the 5k MKN-45 Gastric Cancer Cell Line dataset dataset is incorrectly scaled
Cell 98 zoomed in to region 3:174 Mb - 4:113 Mb
As discussed in the CSV pipeline outputs page, the per_cell_summary_metrics.csv labels cells as noisy or not, and the summary.csv provides the fraction of noisy cells in the sample. A cell could be deemed noisy due to the underlying biology: cells undergoing DNA replication or apoptosis, or due to degraded DNA in the input cell/nuclei suspension, or due to noise introduced by the workflow. A cell is defined as noisy if