Cell Ranger ATAC4.0, printed on 04/05/2025
Goal: To locate known cell types within the dataset.
Identifying cell types from known markers can be fast in Loupe Browser. This is done two ways, first through looking at quantitative accessibility, then by importing feature lists.
First, look at the t-SNE plot for this dataset. When looking at a PBMC sample, relatively clear clustering of common cell types are seen. Since every t-SNE plot is different, feature markers are used for orientation. Start by using promoter markers to find cellular types.
The Cell Ranger ATAC pipeline labels individual peaks as promoters for a particular gene if the peak falls 1000 bases upstream from a gene's transcription start site, or 100 bases downstream from a gene's transcription start site. A promoter sum for a given gene is the number of cut sites per cell that fall within all the peaks labeled as promoters for that gene. Higher promoter sum values indicate higher chromatin accessibility in the promoter region. Lower promoter sum values indicate lower accessibility in the promoter region.
Even though most cell type specific chromatin accessibility happens distal from promoters (a well known phenomenon that we observe in our data), we have found that promoter sums are sufficient to identify cell subtypes, as genes known to be upregulated in those subtypes will likely be more accessible at the promoter. Use B Cell and T Cell gene markers to test this.
First, select Accessibility mode from the Mode Selector. You see an Active Feature List. Type in the name of a gene, transcription factor motif, or even a peak genomic region into the search box. Begin by looking for B cells first. Type MS4A1 (CD20) into the search box to bring up the "MS4A1 Sum" feature.
Press Tab or Enter to add the promoter sum to the active feature list, and calculate cut site counts for that promoter across the dataset.
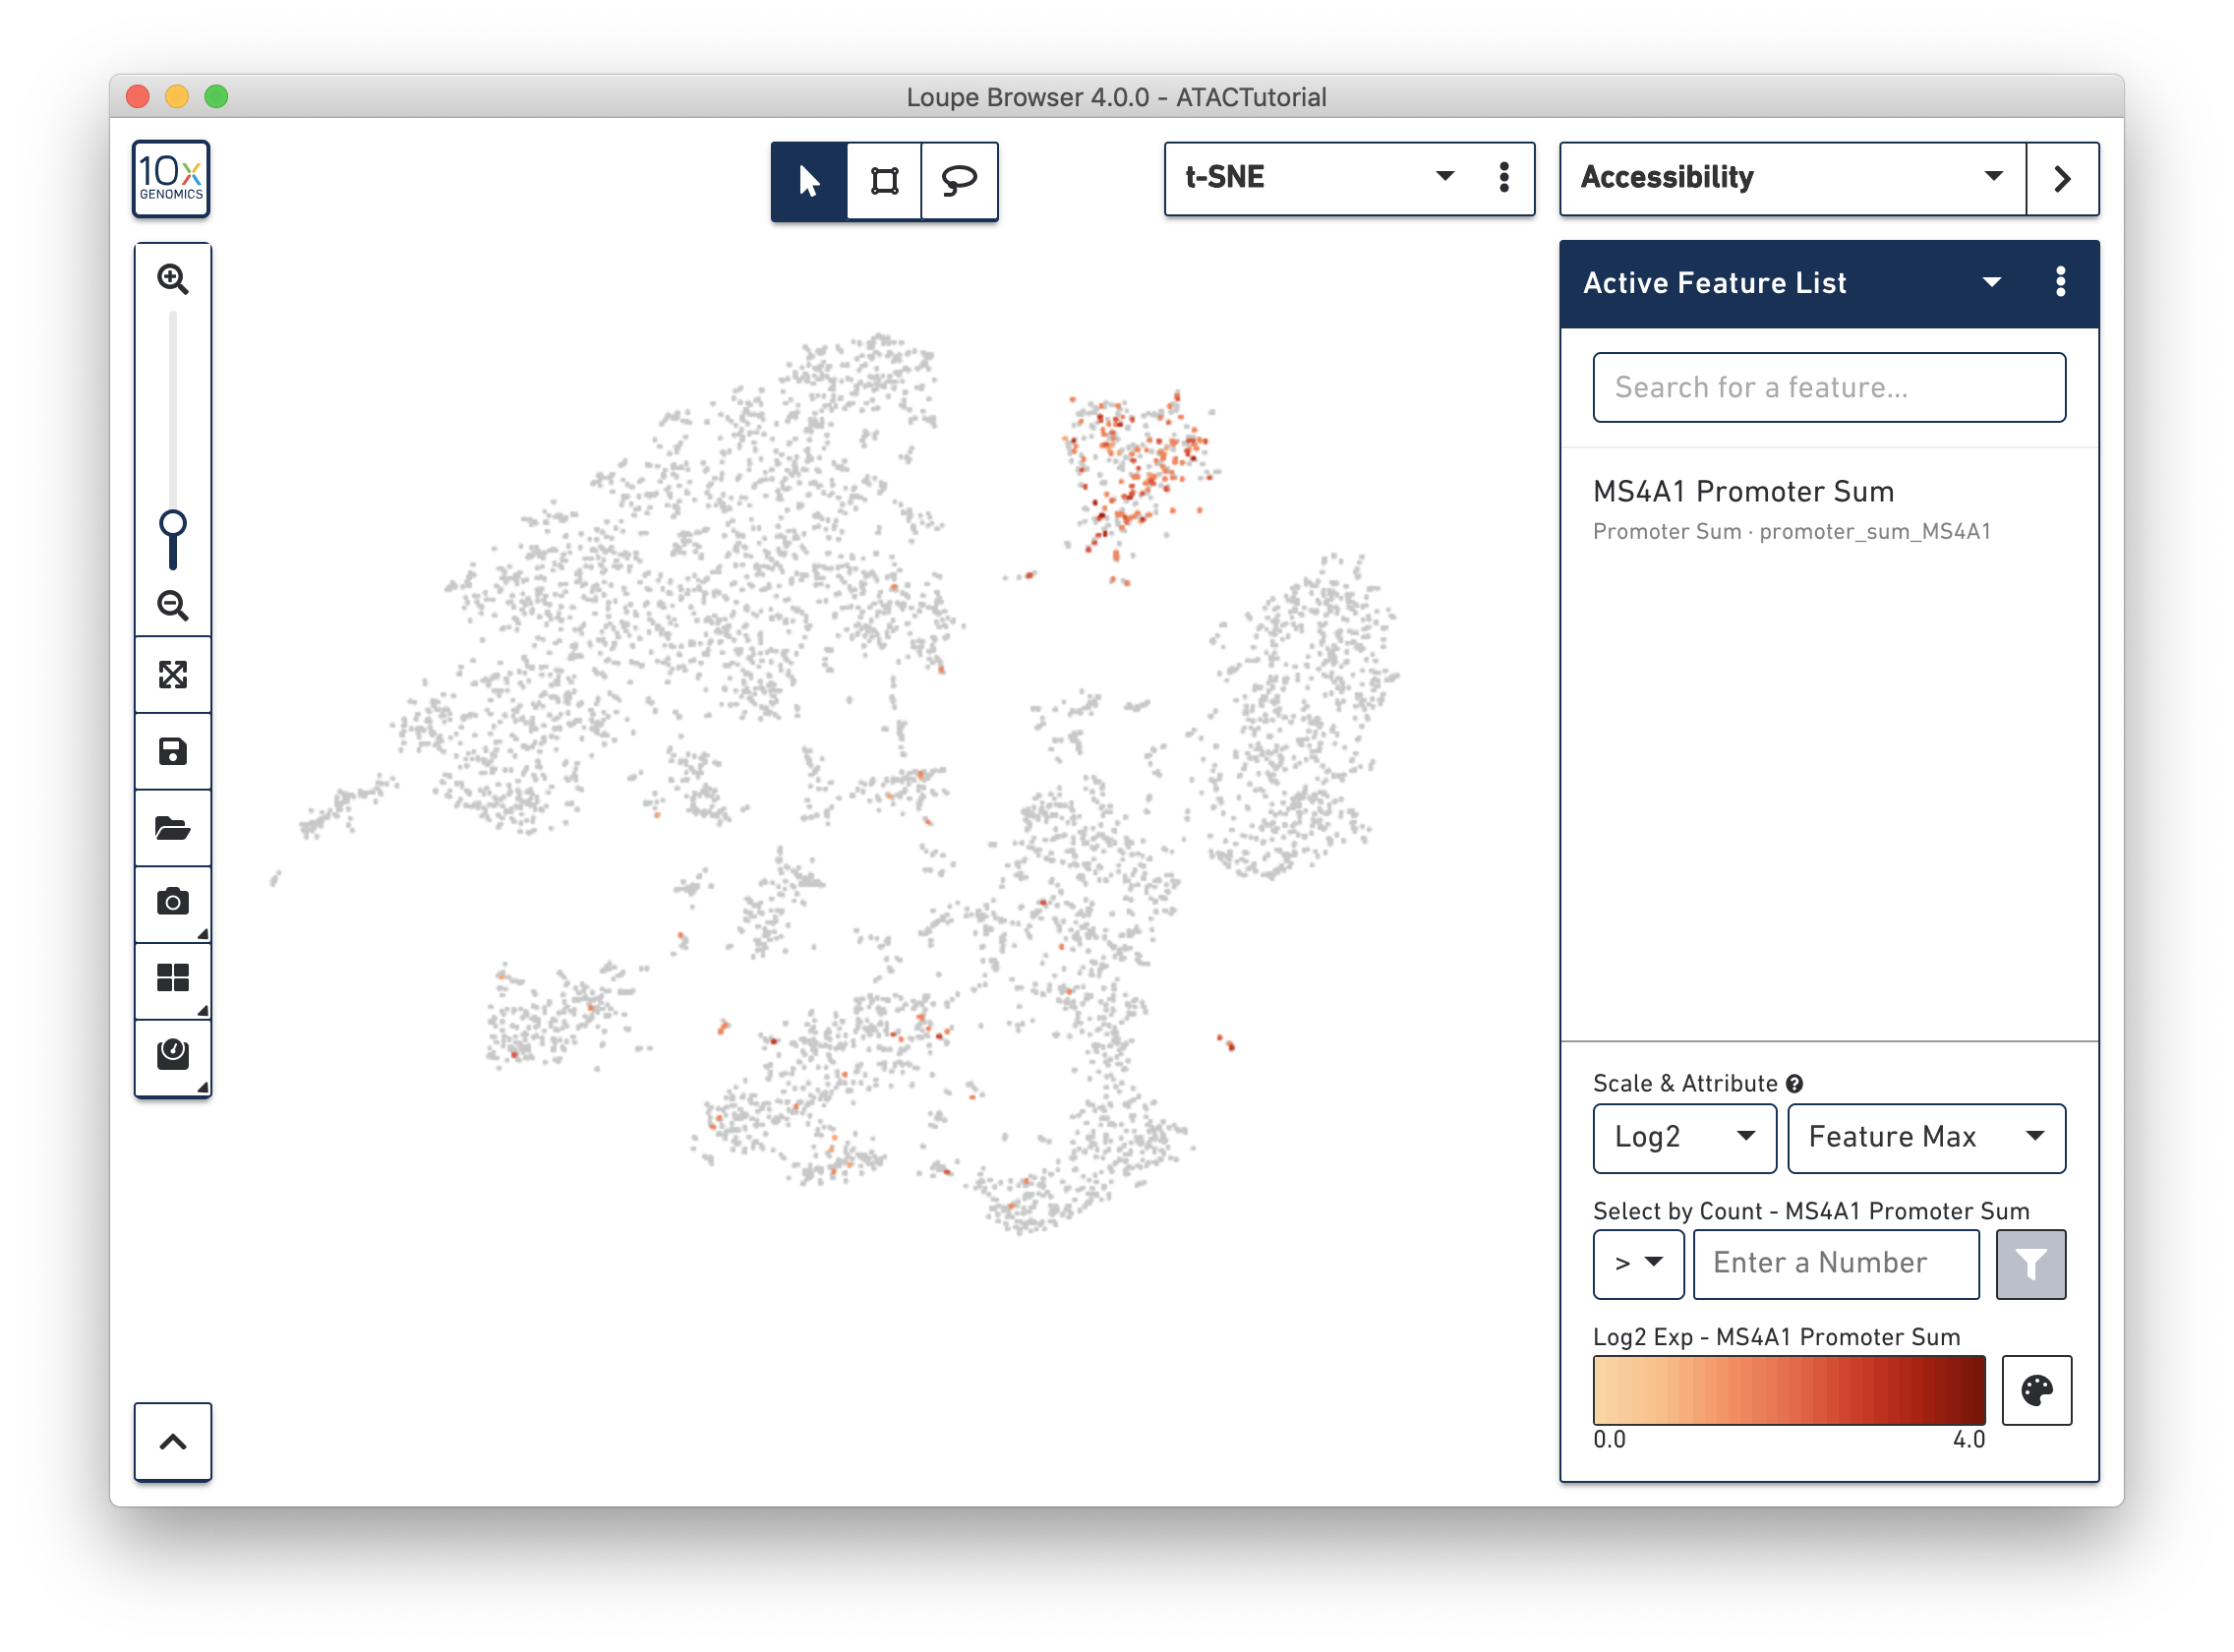
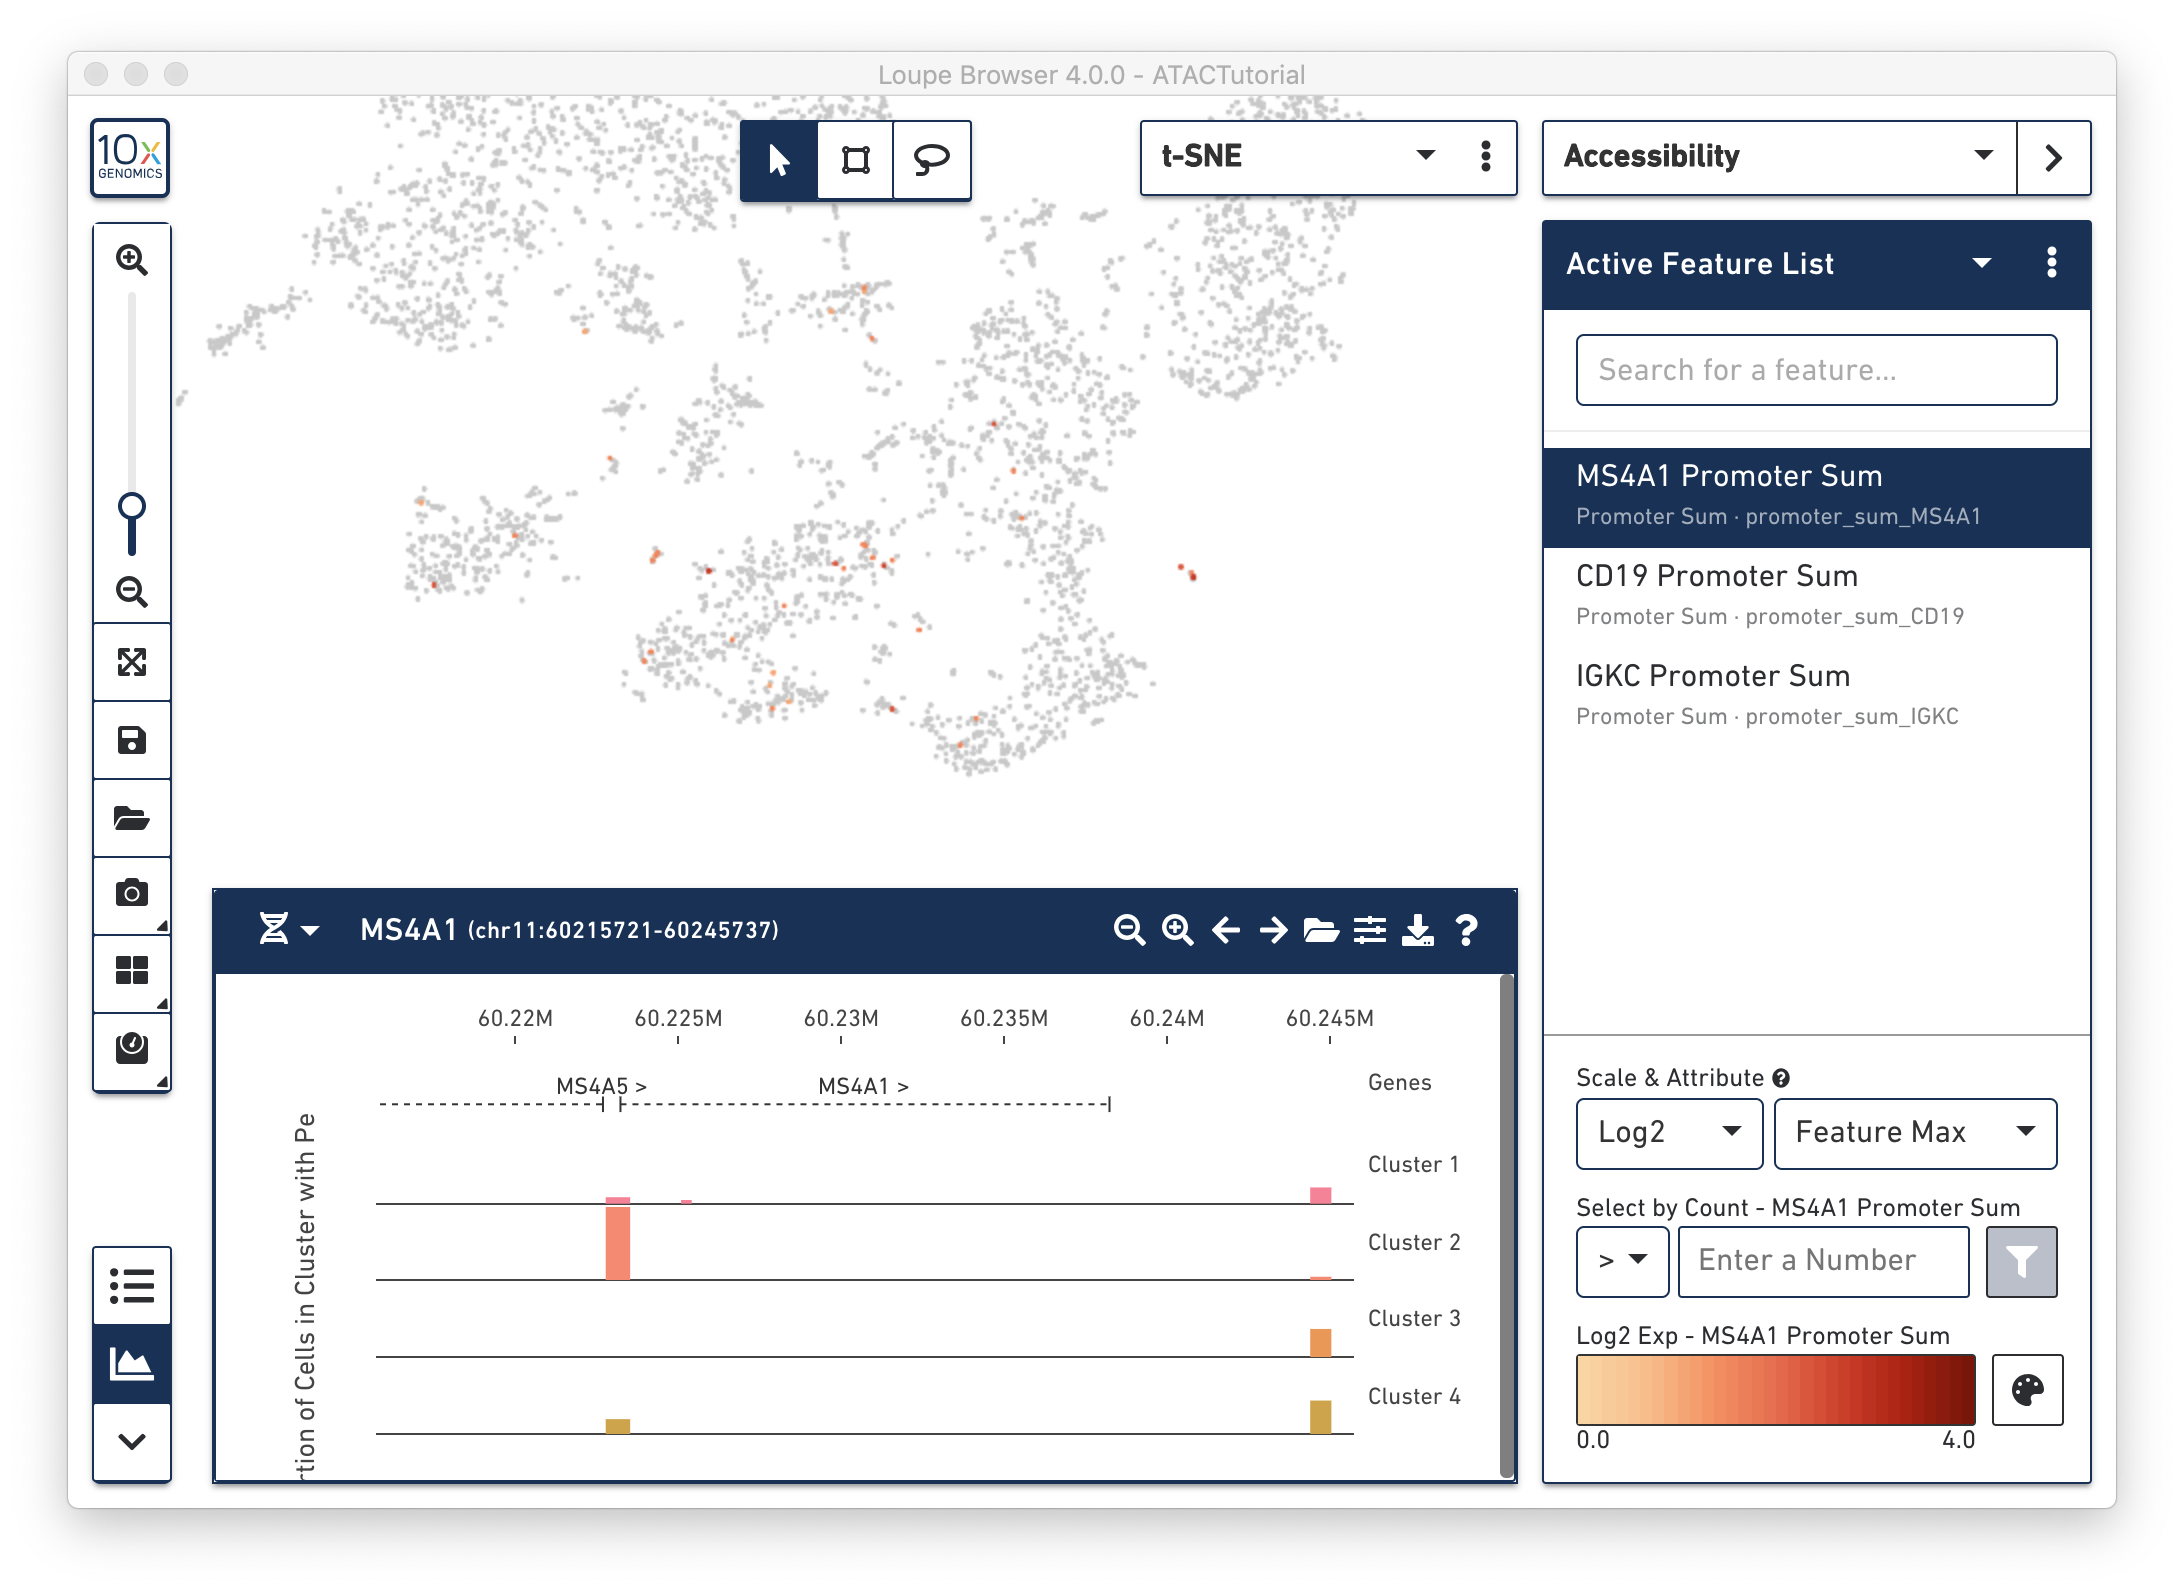
Right away, you should see that cells where the MS4A1 transcription start site was accessible are neatly packed into one of the t-SNE clusters. To confirm, you can try some other B Cell markers: CD19 and IGKC. It is clear that distinct region represents B cells.
As you add multiple features to a list, the coloring represents a combination of cut site counts per cell among all features in the list. With MS4A1, CD19 and IGKC in the list and 'Feature Max' as the selected attribute, the coloring of the plot reflects the maximum cut site count per cell among the selected features. Clicking on a single peak or promoter sum within a list shows the number of cut site counts per cell for that feature. Finally, hovering over a promoter sum or peak will reveal a graph and a trash icon; clicking the graph icon will highlight that feature in the peak viewer (see below), and clicking the trash icon will remove that feature from the current list.
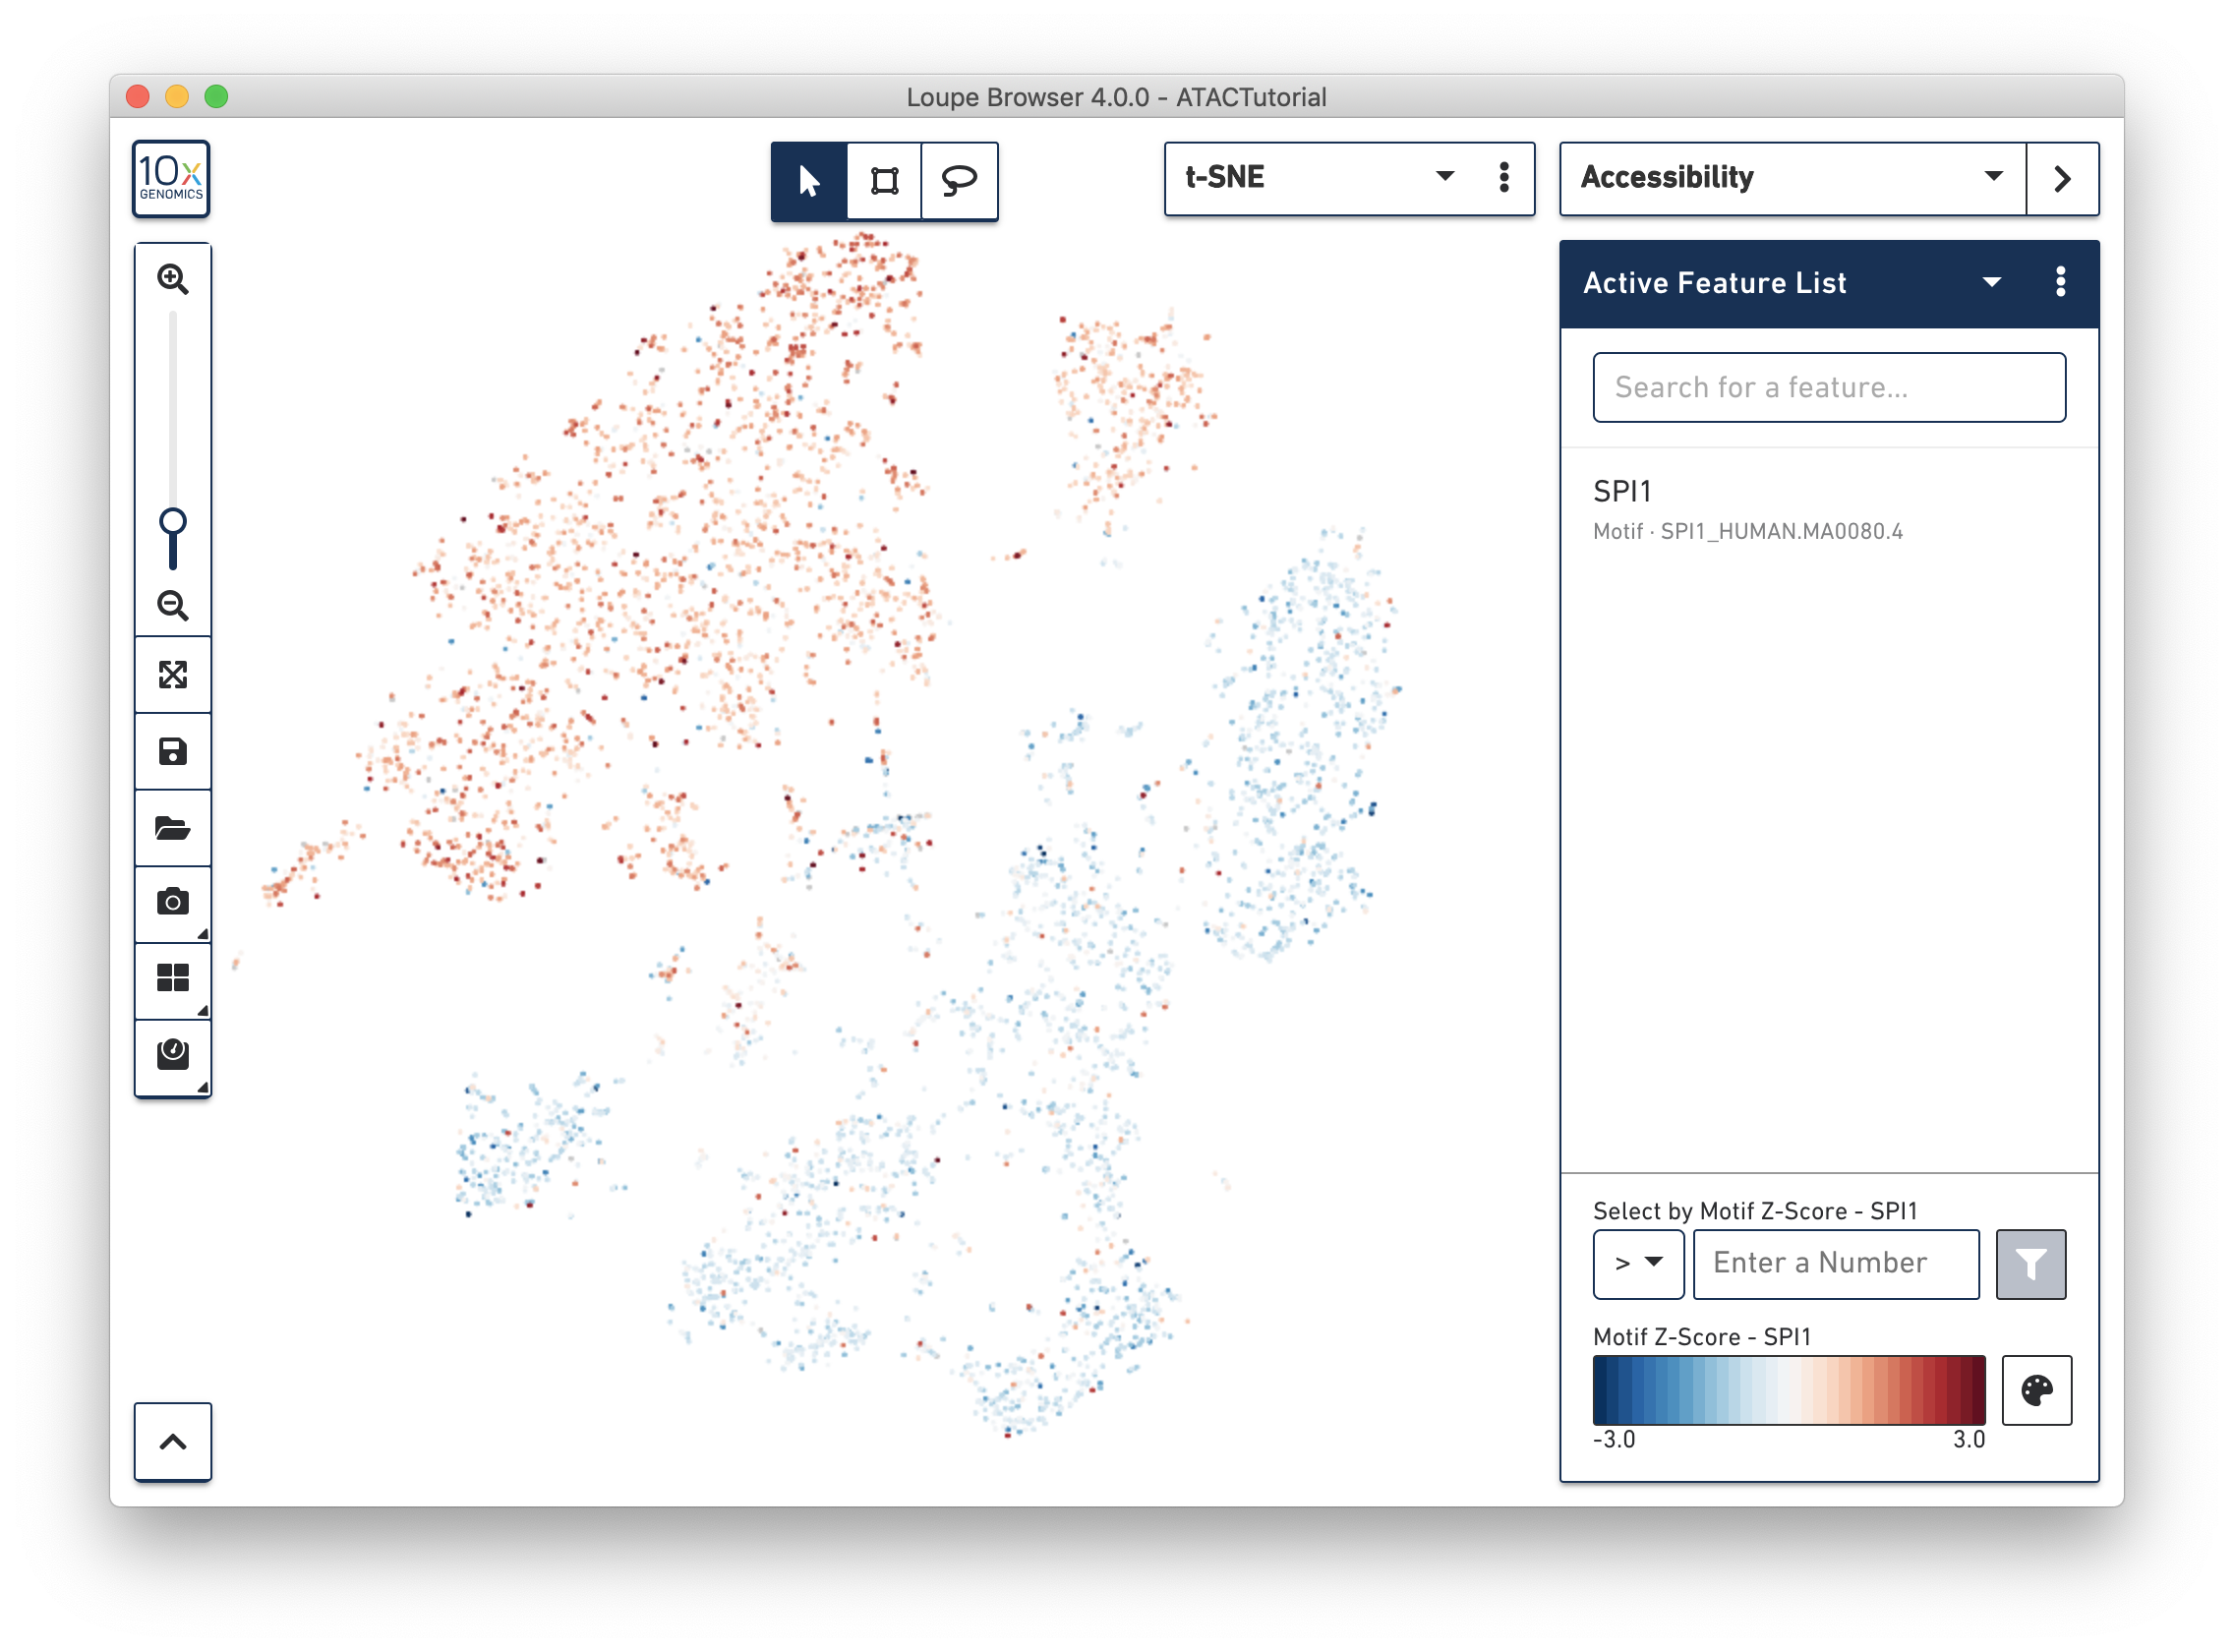
Transcription factor motif patterns may also yield insights about cell type. Motifs are different from peak and promoter sums. For each transcription factor motif, Cell Ranger computes a z-score for each barcode, which represents the relative accessibility of all peaks containing that motif within that cell, compared to the entire dataset. When selected, motif z-scores are displayed in the t-SNE plot, rather than absolute cut site counts. In addition, motifs may only be selected one at a time.
Let's reset the Active Feature List by clicking the trash icon for each feature currently in the list. Next, select SPI1 from the feature search box. The SPI1 (PU.1) transcription factor has been shown to play a key role in monocyte function [1]. Selecting SPI1 shows the cells with higher z-scores in red, indicating higher relative accessibility among all peaks that have the SPI1 motif. SPI1 also has a role in B Cell regulation; since we already identified the B Cell cluster through gene markers, it should follow that the large cluster at upper left are monocytes.
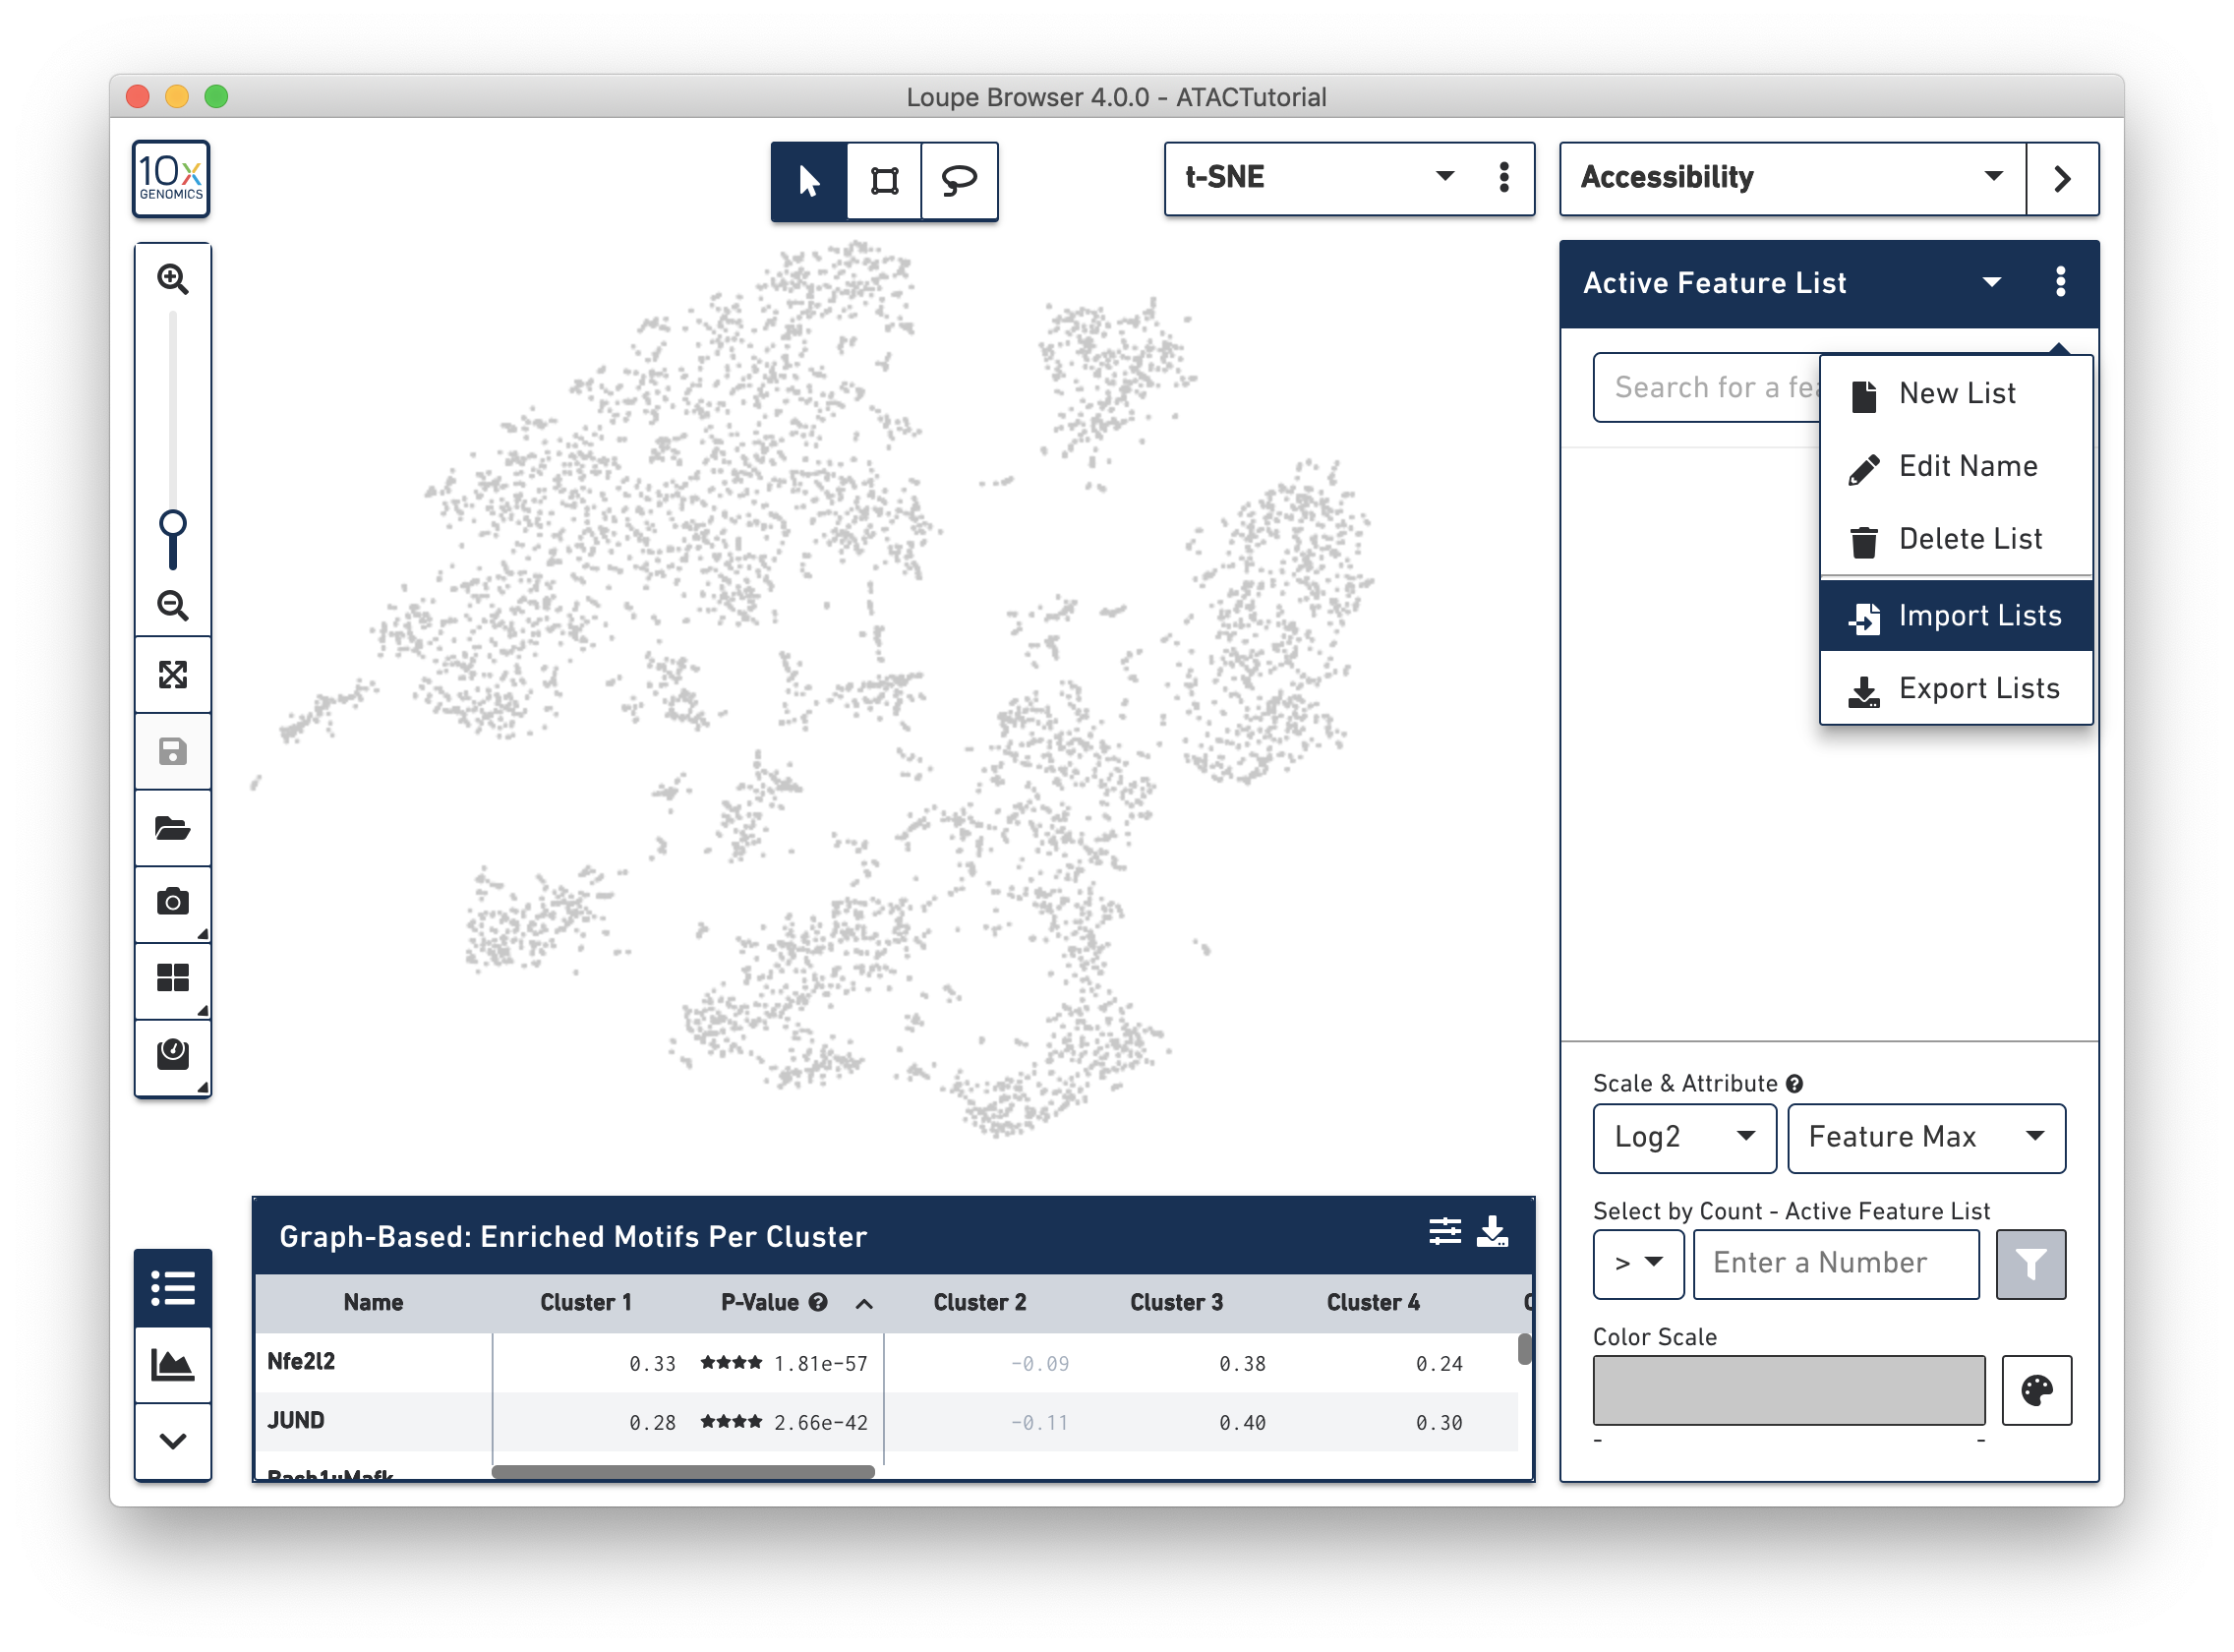
Another way to find cell subtypes is to import a csv file which contains markers for cell types of interest. You can download one such file here: ATACBloodCell.csv. After downloading, click on the three dots to the right of the current feature list, and select 'Import Lists' from the dropdown menu. Select the file you just downloaded. You can find more information about how to generate feature lists on the Interoperability page.
After import, you should now be able to select from one of five sets of markers by selecting from the feature list selector (click the toggle next to the current feature list).
You can use the feature list menu to create and export your own sets of markers, and rename and delete lists from your workspace. Choosing Export Lists from the feature menu will write all the currently active lists in your dataset to a CSV file, which you can import into other datasets.
Now that we've gotten our bearings in the dataset, we can save cell types for later. We can create new clusters corresponding to our cell types either by manual selection, or by quantitative filtering.
Let's first create a B Cell cluster. Select the rectangular lasso tool from the toolbox, and drag a box around the cluster we found through B Cell marker (MS4A1, CD19) accessibility:
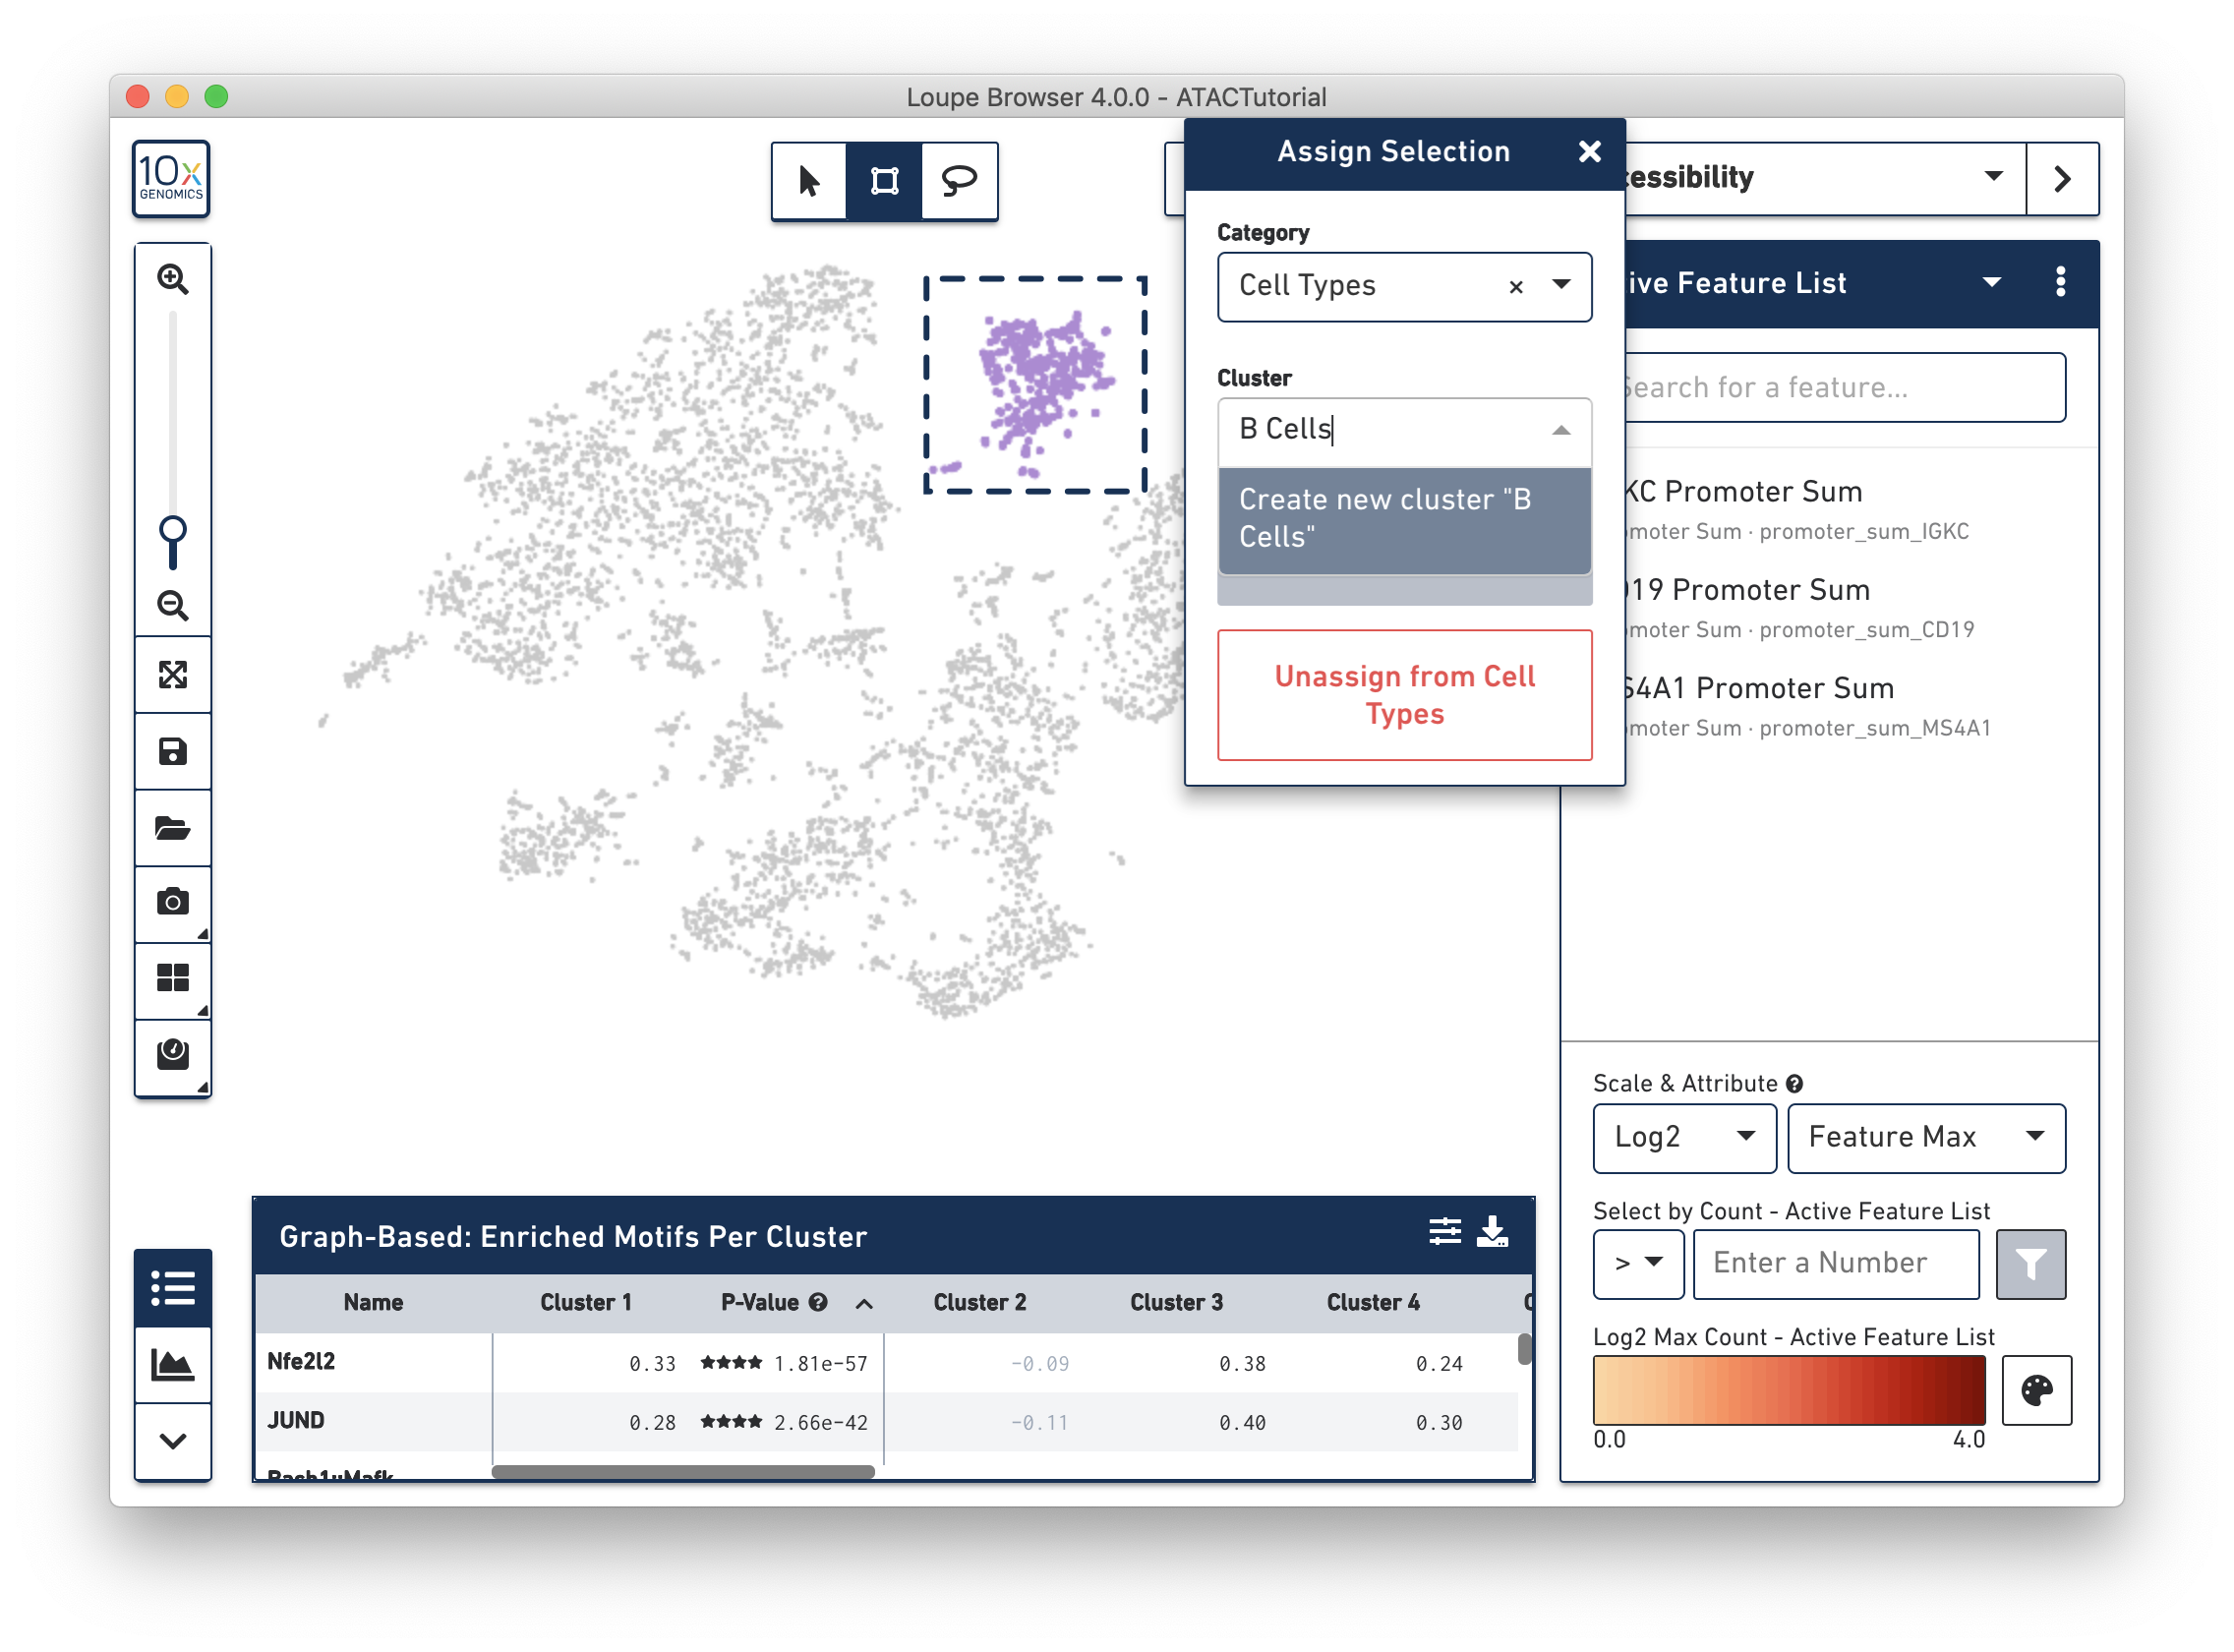
When you finish dragging, a dialog box appears, prompting you to type the name of a new or existing category, and a cluster name. Create a new "Cell Types" category, and call the cells "B Cells". Press the Save button, and a new Cell Types category appears.
Next, use the freehand lasso tool from the toolbox to draw an area around the monocytes, at the upper left of the t-SNE projection. Reuse the Cell Types category by typing it in the Category box, and create a new "Monocytes" cluster.
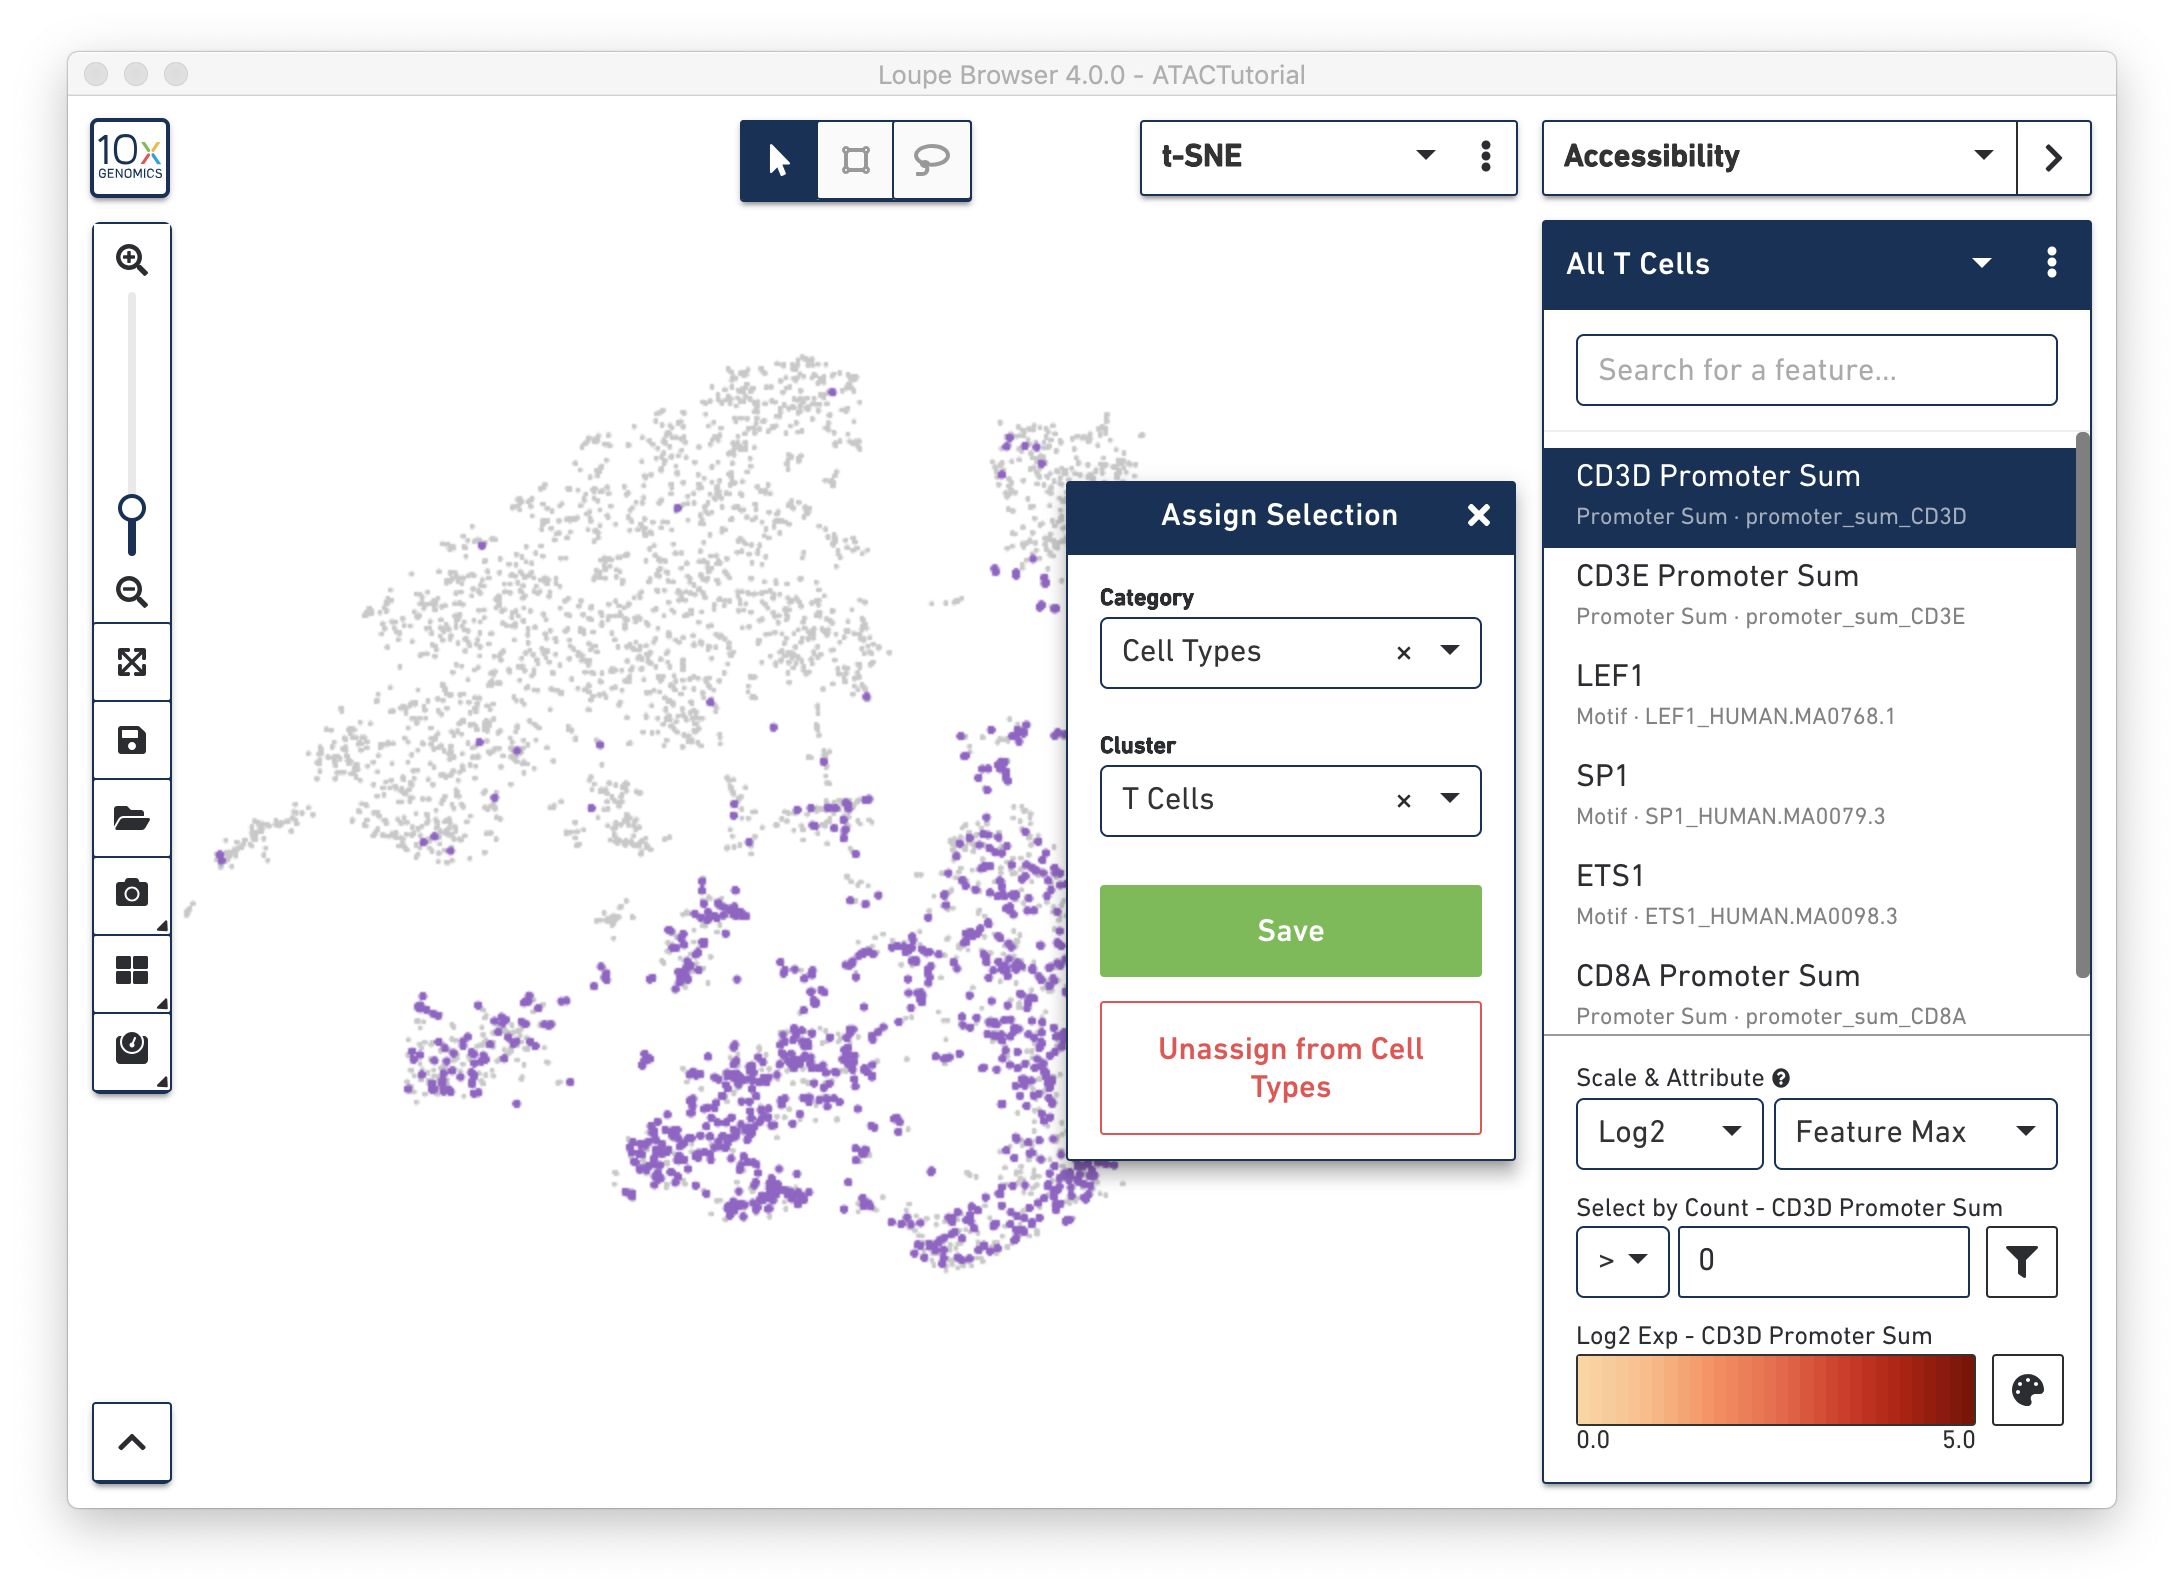
You may also create clusters quantitatively. Switch back to Accessibility mode, and select the All T Cells list that was just imported from ATACBloodCell.csv, or choose "CD3D Sum" from the feature search box. Click on the CD3D Sum feature in the list, and then find the input box under "Select by Count - CD3D Sum". Enter zero, and then press the filter button next to the input field. This will highlight every cell for which there was a fragment within a CD3D promoter peak, and bring up the cluster assignment box. Select "Cell Types" as the category, and add these cells to the "T Cells" cluster.
We'll stop here, but you can use additional genes and motifs of interest to further divide T cells into cytotoxic T cells, helper T cells, and memory T cells.
Before proceeding, save these cluster assignments by clicking on the Save icon in the toolbar. The ATAC Tutorial file bundled with Loupe Browser is read-only, so you are prompted to save a copy somewhere on your file system.
With feature markers and clusters saved, let's delve further into this ATAC data by filtering for specific cell subtypes using the Filters Panel.
[1] https://journals.plos.org/plosone/article?id=10.1371/journal.pone.0033474