Cell Ranger ATAC3.1, printed on 02/27/2025
NOTE: This section presumes you've created cell type clusters in the Identifying Cell Types tutorial section. You can also follow along roughly by opening the ATAC Tutorial dataset, and choosing the K-Medoids (LSA) Cluster, with K=4.
Let's use the Peak Viewer to look at differential accessibility between cell subtypes. Select the Peak Viewer (area chart) icon at the bottom left of the Loupe Cell Browser workspace. By default, you see the peak distribution for each cluster over the first five detected peaks. The peak distribution chart shows the location of called peaks in the genome, their widths, and the proportion of cells in each cluster that had an accessible region within one of those peaks.
For the ATAC Tutorial, the first five peak region isn't very interesting, so let's focus on a marker gene. At the top left of a peak viewer is a selector, which allows you to jump to a genomic region (e.g., "chr1:10244-753061") or a gene. Choose the Gene option from the selector, and then enter "CD33" in the adjacent input field. You should end up with a plot that looks like this:
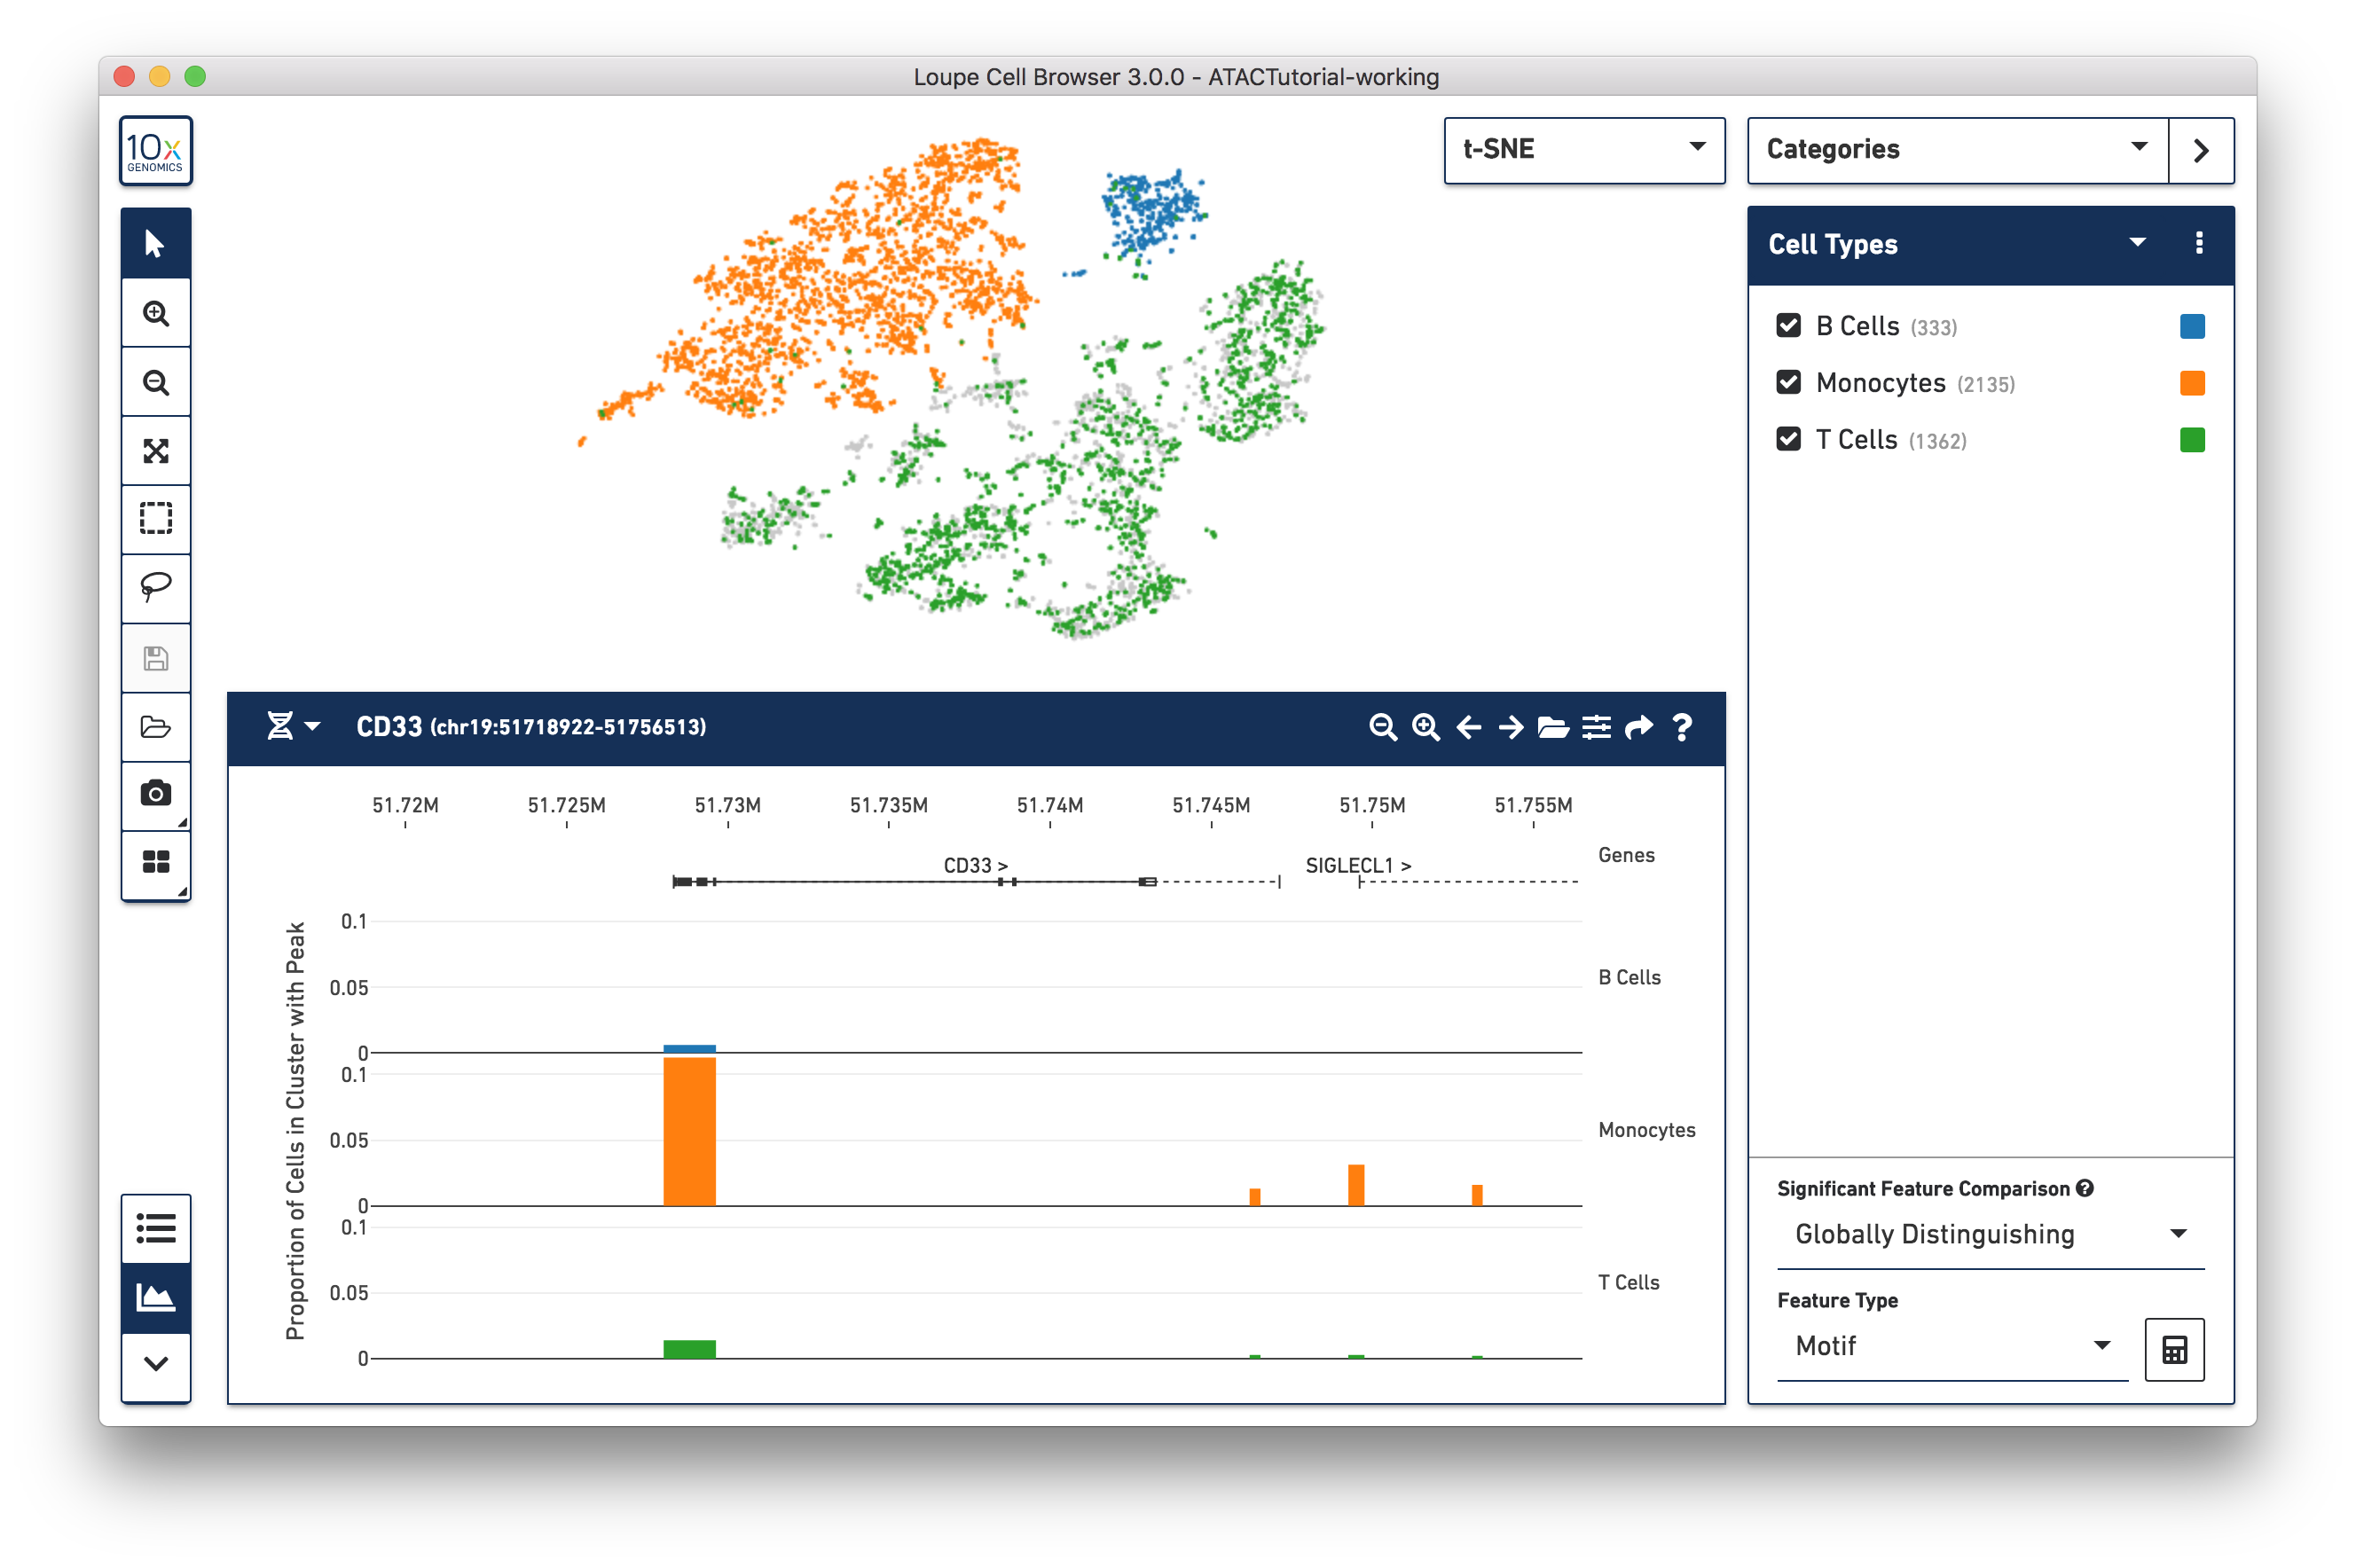
You can see a few things here. First, by navigating to a single gene, the visible genomic region is now small enough to show gene and transcript annotations. Gene boundaries appear as dashed lines, transcripts as solid lines, exons as solid rectangles, and UTRs as open rectangles.
NOTE: Only one transcript is shown per gene. For more information, see Peak Viewer Details. The CD33 gene boundaries are clearly visible in the center of the peak viewer.
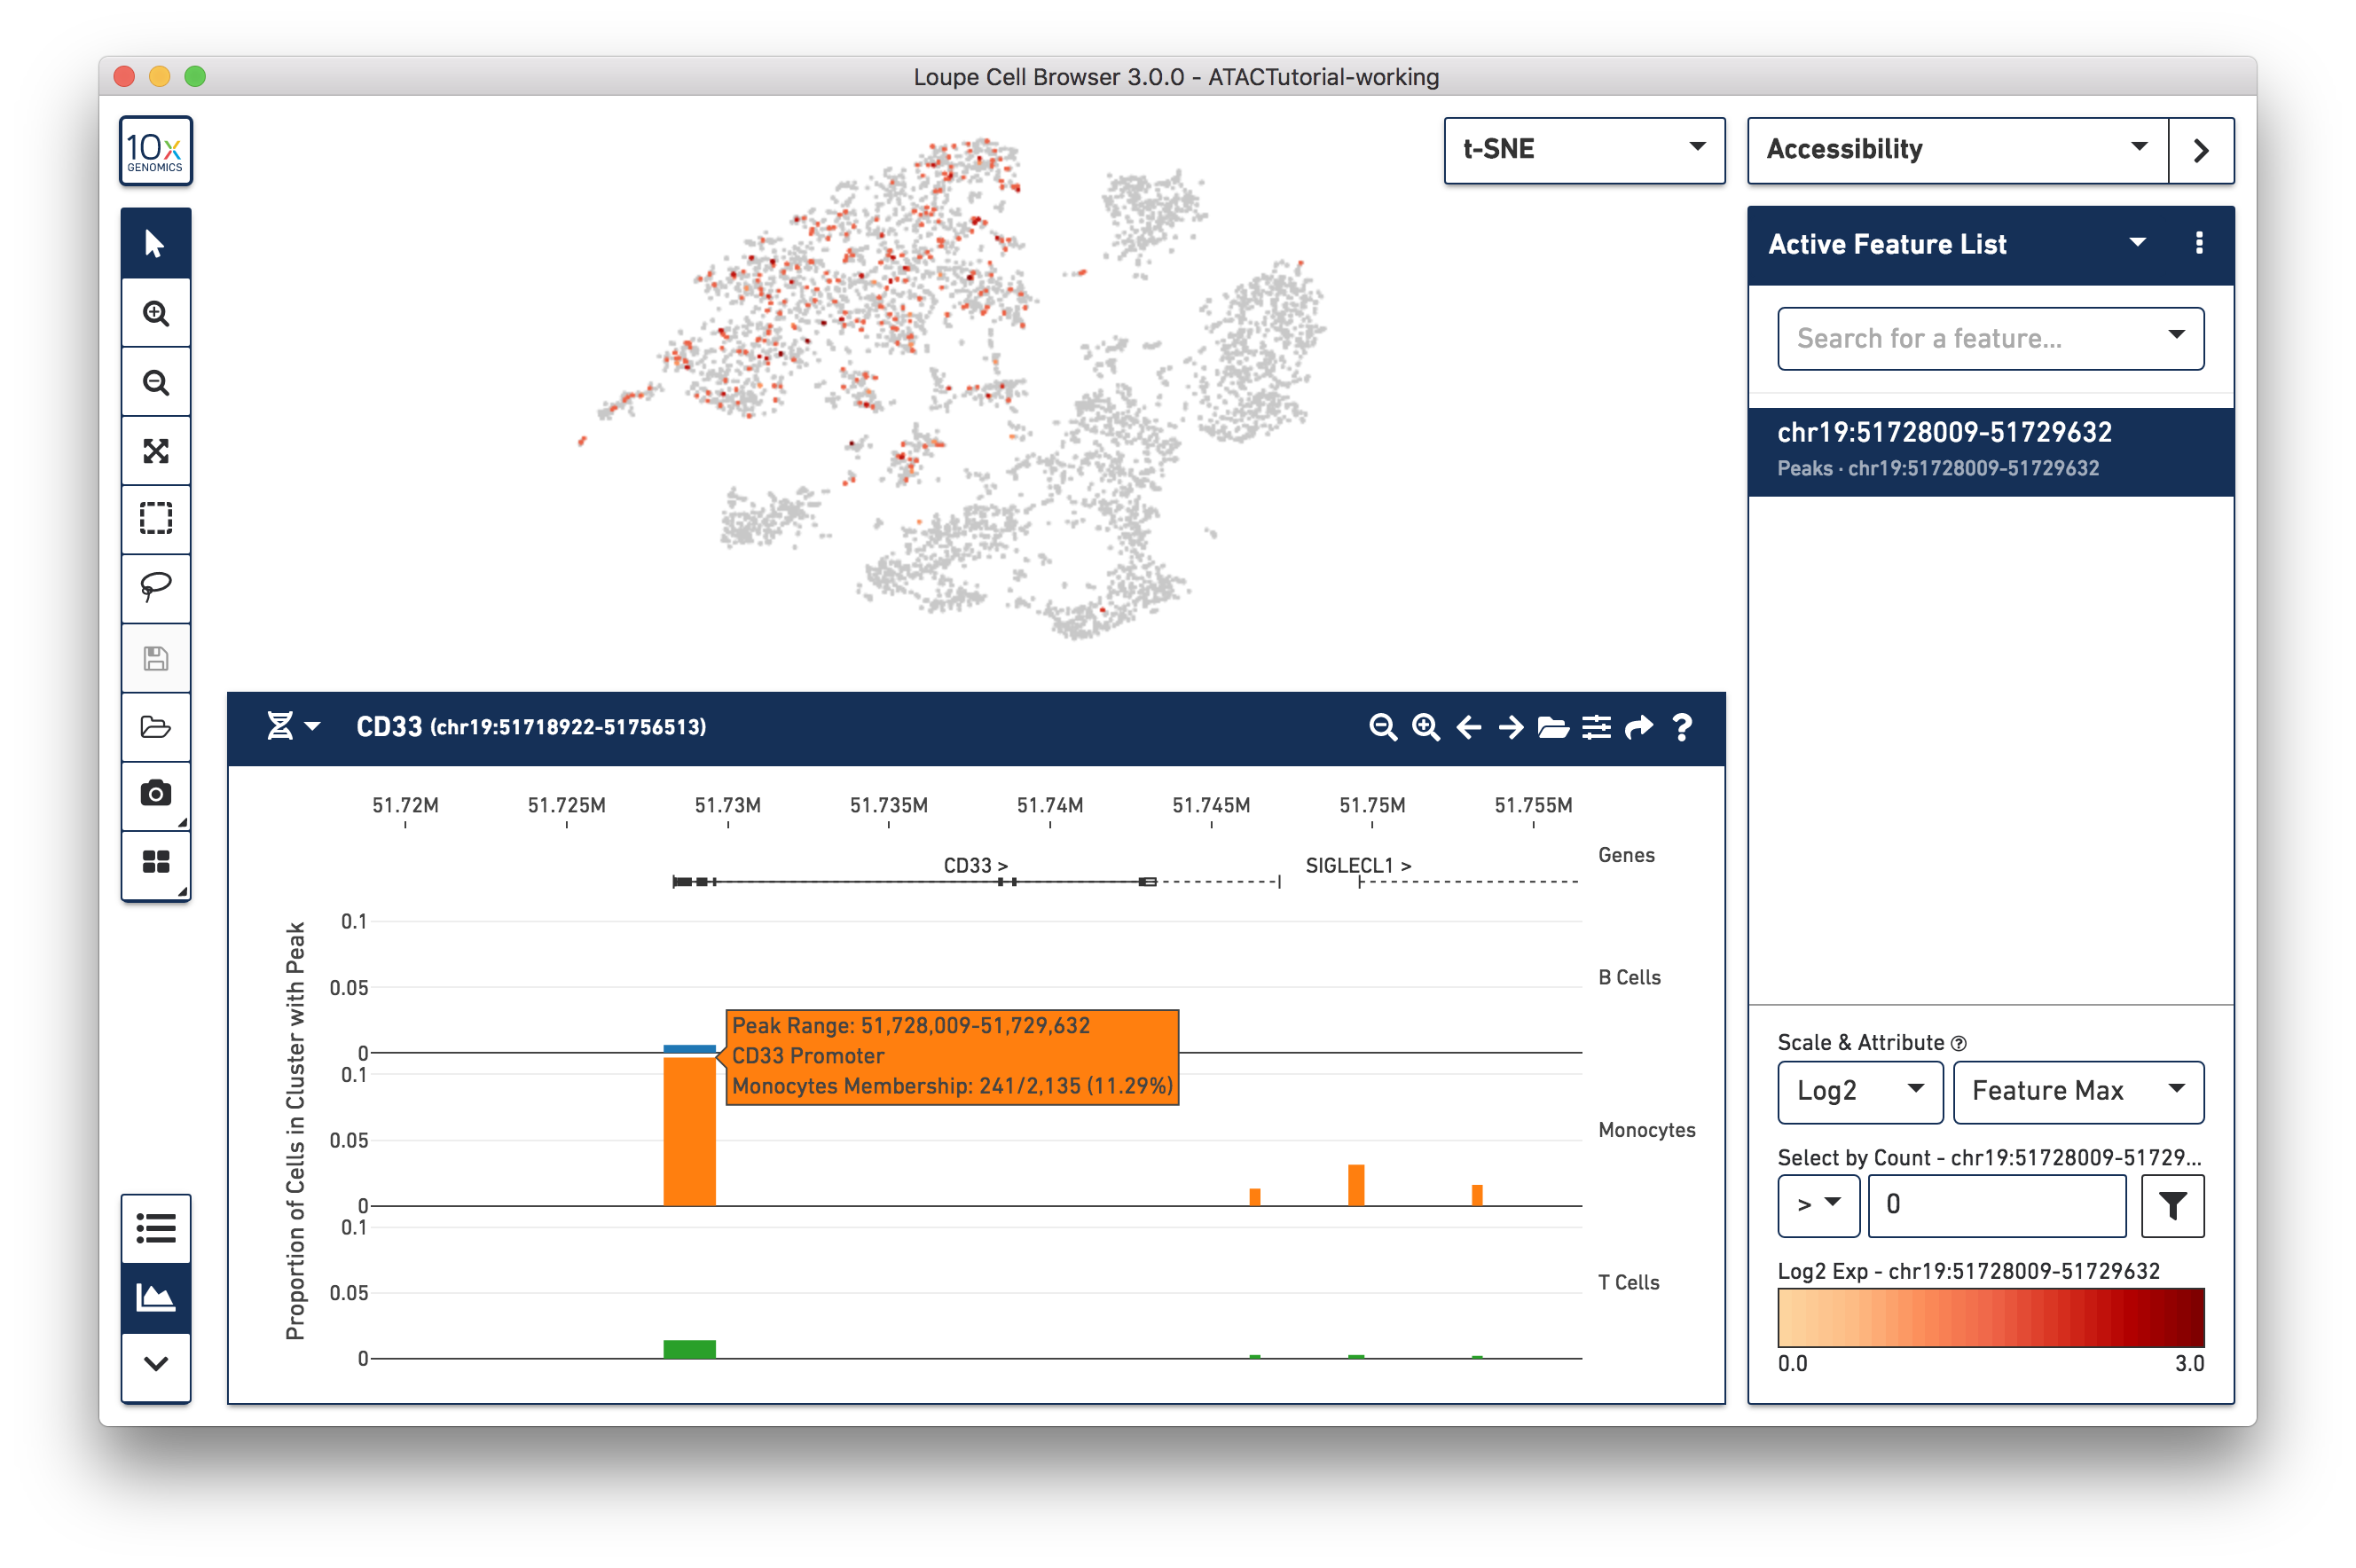
Next, you can see the difference in accessibility between the clusters. Consider the peak at the beginning of the CD33 transcript. It is clear that a higher percentage of monocytes had open chromatin at that peak than other groups. You can see a precise percentage as well as other information about the peak by moving the mouse over it. Clicking on a peak also shows the cells with open chromatin at that region within the barcode plot, as shown below.
The default view shows the relative accessibility of the genome at an aggregate
level, but you can inspect accessibility at a finer-grained resolution by
loading the fragments.tsv.gz that is generated by the Cell Ranger ATAC pipeline.
Fragment files can be loaded via the file system, or via URL. The ATACTutorial
fragments file is accessible at
https://cf.10xgenomics.com/supp/cell-exp/ATACTutorial-fragments.tsv.gz. Click
the folder icon in the peak viewer menu bar, and copy the above URL into the
input field. After a few seconds, you should see a plot similar to the one
below:
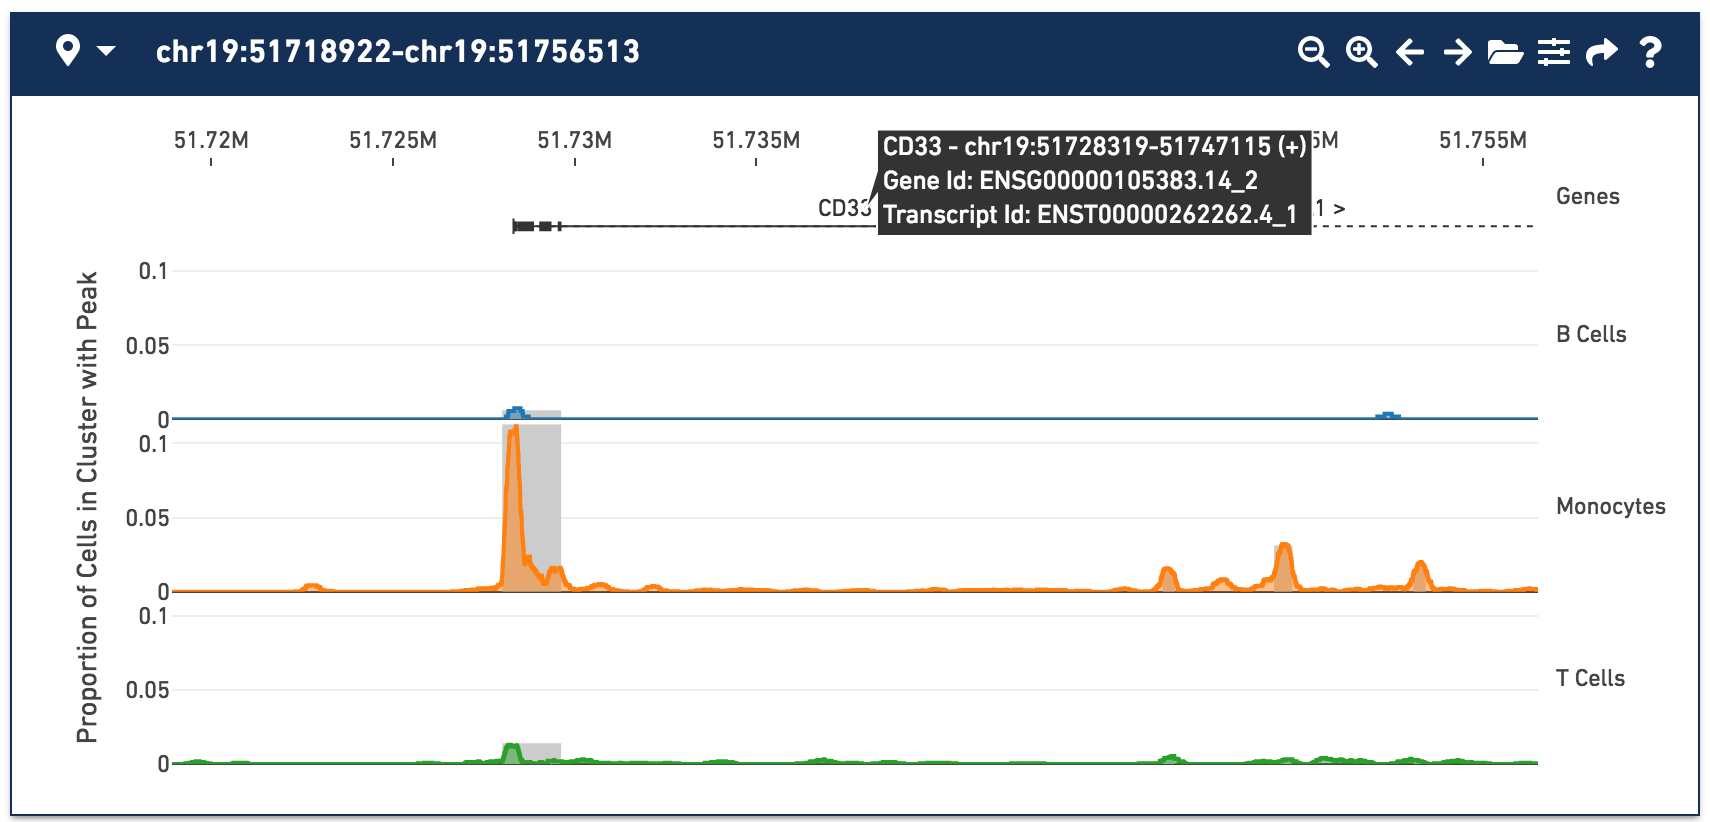
With the fragments file loaded, you can see cut site tracks for each cell type. Cut site tracks approximate chromatin accessibility at each position in the genome, for every cluster, using the information stored in the fragments file. The highest peaks indicate where there were local maxima in detected fragments, indicating regions that were more generally accessible within that cell type. You can now clearly see a peak within the monocytes around the CD33 transcription start site, with a smaller secondary peak slightly downstream.
For more information about how cut site track values are computed, see Understanding Cut Site Tracks.
By default, cut site tracks are computed by taking 400-base wide rolling window sums over all cut sites in a cluster. You can control the window size and other display options by clicking on the Peak Viewer Options icon to the right of the folder icon. Selecting narrower windows may show more detailed accessibility patterns, but can be noisier. You can also change the appearance of the peak viewer through the Peak Viewer Options menu.
For a more exhaustive list of features and detailed explanations about the data behind the Peak Viewer, see the Peak Viewer Details page.
Now that we have created cell type clusters and analyzed differential accessibility with the peak viewer, let's look for more subtle differences in our data, by looking for Significant Features.