Cell Ranger ATAC3.0, printed on 04/05/2025
The Peak Viewer panel provides the tools to look at differential chromatin accessibility across
genomic regions of interest. It combines two visualizations. The peak distribution chart shows
the sizes of called peaks, and the relative number of cells per cluster within those
peaks. The Peak Viewer also displays cut site tracks, which uses the fragments.tar.gz file generated
by the Cell Ranger ATAC pipeline to show a finer-grained picture of chromatin accessibility on a
base-by-base level. The peak viewer is exclusive to ATAC data, and is activated by clicking on
the graph icon to the left of the bottom data panel.
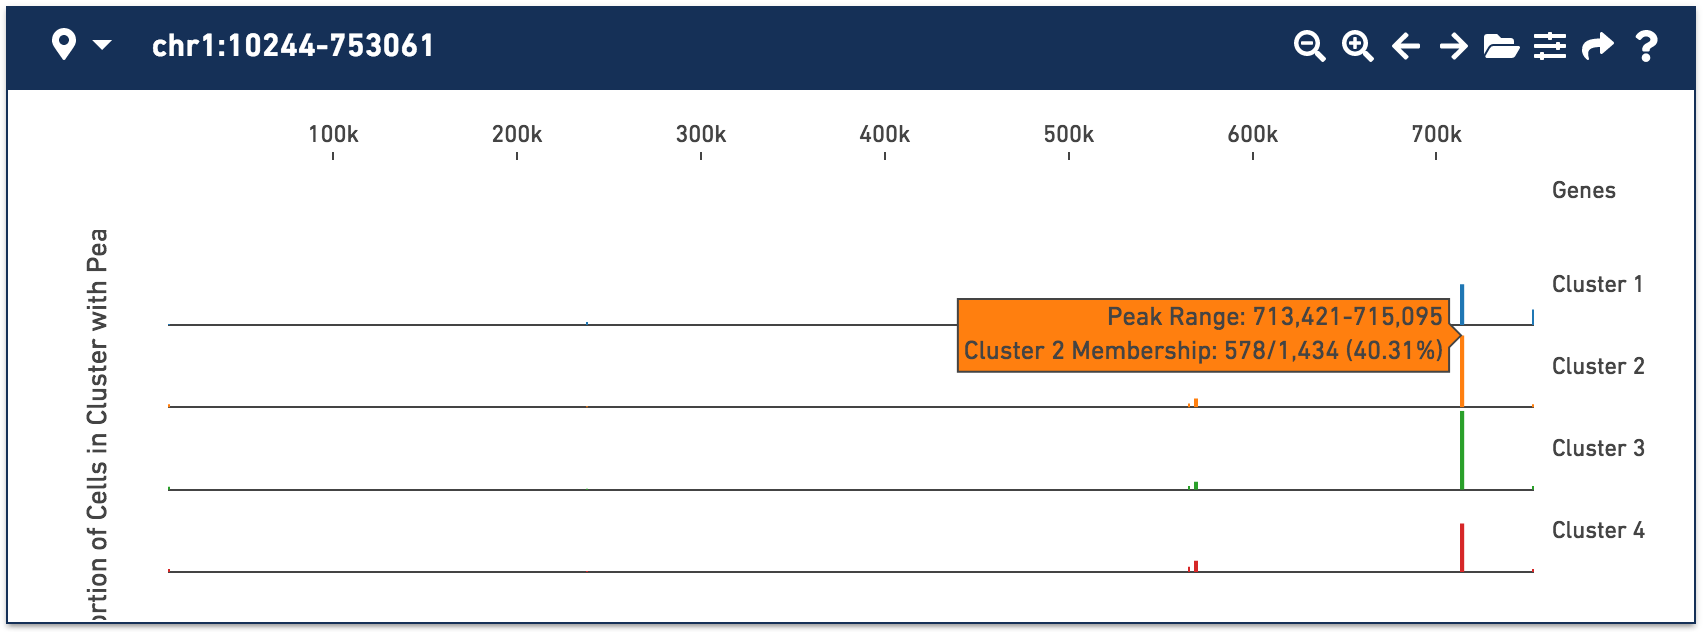
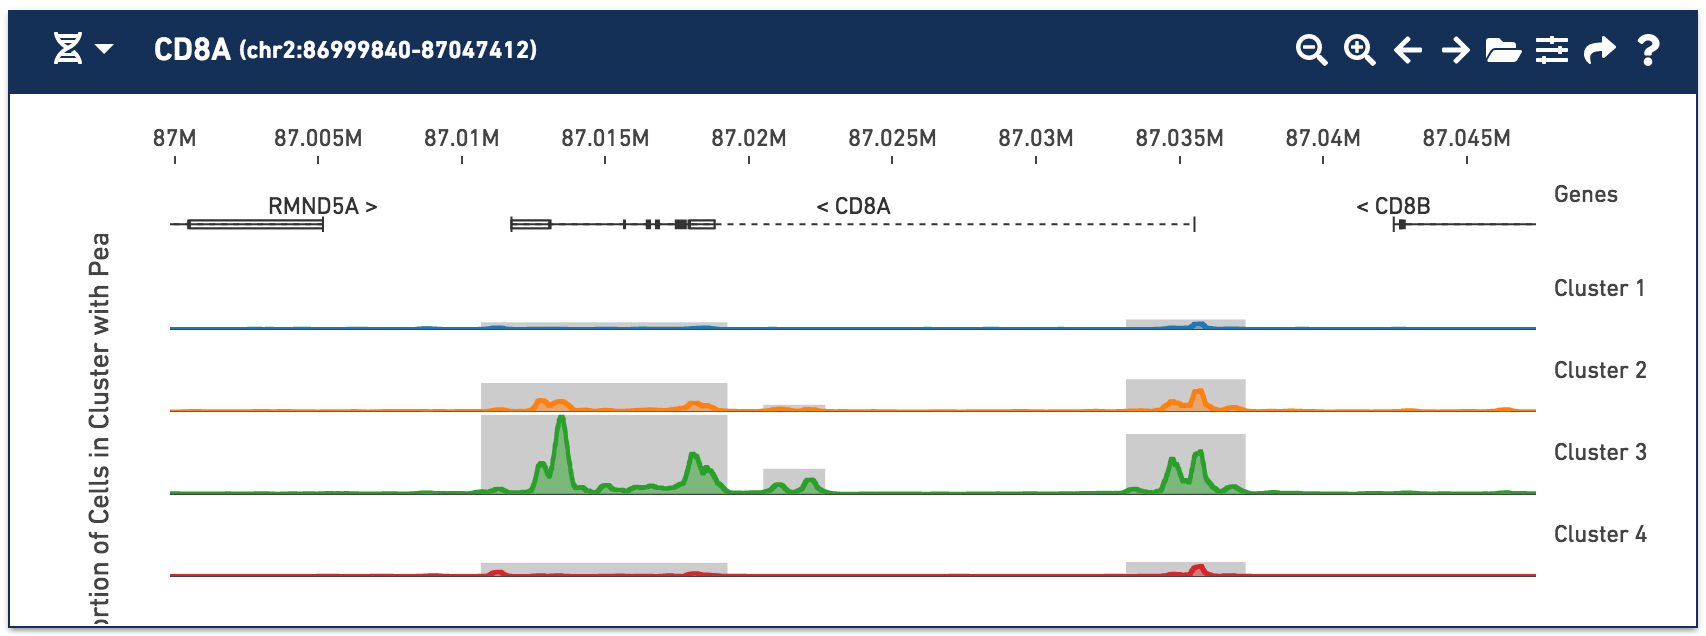
When loading a file for the first time, the Peak Viewer shows the peak distribution chart, with first five called peaks in the dataset. You can see the currently selected range in the top left of the Peak Viewer, ticks at the top of the panel to show genomic position, and a track of peak distributions per cluster. Called peaks appear as rectangles of varying width and height. The height of each peak is proportional to the number of cells within that cluster that had cut sites falling within the called peak. You can also hover over each peak to identify the location of the peak, and the number of cells per cluster with a fragment within this peak. Clicking on a peak highlights the cells in the barcode plot where that region was accessible.
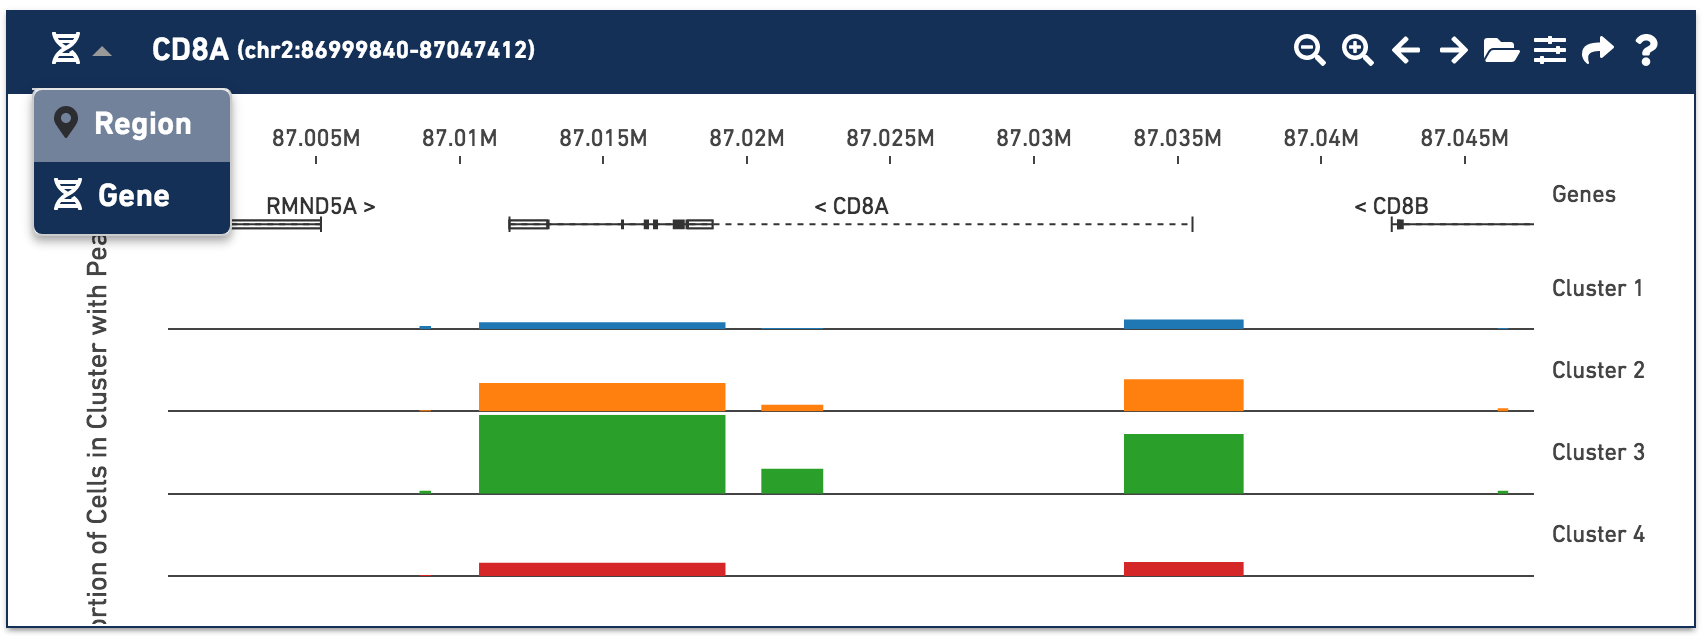
There are a variety of ways to navigate through the genome to look at regions of interest. At the top left, there is a field to enter either a set of genomic coordinates, or a gene. Use the region selector at the top left to toggle between entering a region such as "chr2:86,999,840-87,047,412", or to enter by a gene, such as "CD8A".
In addition, the first four buttons on the Peak Viewer's menu bar allow you to pan left and right, and to zoom in and out. Finally, you can drag over a particular region to zoom in more rapidly.
The viewer supports a maximum genomic interval size of 10Mb.
While peak distribution information comes preloaded in a .cloupe file, information about
individual fragments, which drive the cut site tracks, are stored in another file generated by the
Cell Ranger ATAC pipeline, the fragments.tsv.gz file. This file is bundled separately from the
.cloupe file, as it usually takes up much more disk space. You can add the fragments file to
the working session by clicking the folder icon on the Peak Viewer menu bar.
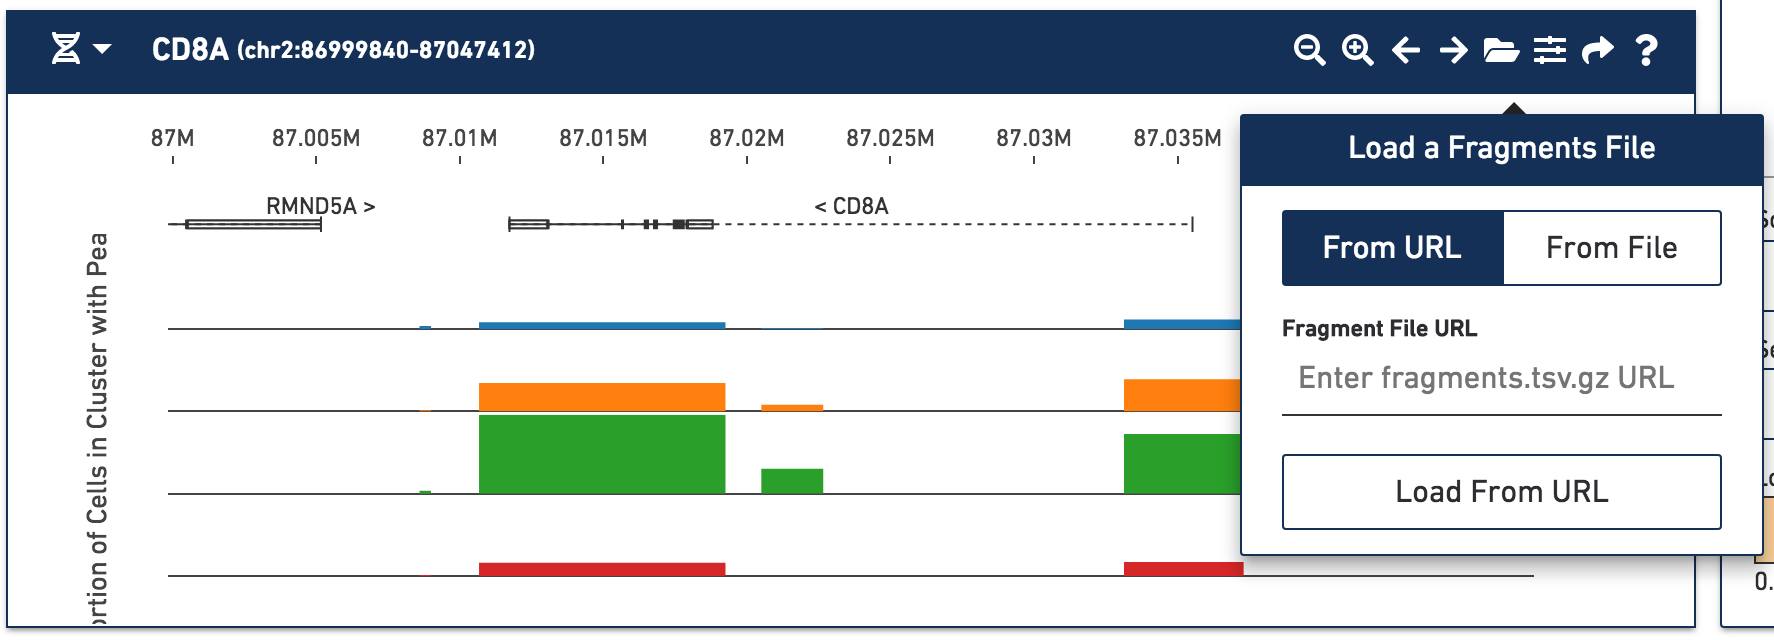
There are two options for attaching fragments files. If Cell Ranger ATAC outputs are available from
behind a web server, you can specify the URL when the From URL tab is highlighted. For example,
the URL of the ATACTutorial dataset's fragments.tsv.gz file is
https://cf.10xgenomics.com/supp/cell-atac/ATACTutorial-fragments.tsv.gz.
Choosing the From File tab and clicking the Load From File button brings up your operating
system's file chooser, allowing you to navigate to select the appropriate fragments.tsv.gz
file. If you provide an invalid URL, or the fragments.tsv.gz file selected is from a different
dataset, you'll see a simple error message. If the association is successful, you'll see cut
site tracks atop the peak distribution, and the peak distribution bars turn gray.
Shortcut: If you are loading the .cloupe file directly from a Cell Ranger ATAC outs folder, then
Loupe Cell Browser automatically detects the corresponding fragments file. If this is the case,
you see both the peak distribution chart and cut site tracks in the peak viewer when first
loading a file.
With the fragments file loaded, you can look at chromatin accessibility at base-level resolution
by analyzing cut site tracks. Cut site tracks are generated by analyzing all of the fragments
detected within the current viewing window from the fragments.tsv.gz file. Each read fragment
called and validated by the Cell Ranger ATAC pipeline has two cut sites including the start position of the
fragment and the end position of the fragment. These are the locations where the ATAC enzyme
attached to open chromatin. For each cut site, the Peak Viewer imputes an open region, where the
chromatin is presumed to be accessible. By default, the open window is 400 bases wide and centered
around the cut site, though this is configurable (see Peak Viewer Options below). Finally, the cut
site track is generated by computing a rolling sum over these open windows, akin to read pileups.
In this manner, regions with highest accessibility should have the highest number of nearby cut
sites nearby, highest number of nearby open windows, and thus the highest rolling sum within the
cut site track.
By default, the heights of the cut site tracks are normalized by the number of cells in each cluster, to highlight differences in accessibility between individual clusters. In this manner, the cut site tracks are measures of average accessibility of a particular base for each cell in the cluster. You can also change this setting in the Peak Viewer Options menu.
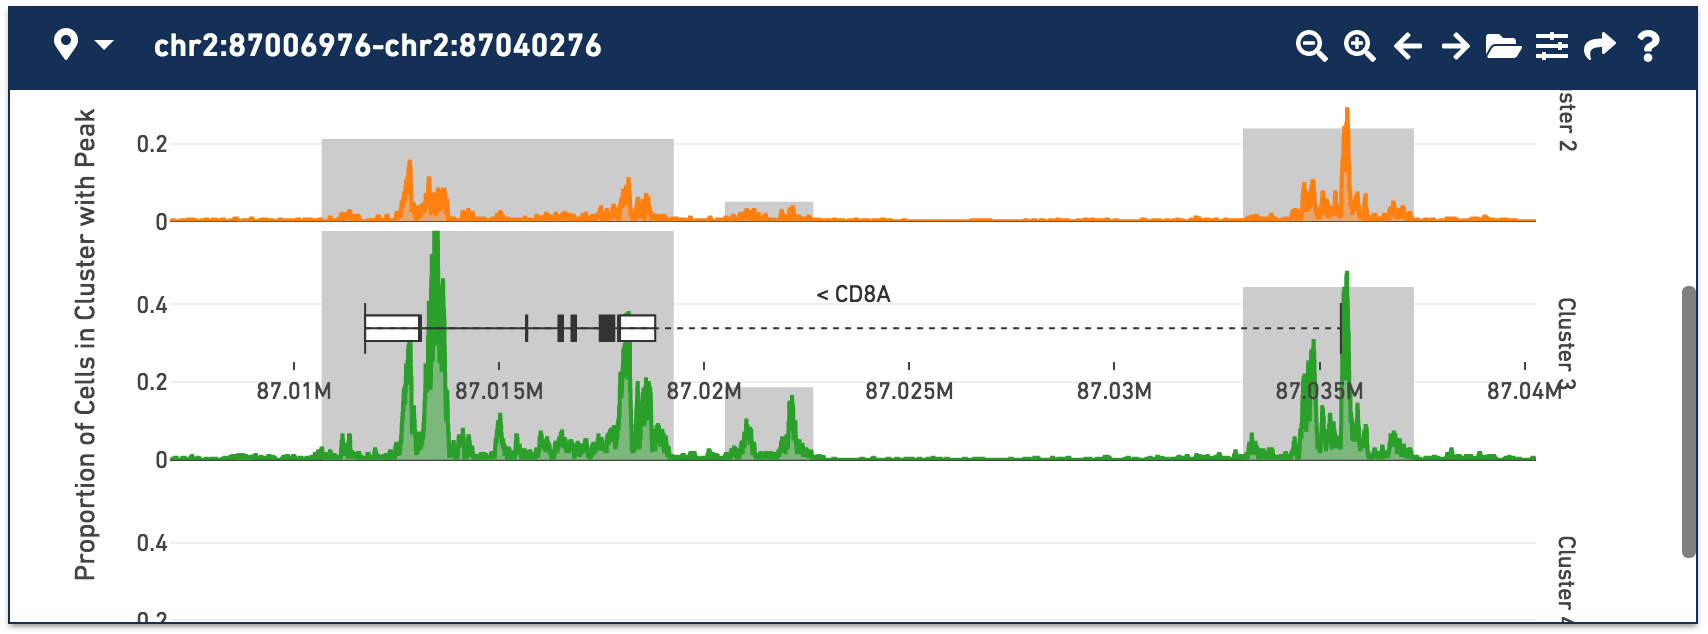
With the cut site tracks visible, it is possible to associate the location of peaks with both genes and functional elements within genes. The Peak Viewer shows gene, transcript, exon and UTR annotations in a bar above the cluster tracks. These annotations come directly from the reference specified in the Cell Ranger ATAC run. Genes are displayed as dashed lines with vertical line boundaries, the selected transcript as a solid line, exons as solid rectangles, and UTRs as open rectangles. In narrow window sizes, gene names are displayed above the annotation, though more information about a gene is available at any point by hovering over the annotation symbol.
Though there can be multiple transcripts per gene, the Peak Viewer only displays exons and UTRs from one transcript per gene. This is a visual compromise since there is limited screen space to show all transcripts from a reference. Future versions of Loupe Cell Browser may resolve this issue.
The heuristic for picking which transcript to display is as follows:
appris_principal tags in the reference.appris_principal tags, pick the ones that have
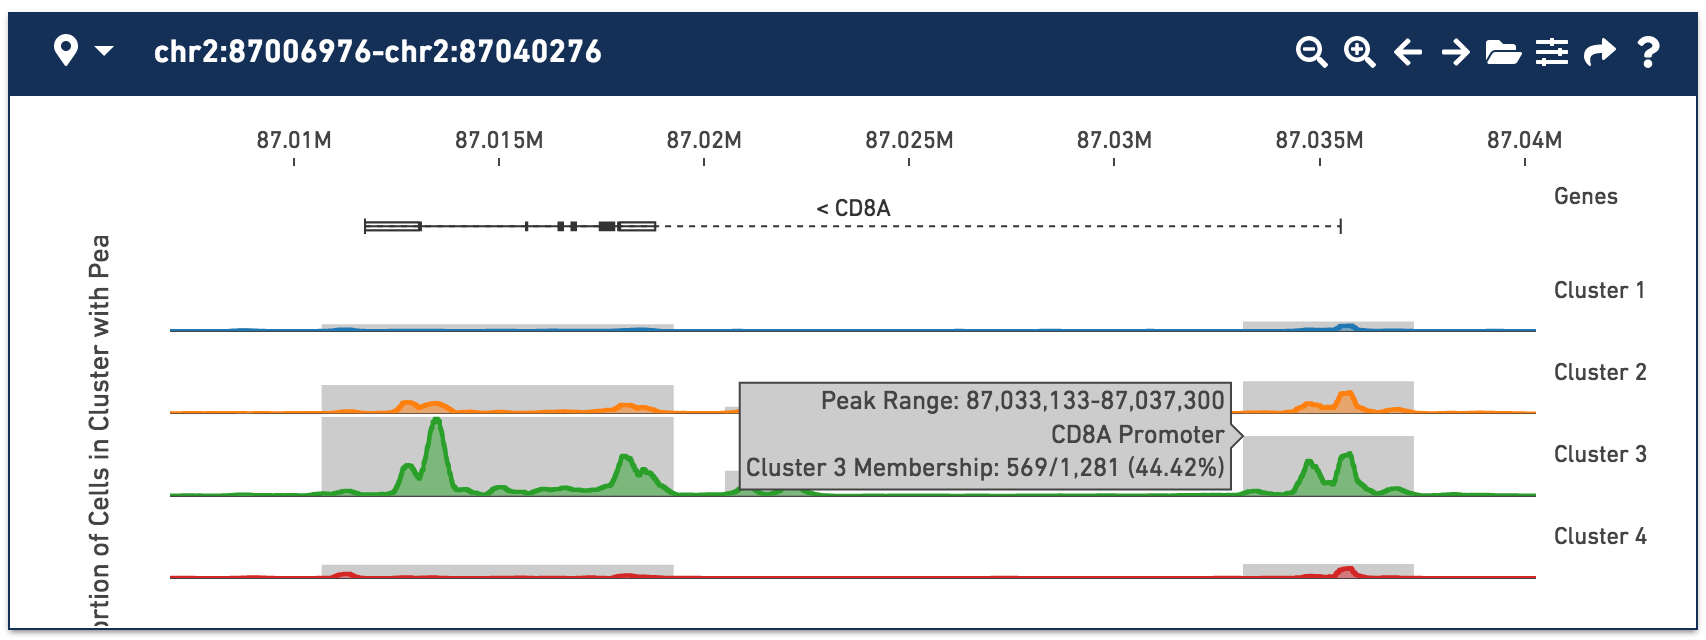
the best transcript_support_level values (1 is best, 5 is worst)TRANSCRIPT-002 rather than TRANSCRIPT-003.Though only one transcript per gene is shown in the peak viewer, peaks can be marked as promoting genes if they are close to the transcription start sites of alternate transcripts. This is apparent by looking at CD8A below:
The rightmost peak within CD8A is close to the transcription start site of an alternate CD8A transcript specified in the reference, but not drawn in the annotation track.
Clicking on the sliders icon next to the folder icon brings up the Peak Viewer Options menu. Details of the options are as follows:
Hide/Show Peak Distribution -- This option allows whether to show the called peaks in colors when cut site tracks are not visible, or in gray when cut site tracks are visible.
Hide/Show Cut Sites -- With the fragments file loaded, select whether to hide or show the cut site tracks.
Disable/Enable Cut Site Normalization -- By default, the cut site sums are normalized by cluster cell count, to show the relative accessibility of a region between clusters that may be of different size. Alternatively, you can see raw nearby cut site counts by choosing Disable Cut Site Normalization. The units displayed when hovering over the cut site track change accordingly.
Show/Hide Annotations -- Hide or show the gene and transcript annotations.
Smoothing Window Size -- Define the width of an open region around a cut site presumed to be accessible. Smaller values may change the apparent shape of a peak, and show more detailed accessibility patterns. You can show just the cut sites themselves by selecting a smoothing window size of 1.
You can export the peak distributions and cut site tracks from the peak viewer, for display or consumption by other bioinformatics tools. Click on the Export arrow icon to bring up the list of export options:
.bedgraph file. This
can be viewed alongside other annotations in the UCSC Genome Browser. IGV does not support
multi-tracked BED files and only the last cluster is visible upon import.