Long Ranger2.1, printed on 03/31/2025
| Analysis software for 10x Genomics linked read products is no longer supported. Raw data processing pipelines and visualization tools are available for download and can be used for analyzing legacy data from 10x Genomics kits in accordance with our end user licensing agreement without support. |
The STRUCTURAL VARIANTS view visualizes large-scale structural variants, such as inter-chromosomal translocations, gene fusions, and inversions or deletions that are several kilobases long. You can access this view by clicking the STRUCTURAL VARIANTS view.
This is what the STRUCTURAL VARIANTS view looks like:
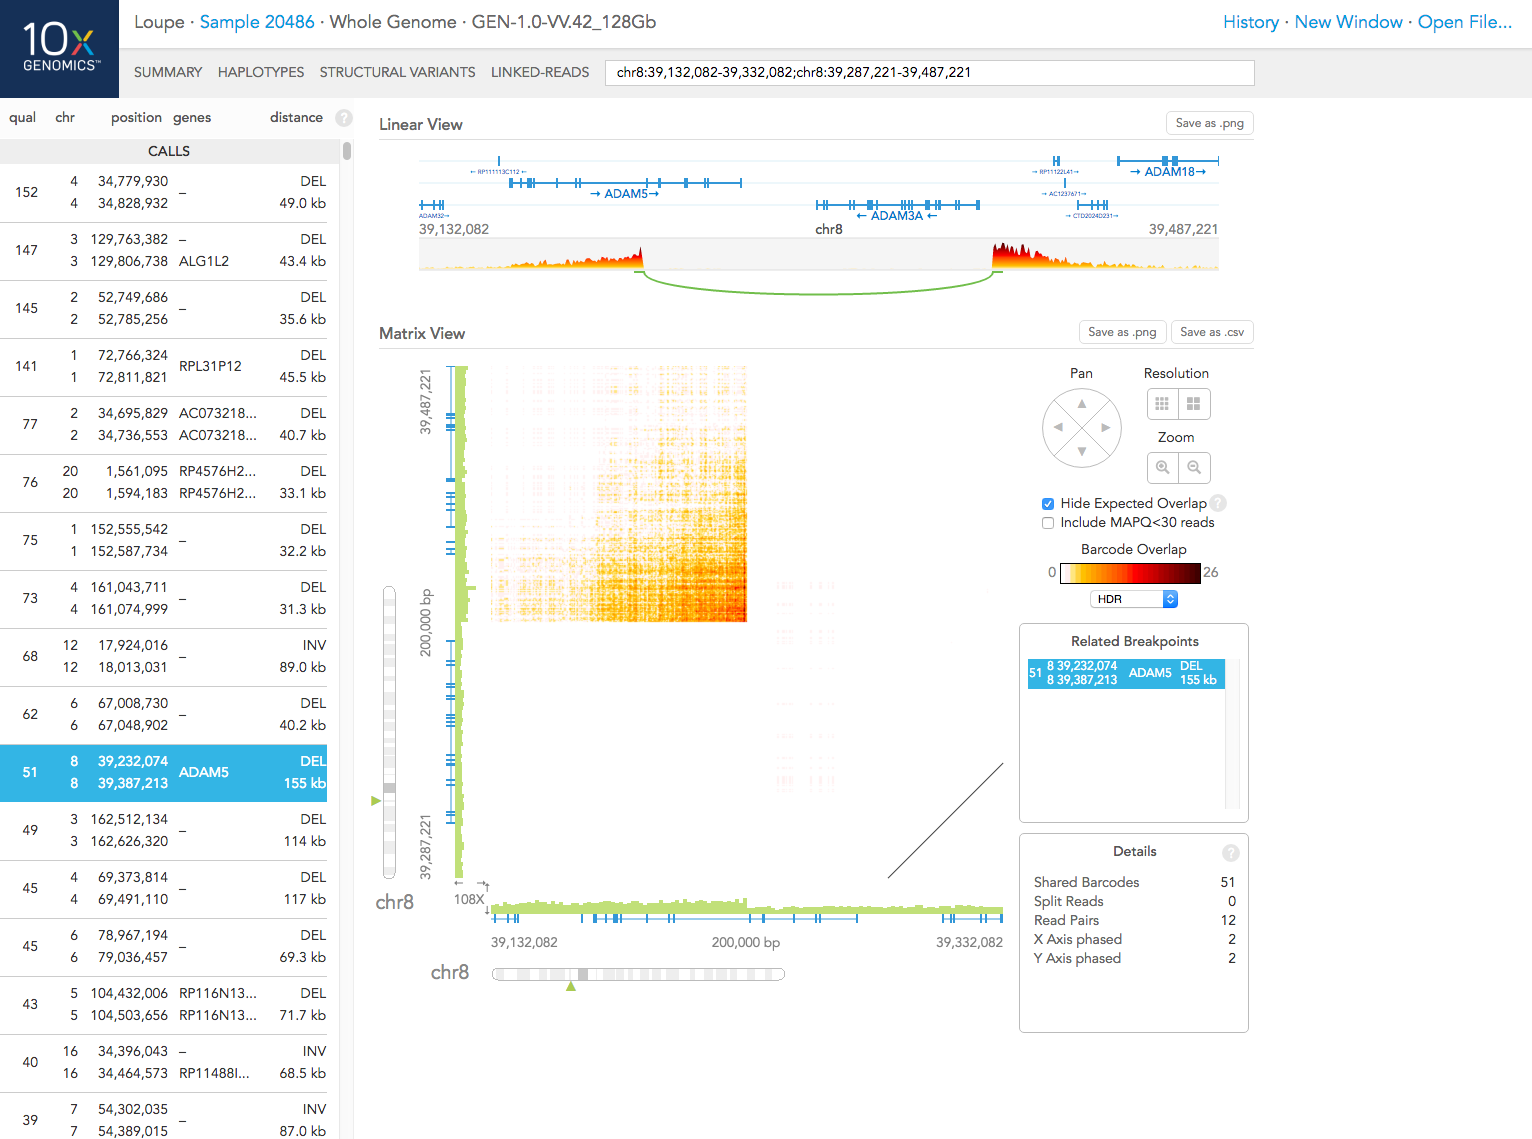
On the left, you can see a list of large-scale structural variant CALLS made in this sample. Calls with low quality or that are in spurious regions of the genome (e.g. highly repetitive regions) are shown in the CANDIDATES list.
For each variant, the list provides:
a quality score for the variant (see below)
the locations (chromosome and position) of the two breakpoints
a list of genes that are close to each of the breakpoints
the distance between the breakpoints (if they are on the same chromosome) or inter chr for inter-chromosomal structural variants
The quality score is a log-likelihood score comparing the following two hypotheses: that there is a structural variant between the two loci or that the observed barcode overlap between the two loci was generated purely by chance. The score is positive when the observed barcode overlap between the two breakpoints can better be explained by the presence of a structural variant. The higher the score, the stronger the evidence of a structural variant.
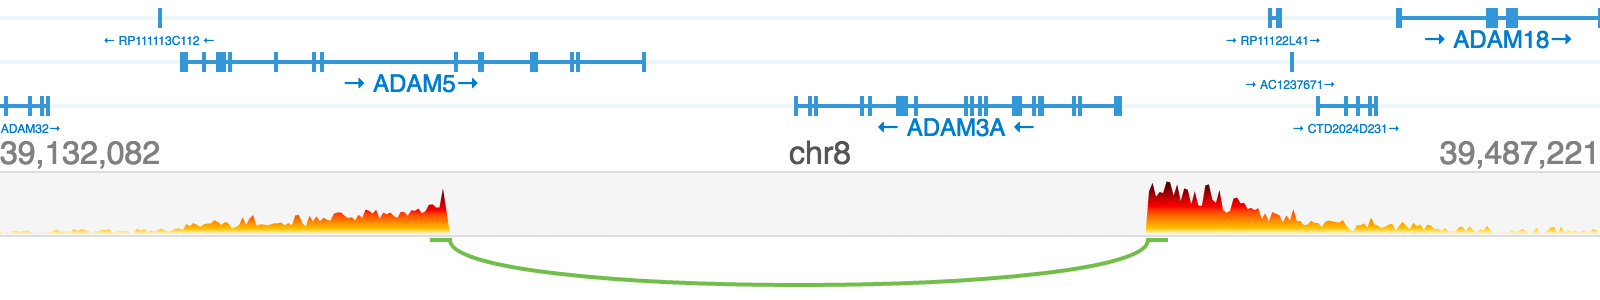
The linear view attempts to draw the breakpoints that the LONGRANGER Structural Variant algorithm detects along with their respective orientations. The view draws a colored arc between each breakpoint and short tail that indicates the directionality of the breakpoint. The linear
view draws every breakpoint in the region that you are viewing, not just the breakpoint selected from the structural variant list. Additionally, the view draws a linearized view of the barcode overlap matrix.
When you click on any item on the list, the corresponding breakpoints are displayed in the matrix in the center of the view. Each position of the matrix corresponds to a pair of loci from the two axes. The intensity of the color shows the number of barcodes that were observed in reads from both loci, that is, the number of distinct common barcodes shared between the two loci.
In the example below the same genomic location is displayed on both axes. The barcode overlap decreases moving along the X-axis from A towards D because those loci are further apart in primary sequence that corresponds to a 50Kb region.

When you click on a structural variant in the CALLS or CANDIDATES section on the left, the breakpoints will be displayed in the matrix view and details for the structural variant call are displayed on the right. Alternatively, enter gene names or genome coordinates into the search bar. To explore the same region in multiple samples, copy and paste the genome coordinates in the search bar for each experiment. Outside the matrix plot vertical green bars for the region(s) diplayed shows the average coverage-per-base and the scale is shown on the lower left.

Pan - move vertically or horizontally within the matrix view
Zoom - zoom both adjusts the x and y axis together and pie (+) (-) buttons act independently
Resolution - modify the coarseness of the matrix view area
Colors - change the color scheme using the drop-down menu under the color bar
Remove Expected Overlap - masks barcode overlap for regions that should have barcode overlap relative to the reference
Include MAPQ<30 reads - includes barcode overlap for reads with mapping quality below 30
Details - click anywhere within the matrix view for details about the x and y-axis position genome locations, exon numbers and gene names or when a structural variant is selected, the details present the support for the call and the phasing of the breakpoint
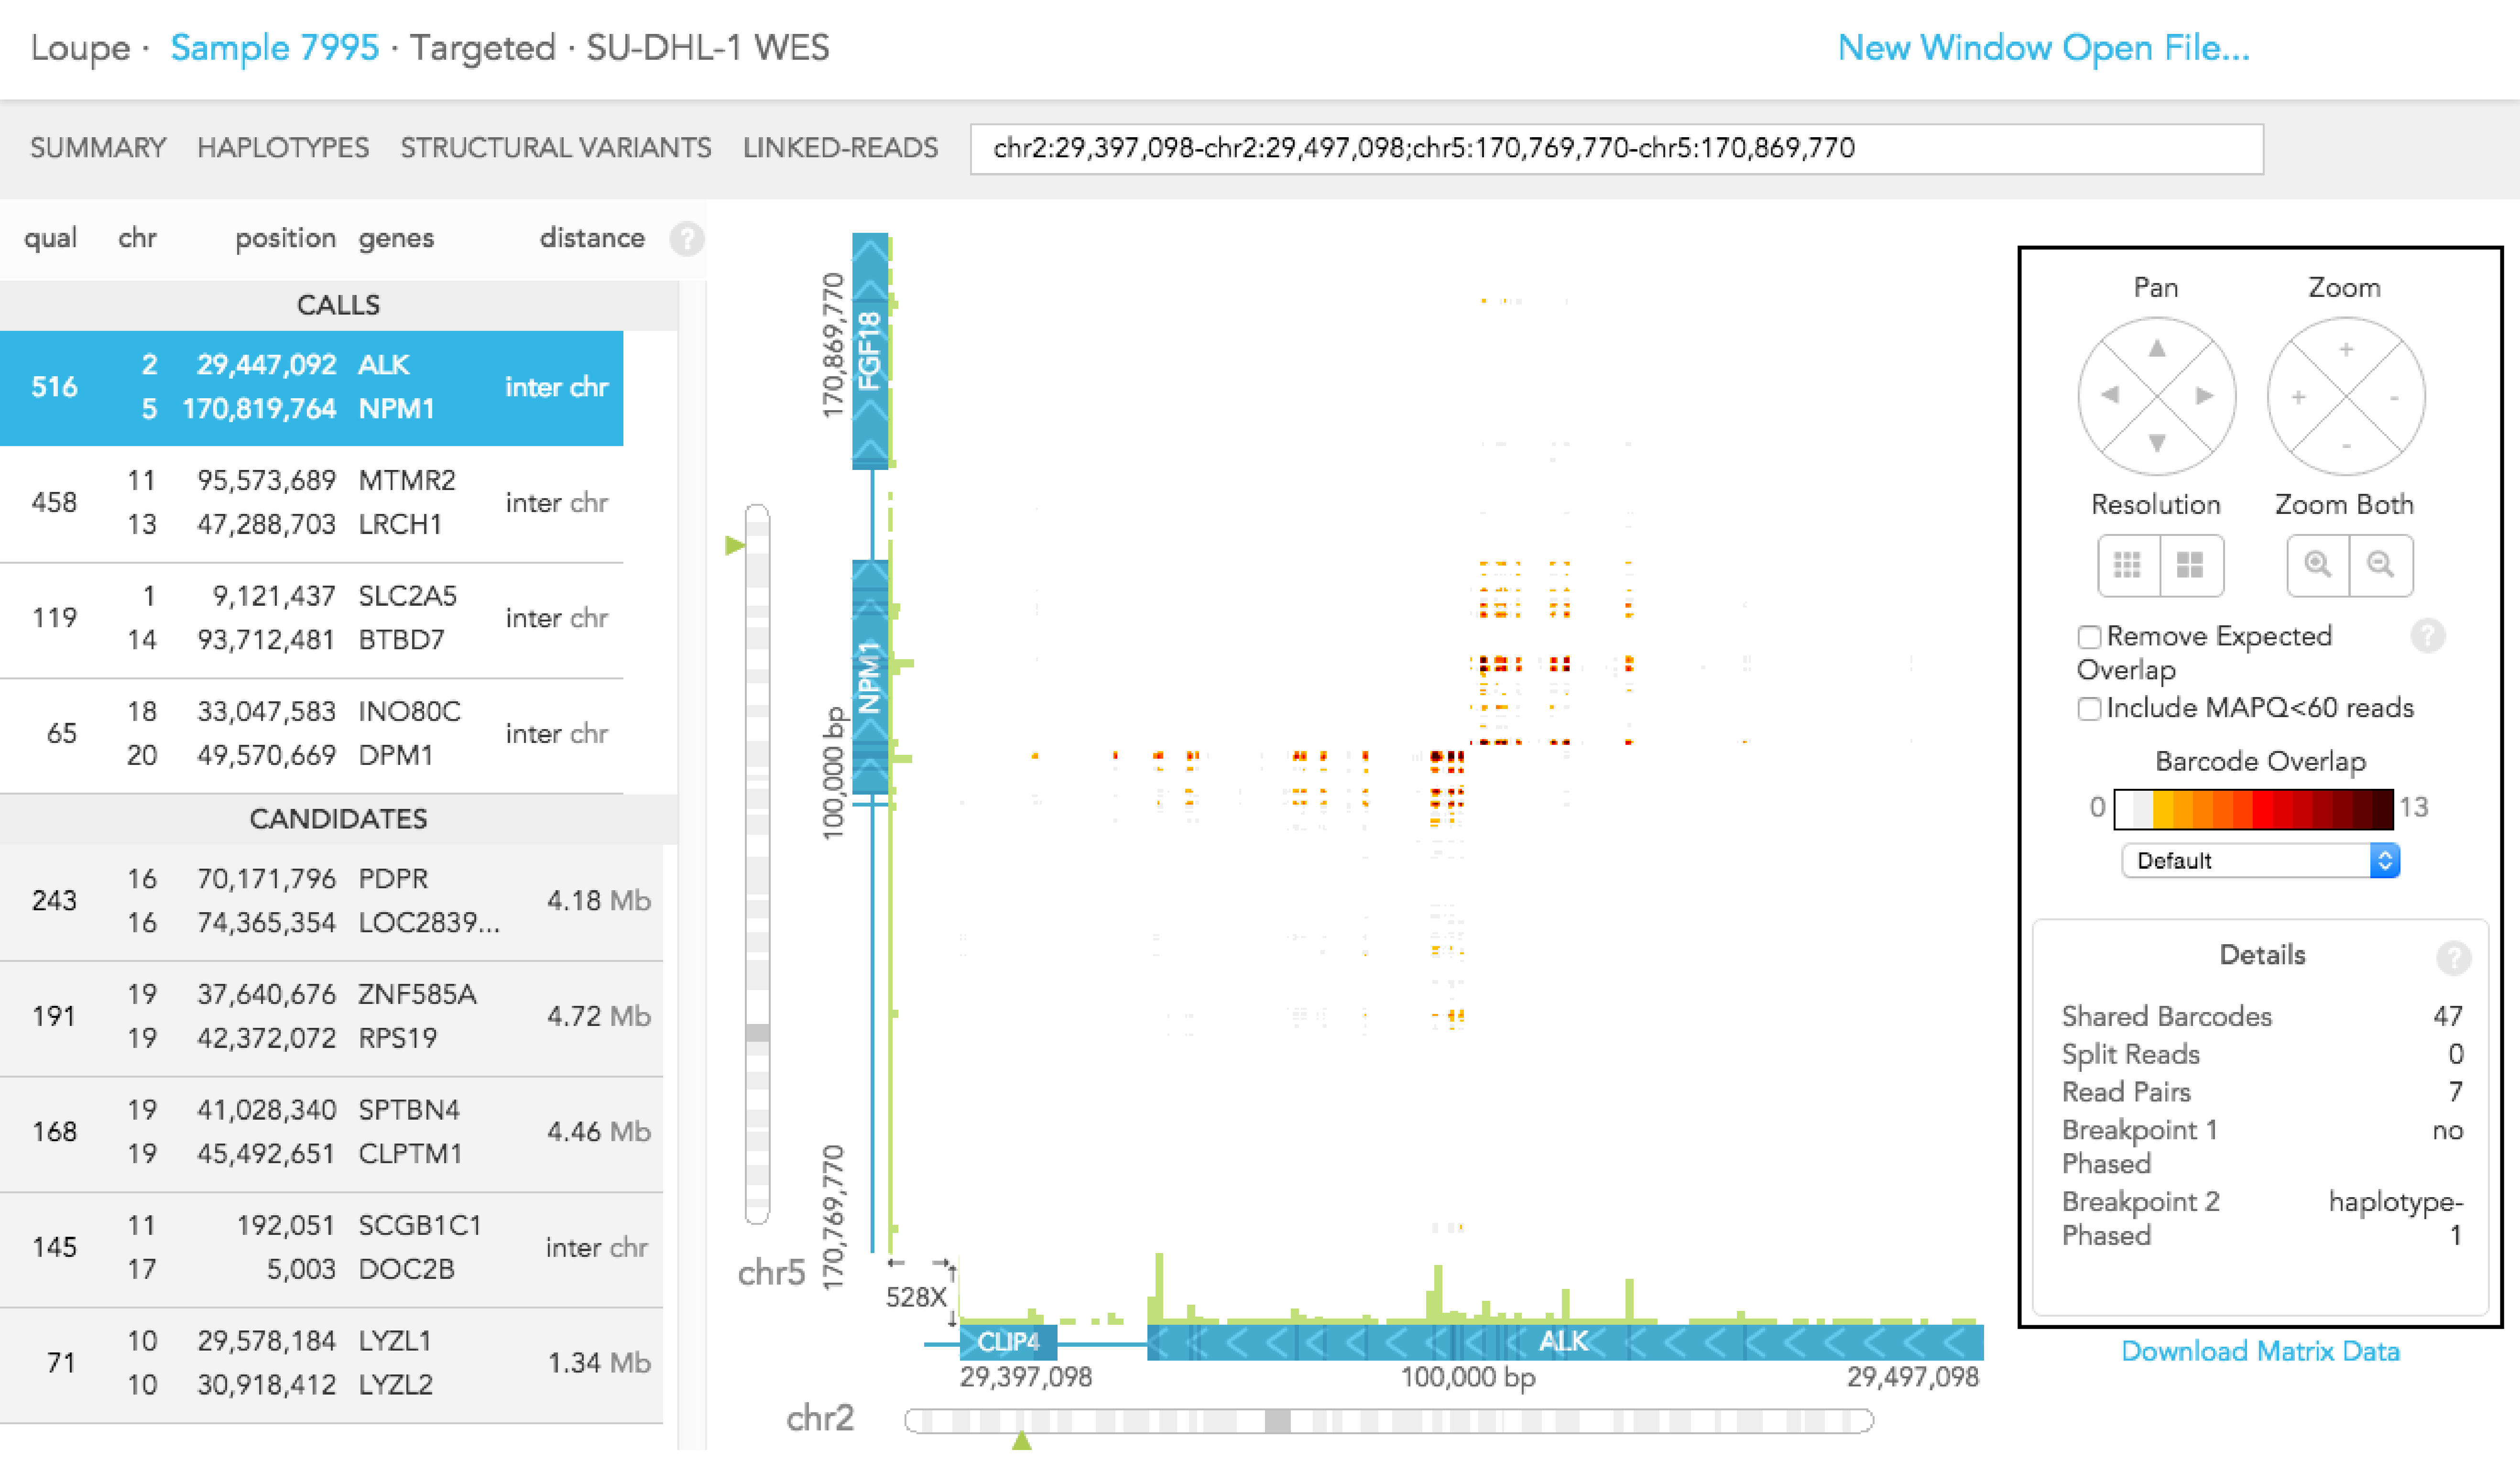
You can use the "Download Matrix Data" button to download a spreadsheet (in CSV) format of the barcode overlaps that you are currently viewing.