Long Ranger2.1, printed on 03/30/2025
| Analysis software for 10x Genomics linked read products is no longer supported. Raw data processing pipelines and visualization tools are available for download and can be used for analyzing legacy data from 10x Genomics kits in accordance with our end user licensing agreement without support. |
Two examples of large-scale deletions visualized in the STRUCTURAL VARIANTS view are discussed below. The data correspond to a whole-genome Chromium library from the NA12878 cell line, with a mean molecule length of 50Kb.
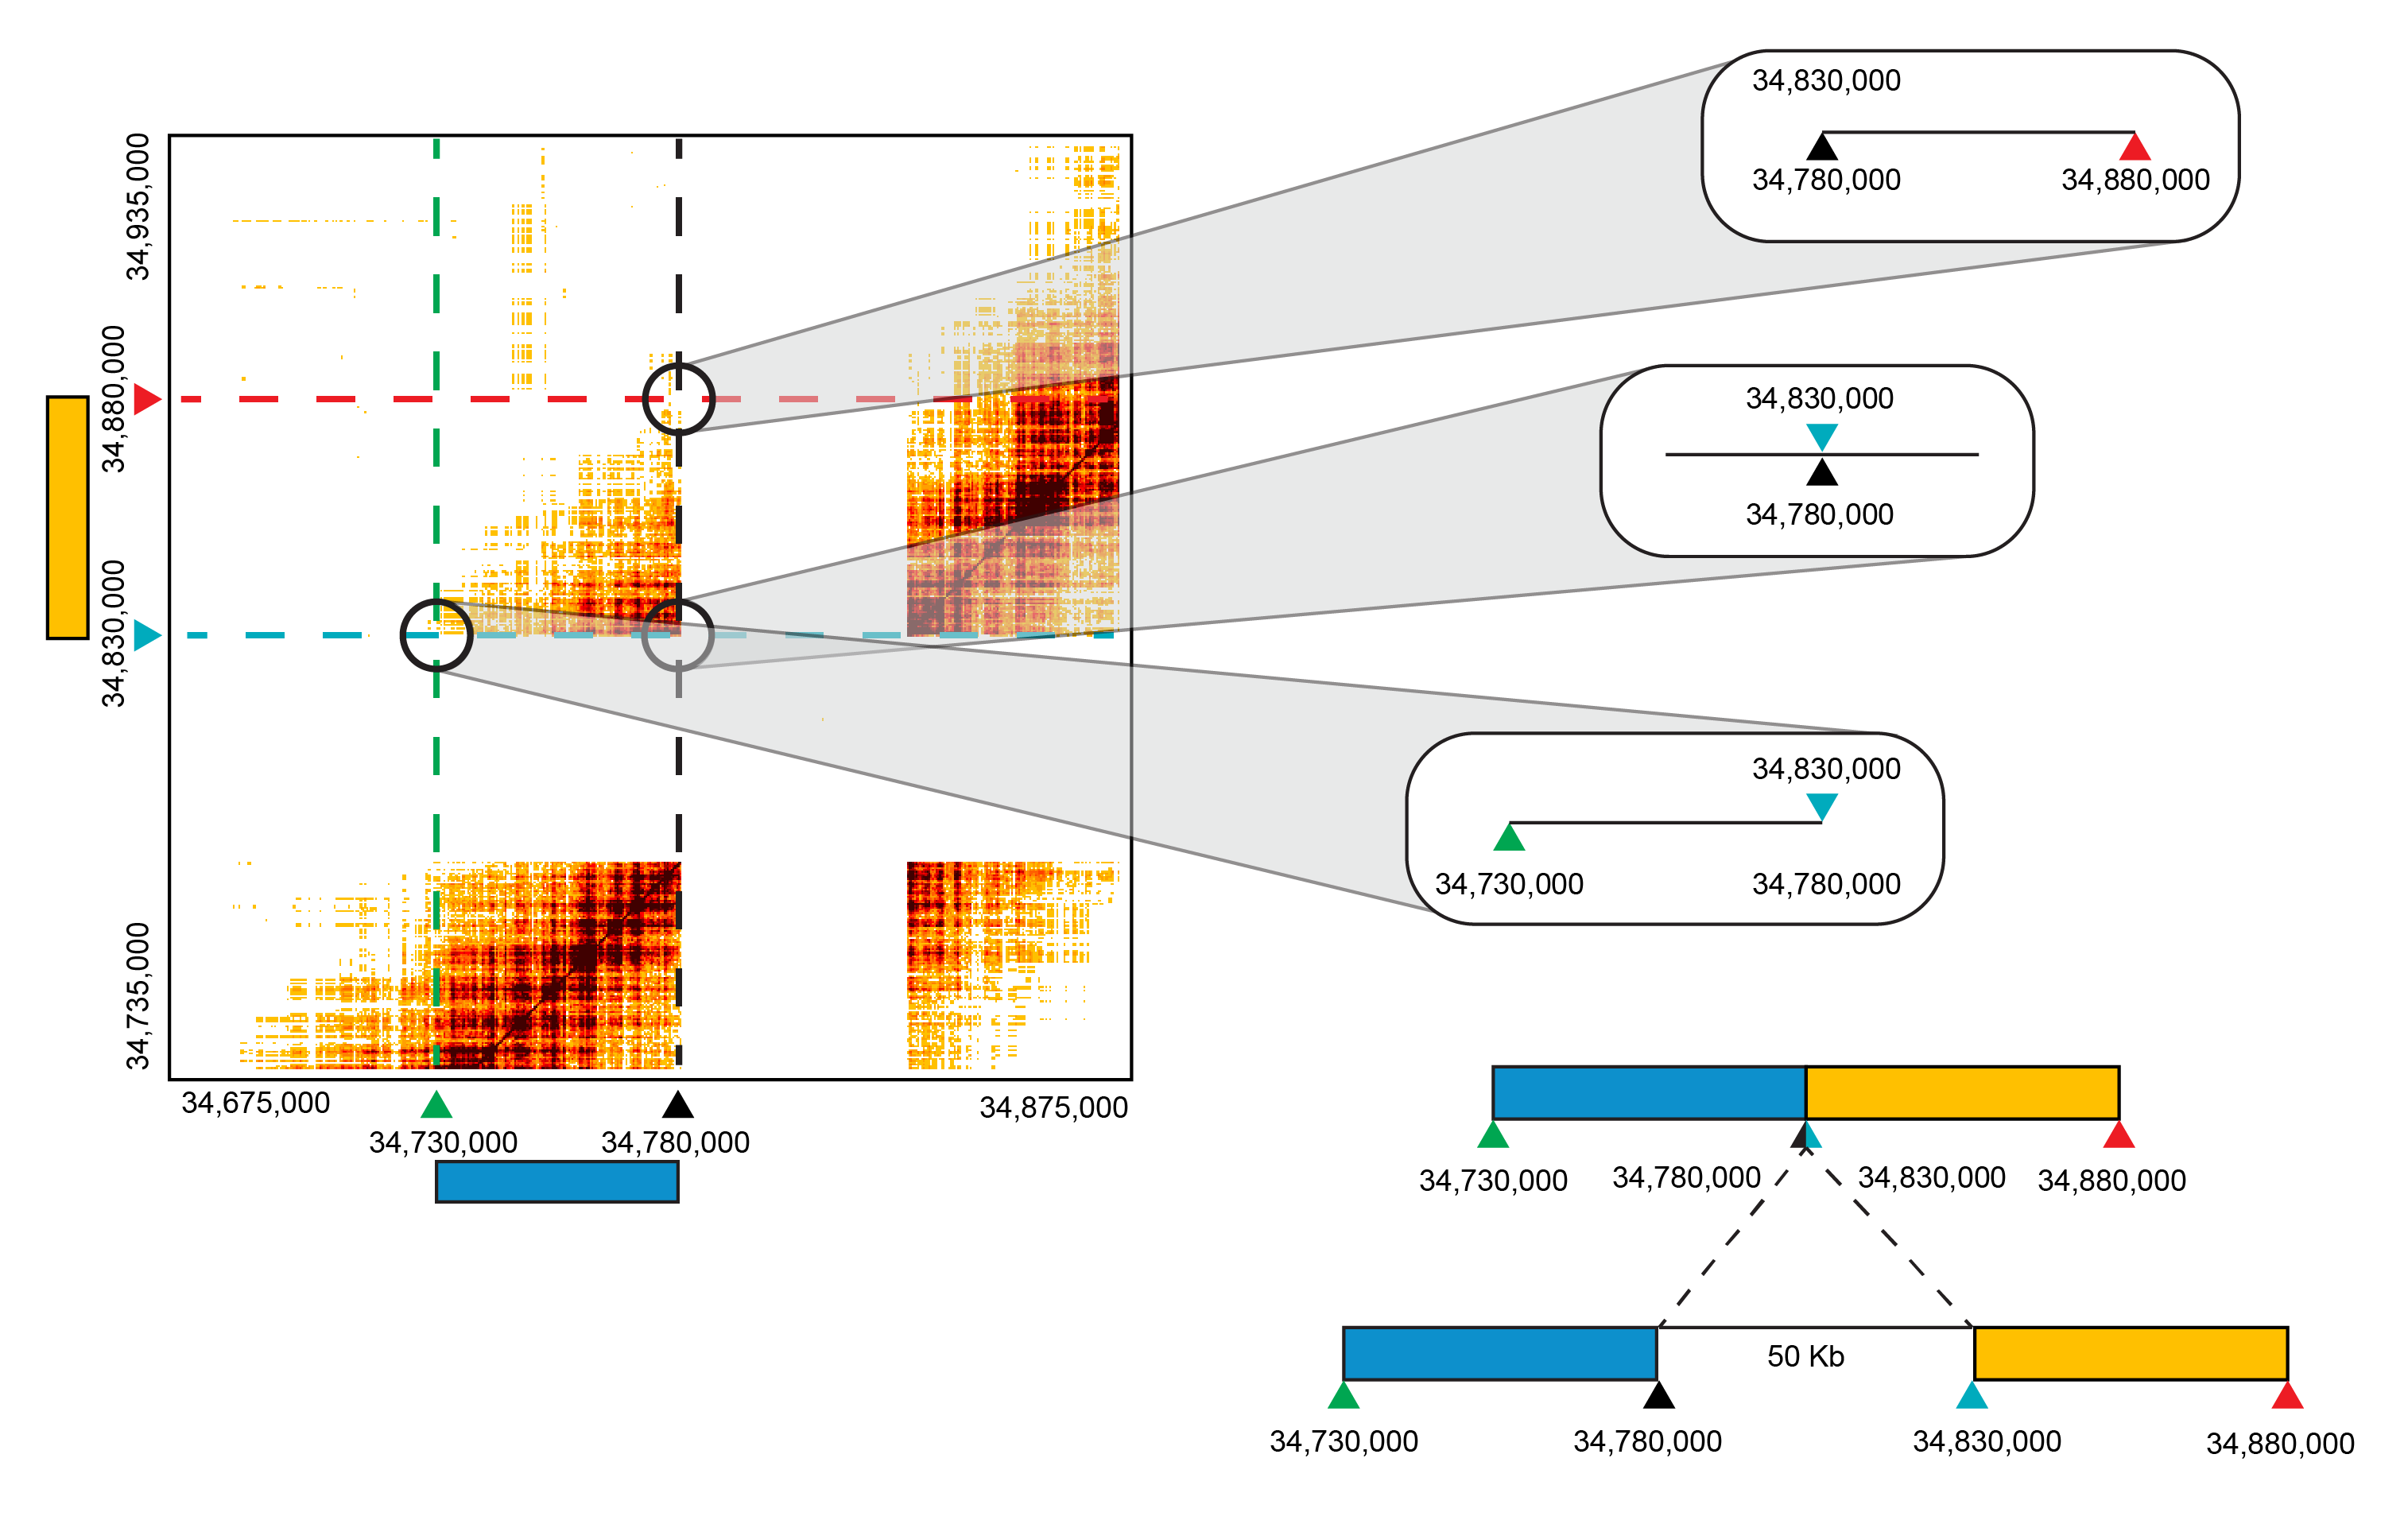
Here the displayed CALL in the a matrix plot corresponds to chr4:34,675,000-chr4:34,875,000 and chr4:34,735,000-chr4:34,935,000. The breakpoints are at chr4:34,780,000 and chr4:34,830,000 (blue and black triangles labeled on the matrix and diagram to right). These loci have the most barcode overlap so they are close in primary sequence in the sample, hence the called breakpoints. Moving along either the X or Y-axis away from the breakpoints, the barcode overlap diminishes with DNA molecule length. Each of these regions translate to chr4:34,730,000-chr4:34,780,000 (blue) and chr4:34,830,000-chr4:34,880,000 (yellow). This supports that the region between chr4:34,780,000 and chr4:34,830,000 was deleted in this sample. Since there is no signal for the intervening region of the genome this suggests a homozygous deletion.
The screenshot below shows what the deletion looks like in the Loupe STRUCTURAL VARIANTS view.
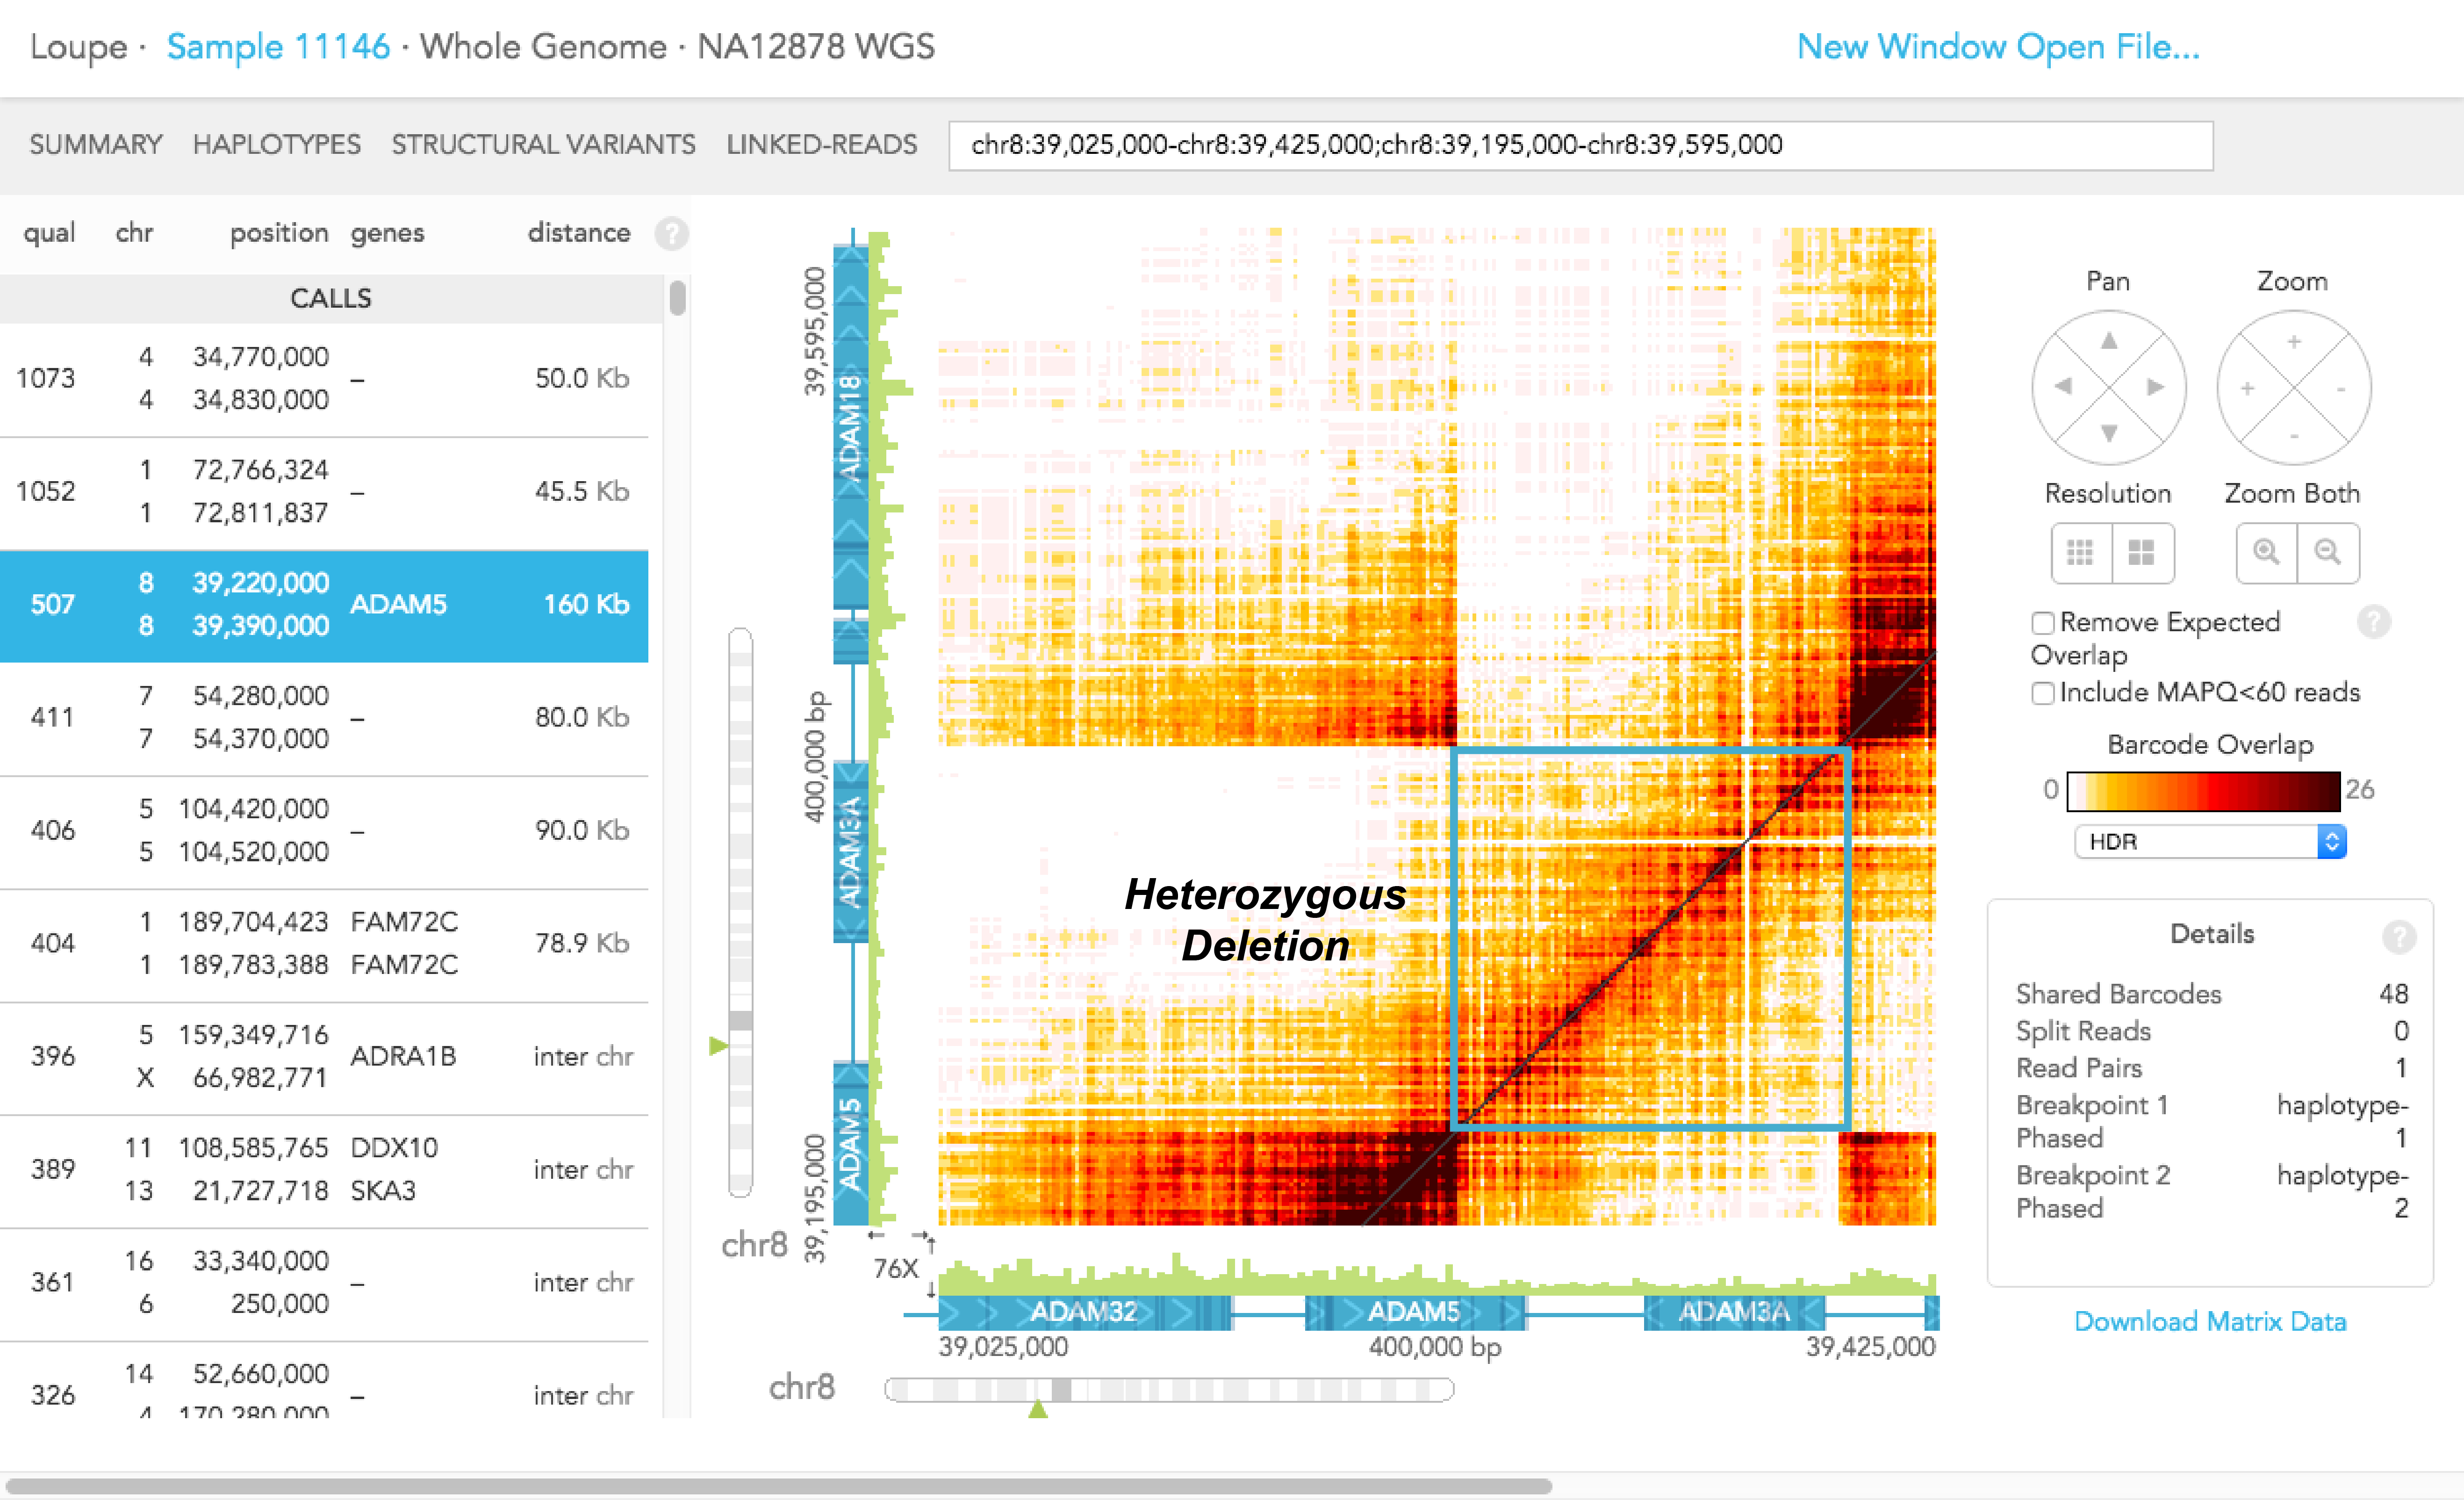
In this particular screenshot, the X and Y axes correspond to the same region of the genome, so the barcode overlap matrix is symmetric. The diagonal shows the number of barcodes in each position along the displayed region. The colored band around the diagonal reflects long molecules that span several kilobases, thus generating barcode overlaps across their span.
The color intensity drops near the middle of the figure, suggesting a relative drop in the number of molecules (and therefore the number of reads) in that region. Furthermore, there are two symmetric areas of barcode overlap away from the diagonal like in the first example above. The overlap is strongest around the point displayed in the details box (chr1:189,703,878 - chr1:189,783,373). The overlap diminishes as we move from 189,703,878 towards lower coordinates or away from 189,783,373 towards higher coordinates. Both these observations (the drop in coverage and the off-diagonal barcode overlap) suggest a heterozygous deletion around chr1:189,703,878-189,783,373.
The screenshot below shows how the 'Remove Expected Overlap' helps visualize the breakpoint. The diagonal black line demarcates where the X and Y coordinates are equal.
