Long Ranger2.1, printed on 03/31/2025
| Analysis software for 10x Genomics linked read products is no longer supported. Raw data processing pipelines and visualization tools are available for download and can be used for analyzing legacy data from 10x Genomics kits in accordance with our end user licensing agreement without support. |
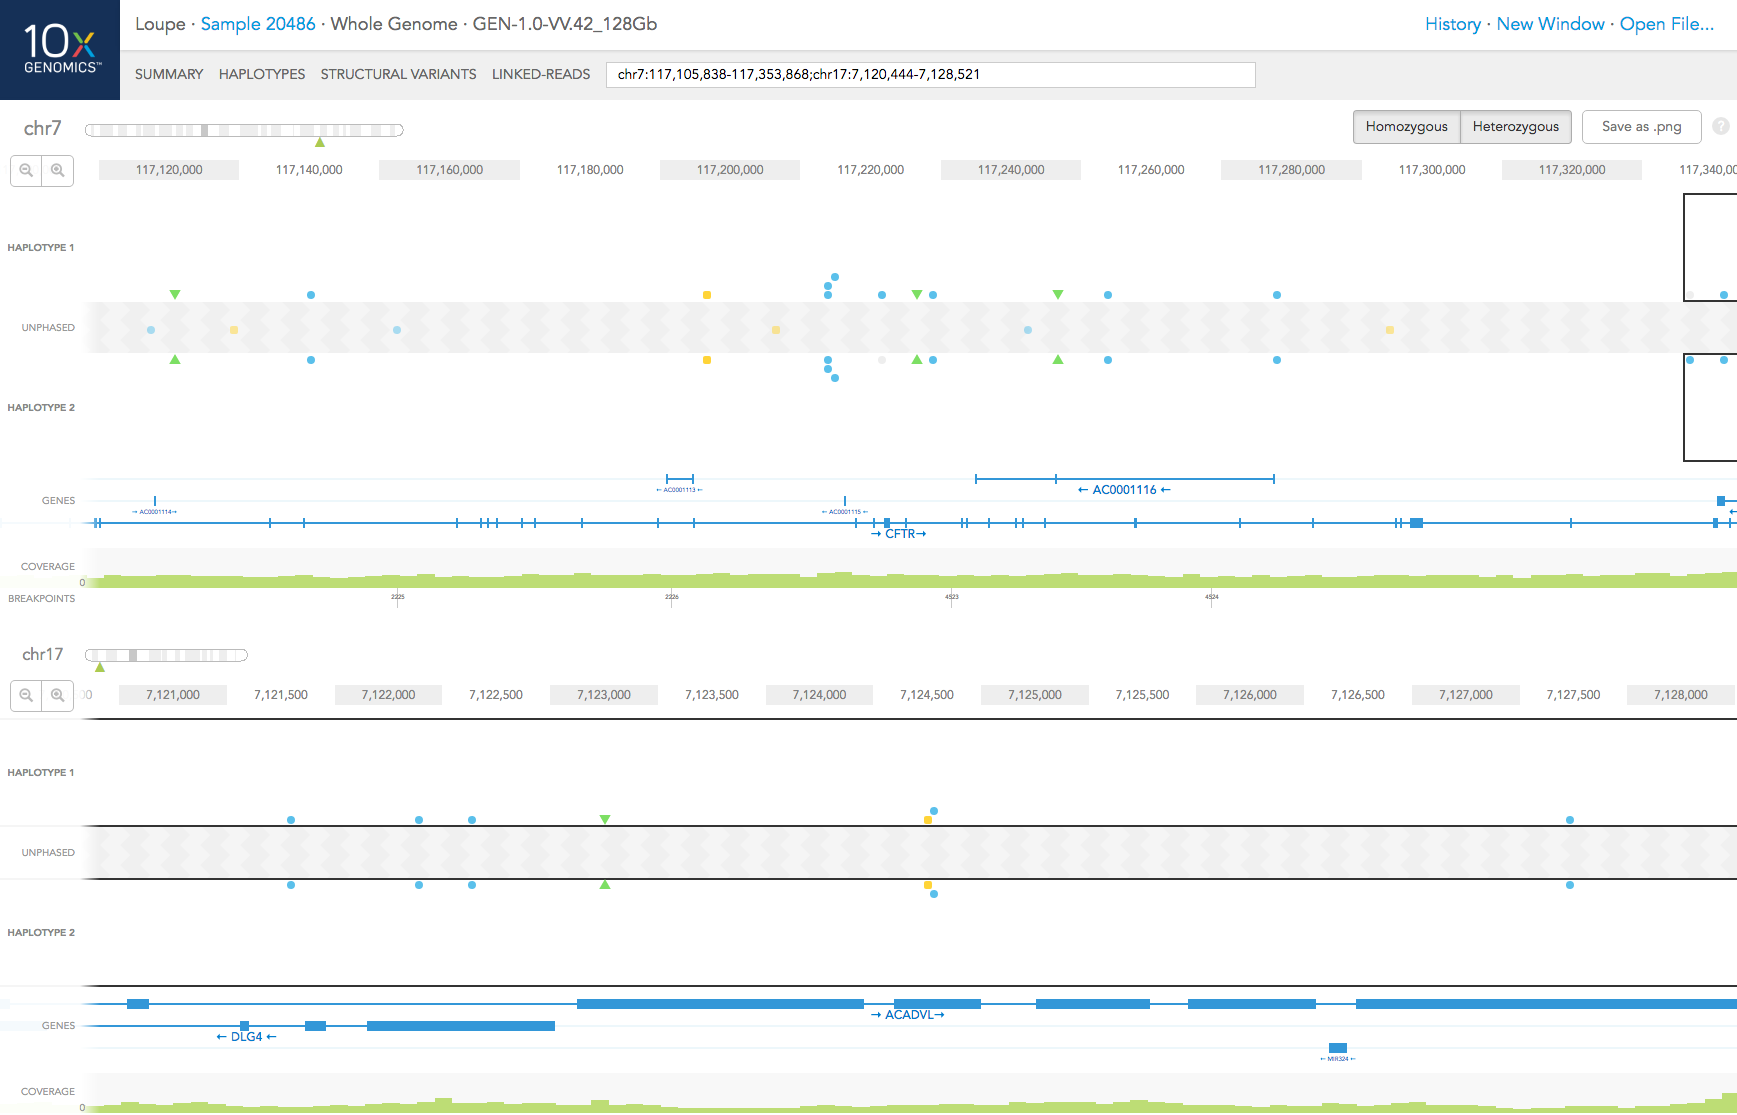
The HAPLOTYPES view displays the haploid genotype information contained in any genomic region of a sample. Like a regular genome browser, it allows you to zoom and scroll over chromosomes and navigate through genes and their exons. Unlike a regular genome browser, it displays the genome as two haplotypes; SNPs, small insertions and deletions are mapped to each haplotype based on the phasing algorithm of Long Ranger
Clicking on HAPLOTYPES in the navigation bar directs you to the Haplotype browser. To go to a specific area of the genome, you can type a gene name, or a coordinate in the search box at the end of the navigation bar (Acceptable coordinates are discussed in Getting Started). Above HAPLOTYPE tracks, you will find coordinates of the region, as well as tools to zoom in and out of the region. In addition, you can zoom in to a specific gene by clicking on it.
On the top of the browser, you will see a miniature chromosome with the centromere marked by a dark rectangle and chromosome bands marked by light grey rectangles. The green triangle indicates the location currently in zoom, giving you a big picture view of your region of interest with respect to the rest of the chromosome.
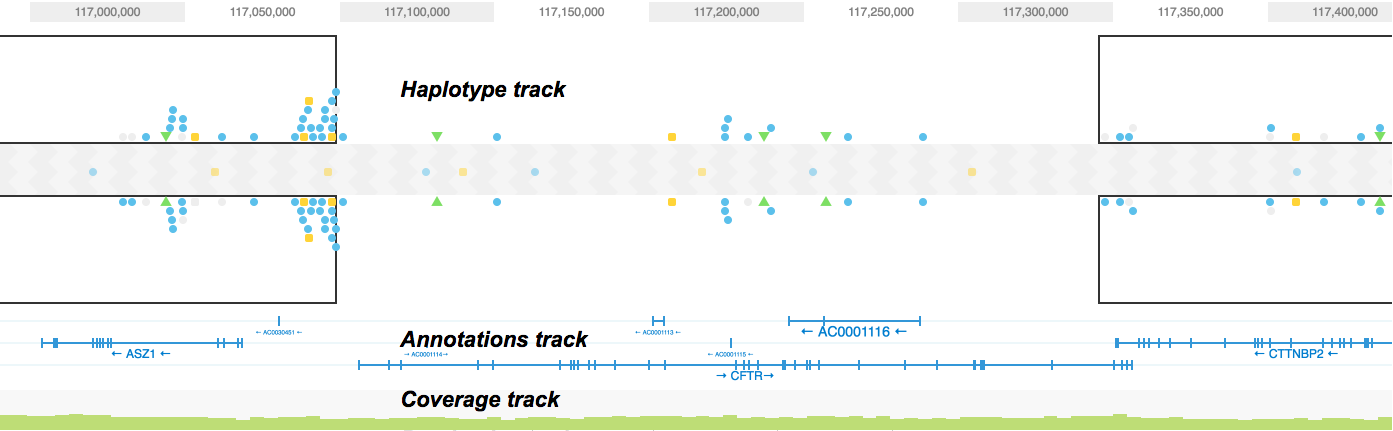
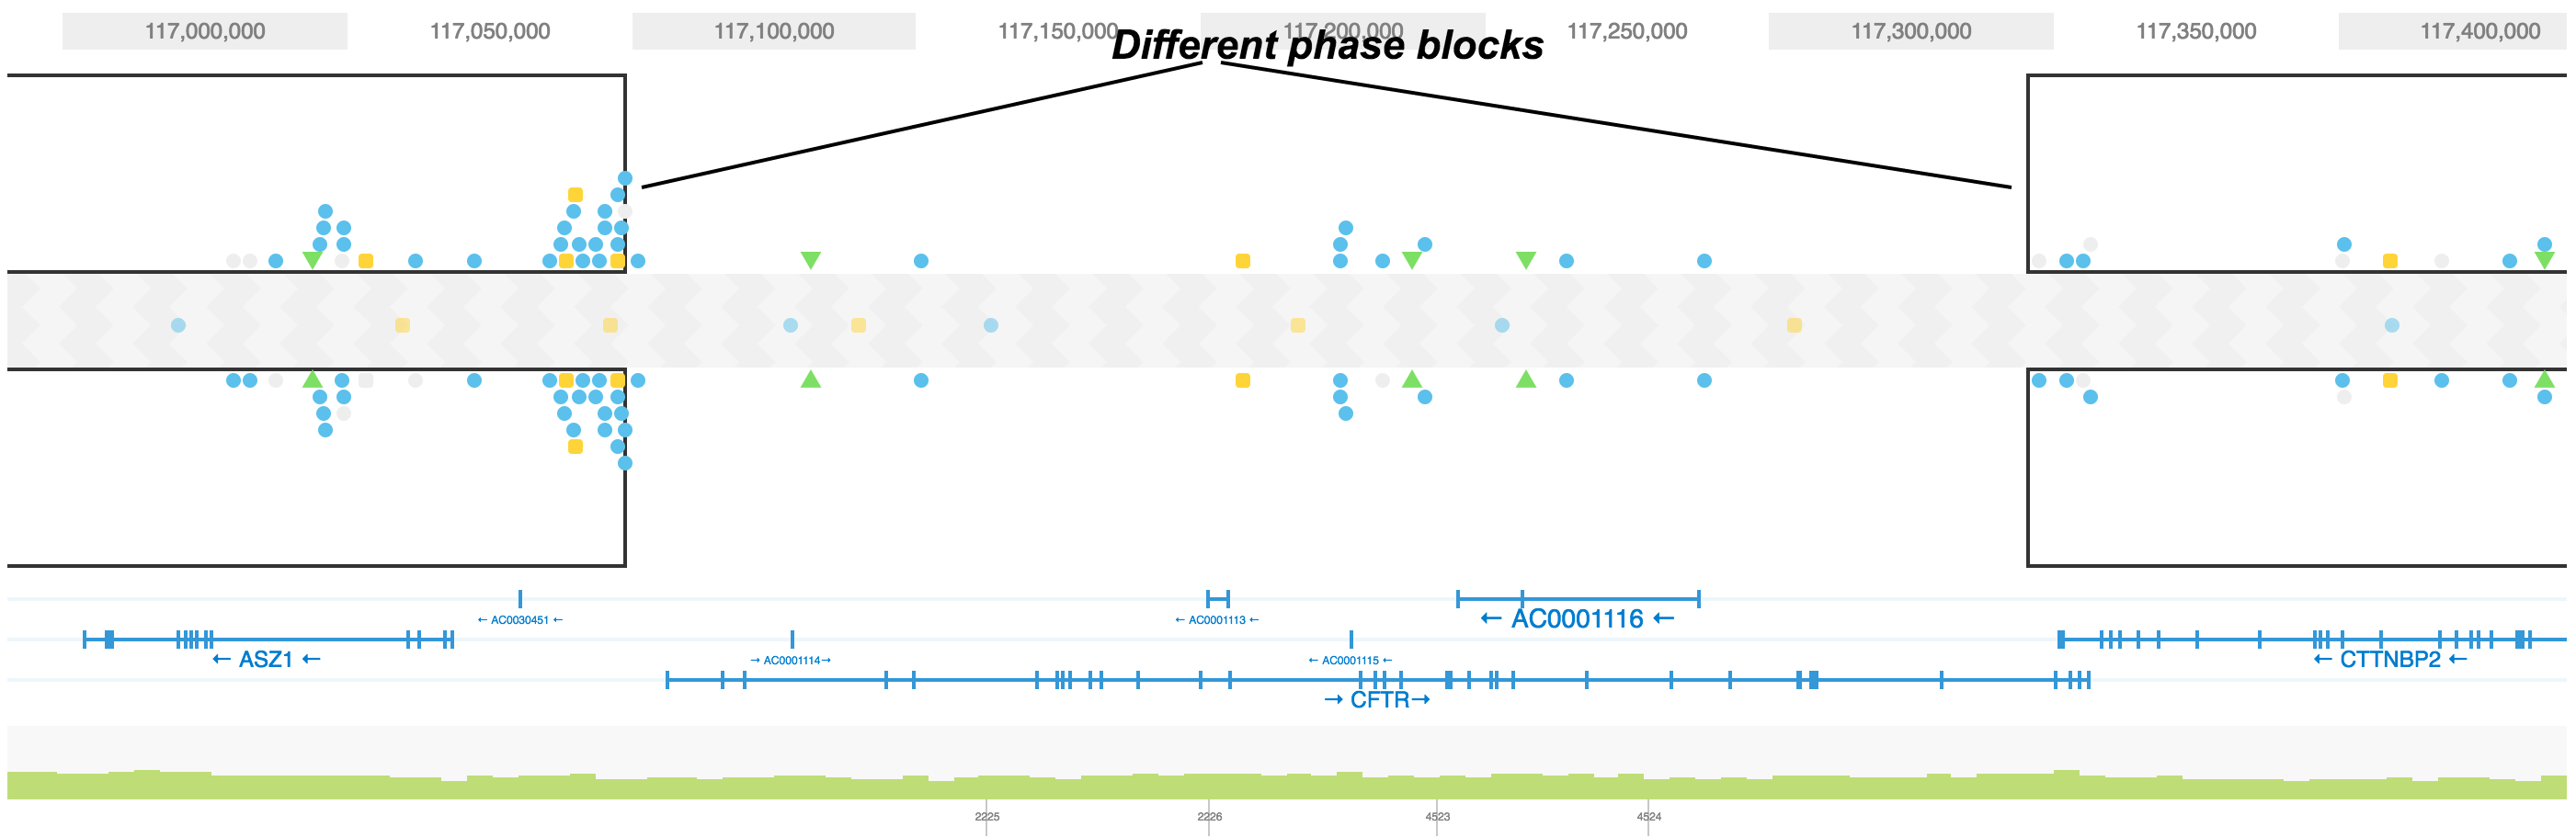
HAPLOTYPE 1 and HAPLOTYPE 2 are displayed as two separate tracks for the region of interest. Phased portions of the region are enclosed in black rectangular boxes. These boxes demarcate phased blocks, a contiguous phased region of the chromosome as determined by Long Ranger. In this example, the ASZ1 gene and CTTNBP2 genes are both phased. It is important to note that since ASZ1 and CTTNBP2 are on two different phase blocks (separated by a region that is not phased), haplotype assignments to SNPs and indels in the ASZ1 gene are not necessarily consistent with that of the CTTNBP2 gene. The CFTR gene is not in a phase block and no SNPs called on it are phased.
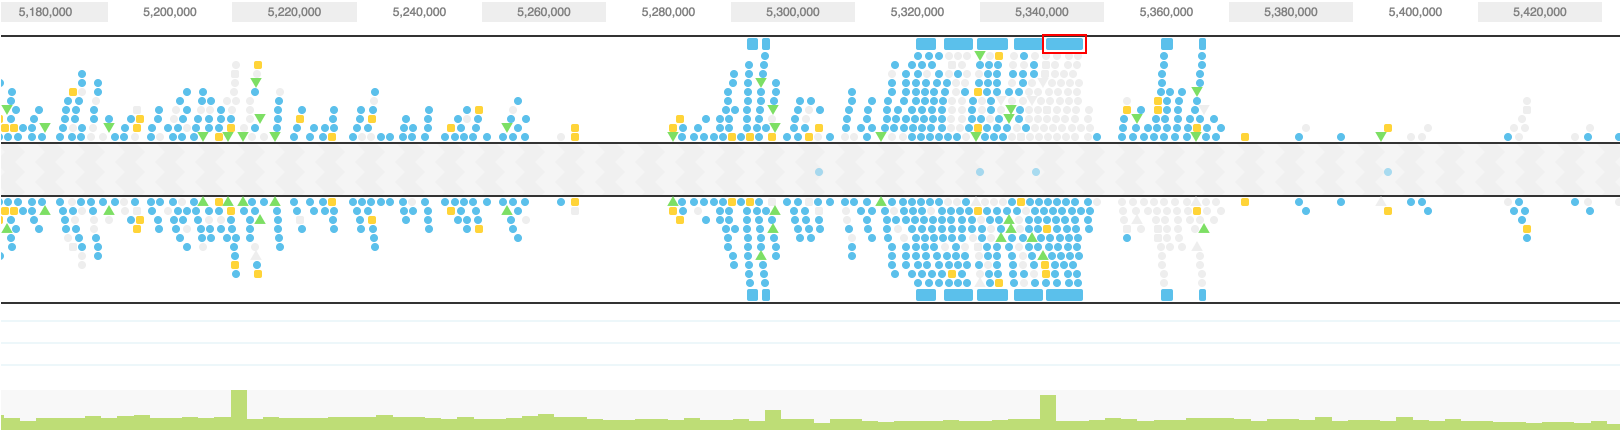
Small icons represent SNPs, small insertions and deletions. Grey represents the reference genotype and any other color represents the alternative genotype. A homozygous SNP will have have two identical (colored) icons on both haplotype tracks. Phased heterozygous SNPs are placed on one of the haplotype tracks and unphased heterozygous SNPs are displayed in the area between the two haplotype tracks.
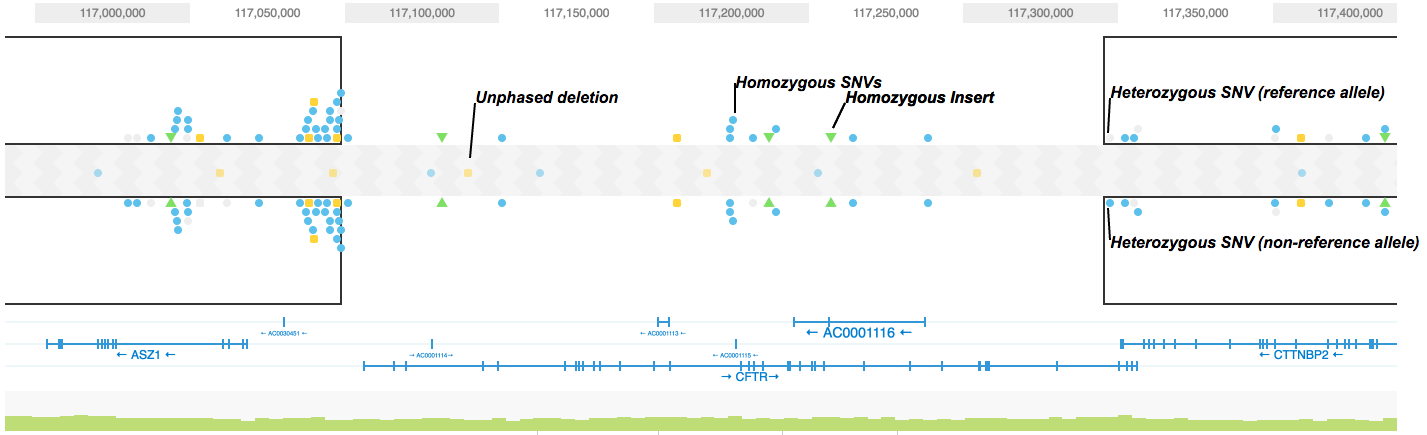
The different icon shapes correspond to different classes of variants.

Loupe stacks variants vertically to try to show as many variants as possible on the screen. There is no biological significance to the vertical alignment of the SNP icons in the haplotype view. If loupe cannot fit all of the variants on the screen, it arbitrarily combines some into a group and draws that group near the top (or bottom) of the haplotype. You may click the combined SNP group to zoom in to that region in order to resolve individual variants.
The GENES track displays annotated reference genes. Multiple genes can be displayed using the search bar by entering the genes of interest. The direction of each gene is indicated with arrows and exons are highlighted with dark blue shades. Overlapping genes are shown on a maximum of three tracks in the GENES track but many genes may be displayed using the search bar.
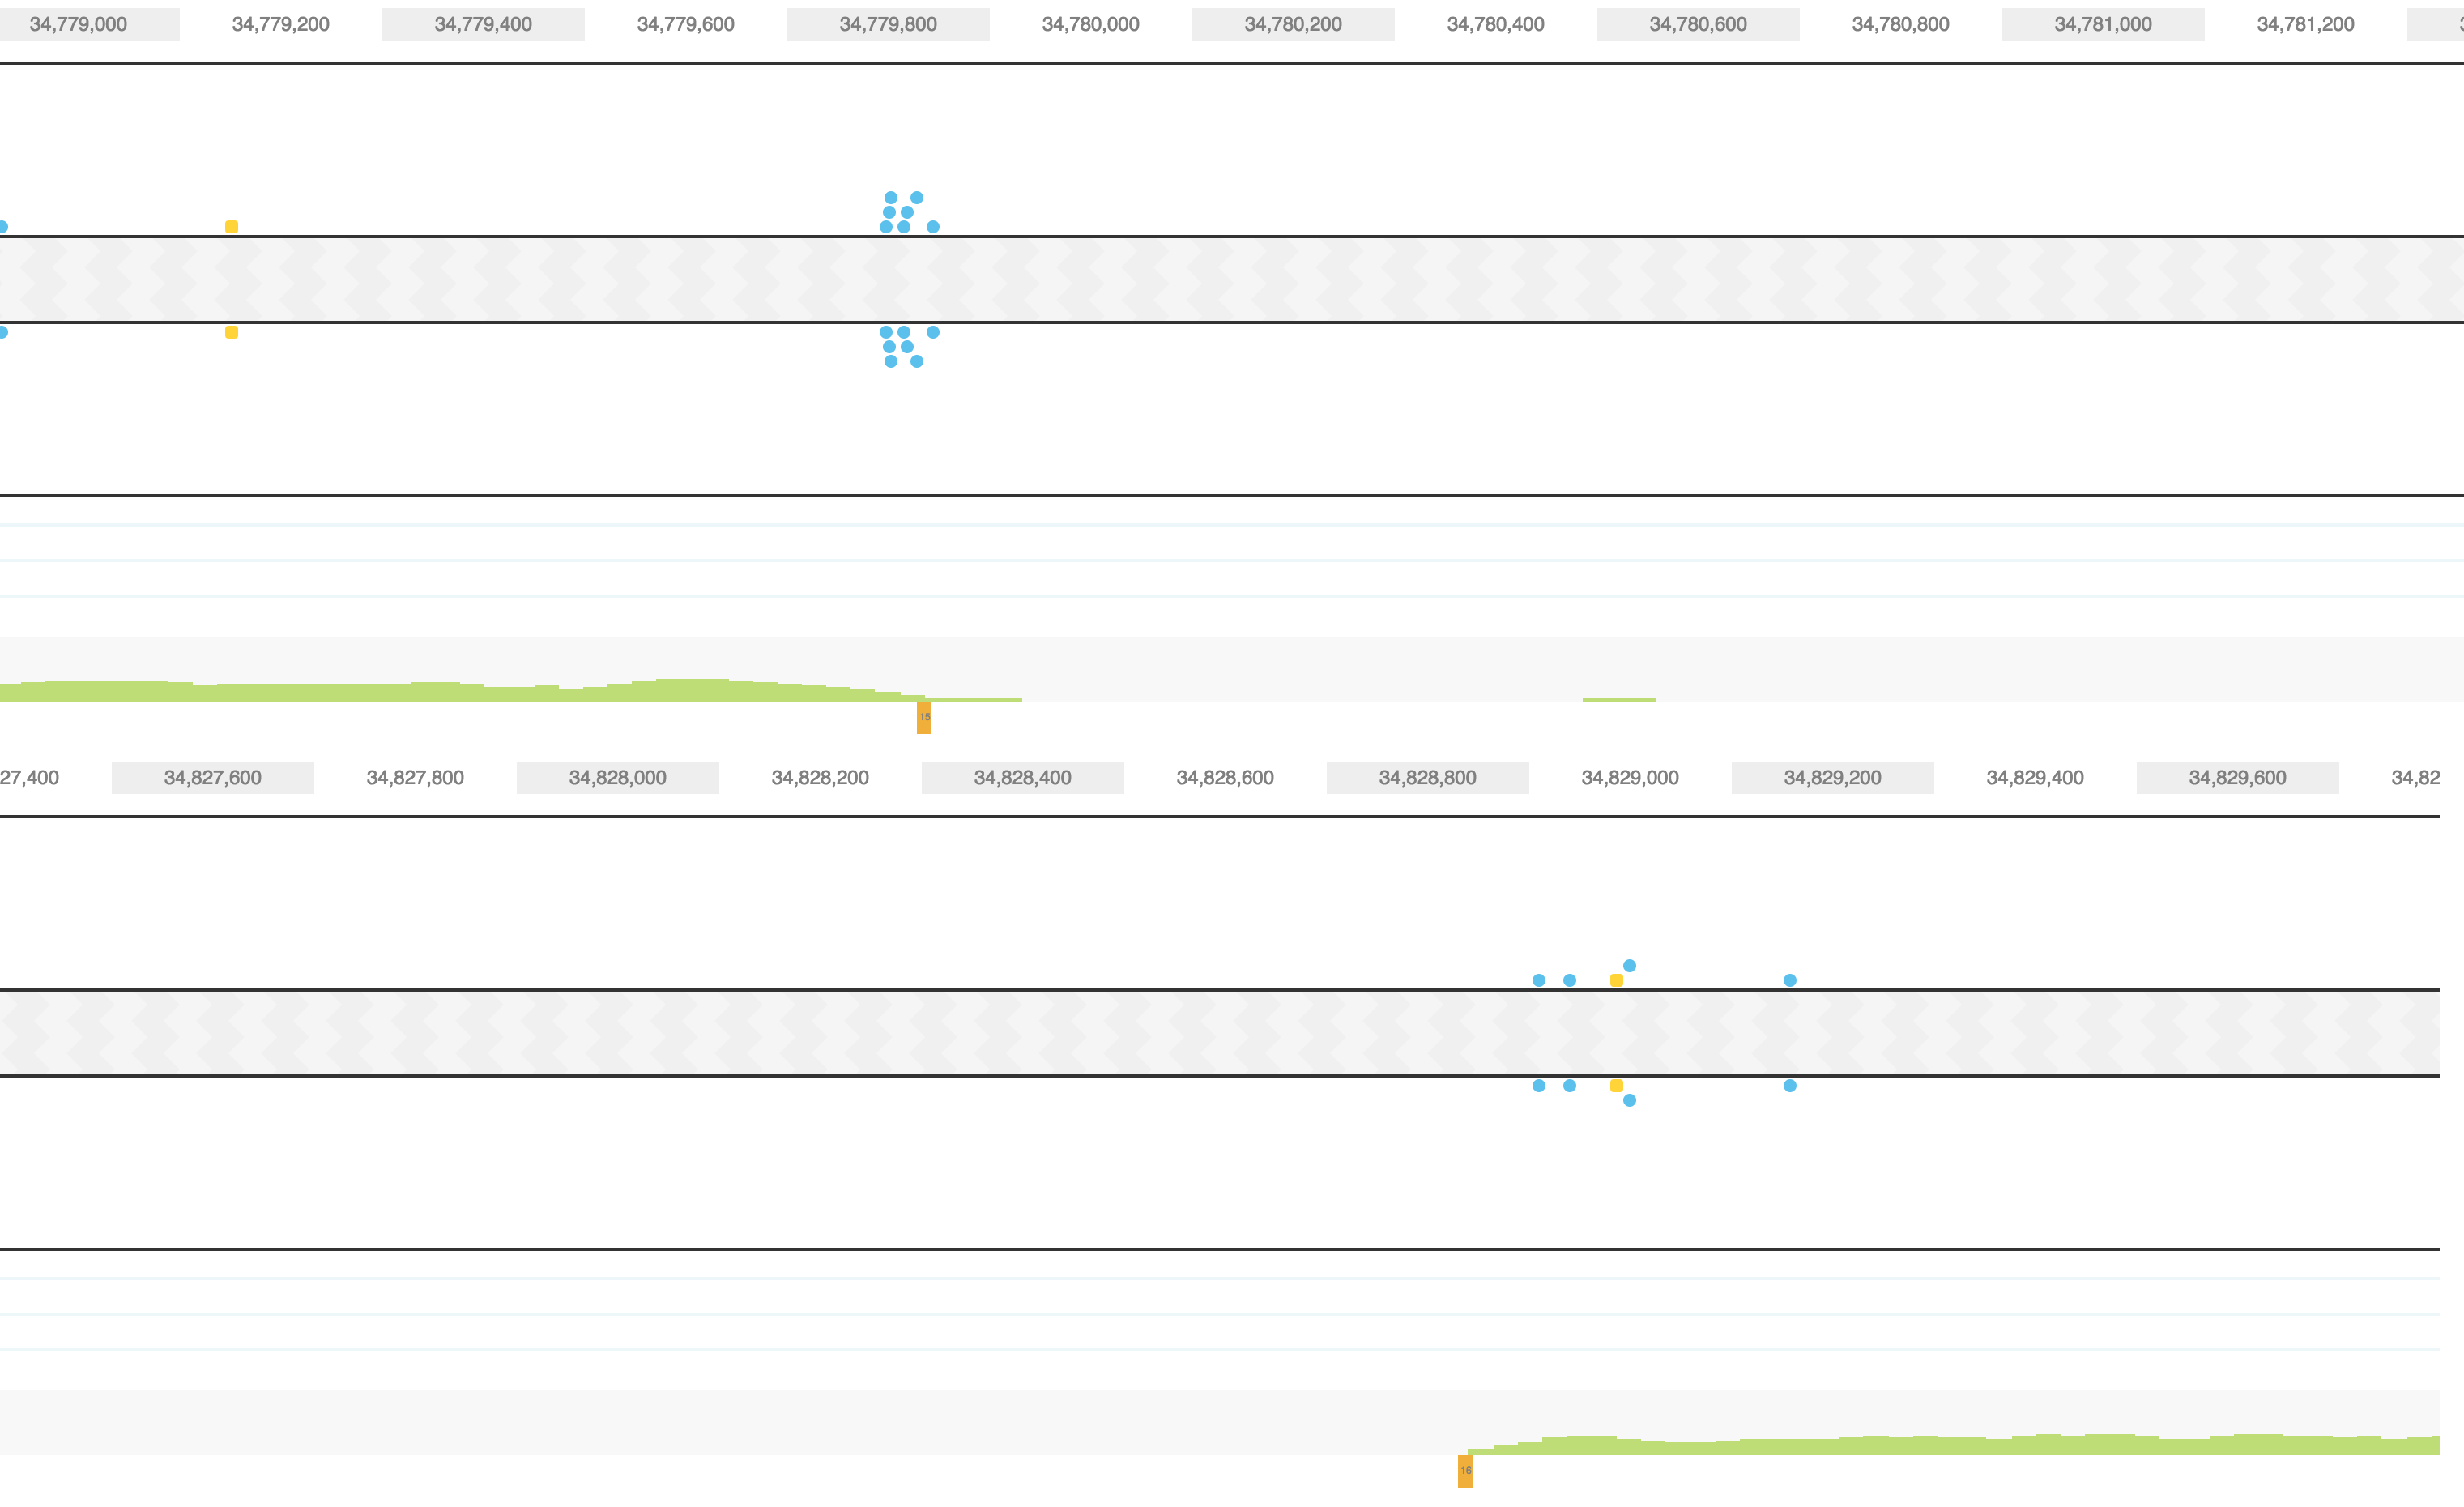
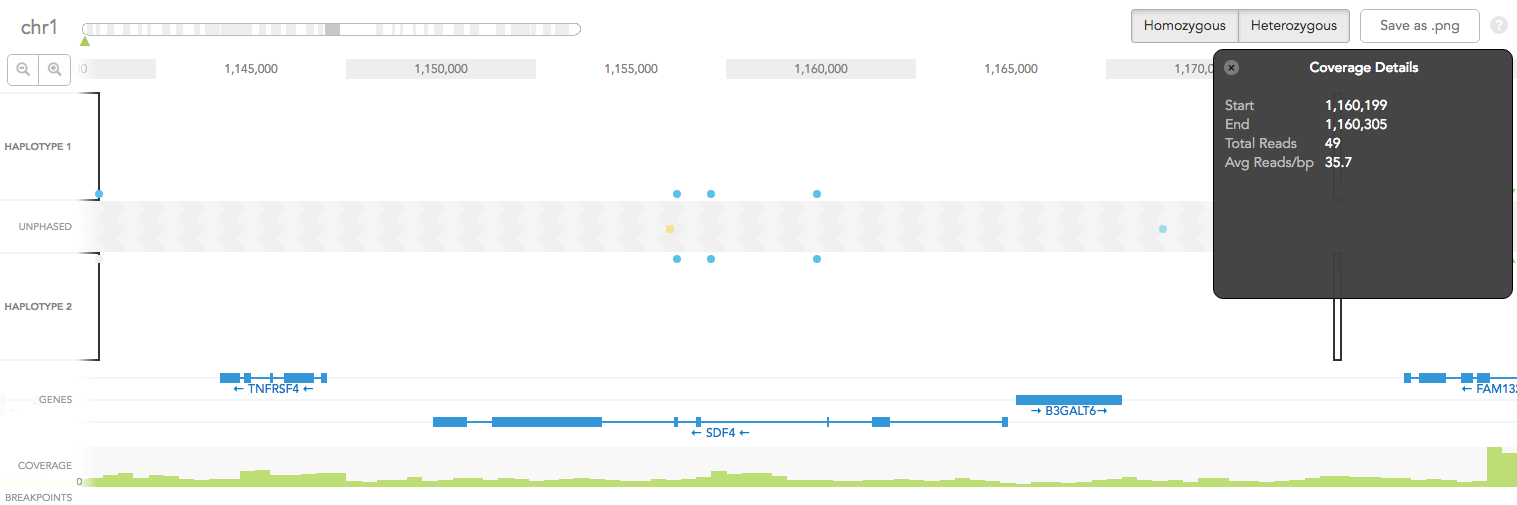
Aligned reads are shown on the COVERAGE track. Each vertical green bar in the COVERAGE track shows the average coverage-per-base for the area of the genome under the bar. The height is scaled such that maximum height is four times the median coverage. If you click on the coverage graph, the mean reads per base pair and total number of reads will be displayed in the Coverage Details pop-up black box on the right.
Structural variants including inter-chromosomal translocations, gene fusions, inversions and deletions are highlighted in the BREAKPOINTS track. Structural variants are arbitrarily numbered in this display. CALLS are indicated with orange and CANDIDATES are specified in grey. To display structural variant breakpoint pairs, click on the structural variant displayed for the gene, as shown below.
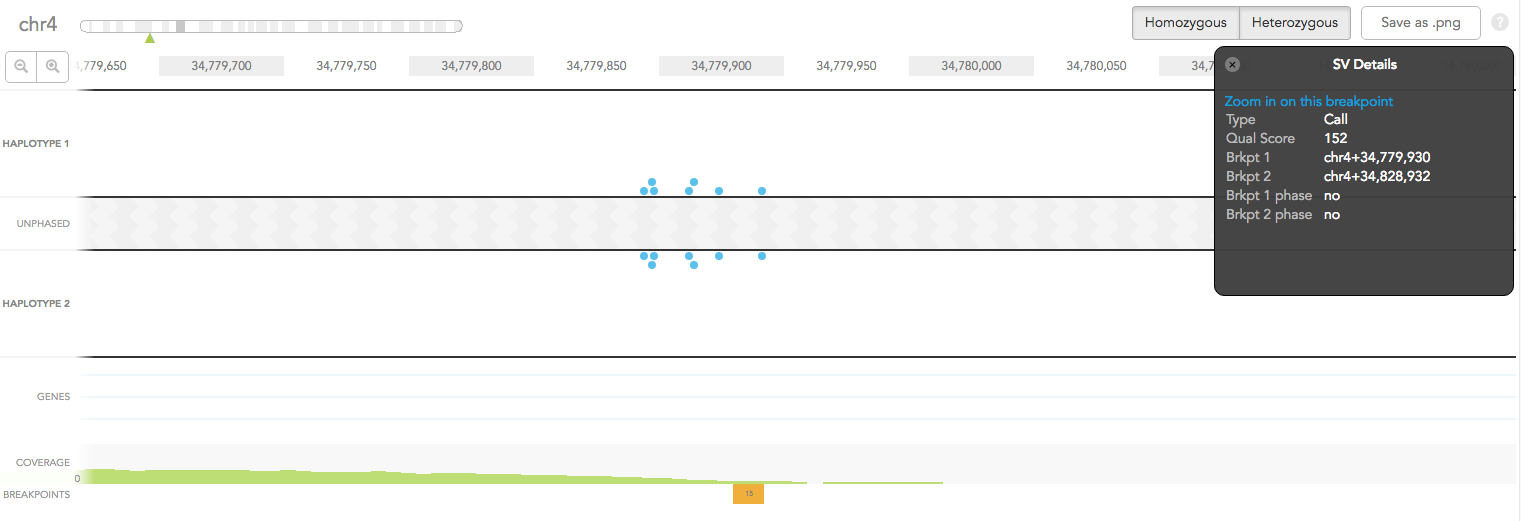
The structural variant is displayed in the details box. By selecting "Zoom in on this breakpoint" in the SV details box, you will bring up the other side of the breakpoint as an additional haplotype track, zoomed to the breakpoints, as shown below.