Cell Ranger2.2, printed on 03/30/2025
The cellranger vdj pipeline outputs a summary HTML file containing summary metrics and automated secondary analysis results.
The run summary can be viewed by clicking "Summary" in the top left corner. The summary metrics describe sequencing quality and various characteristics of the detected cells.
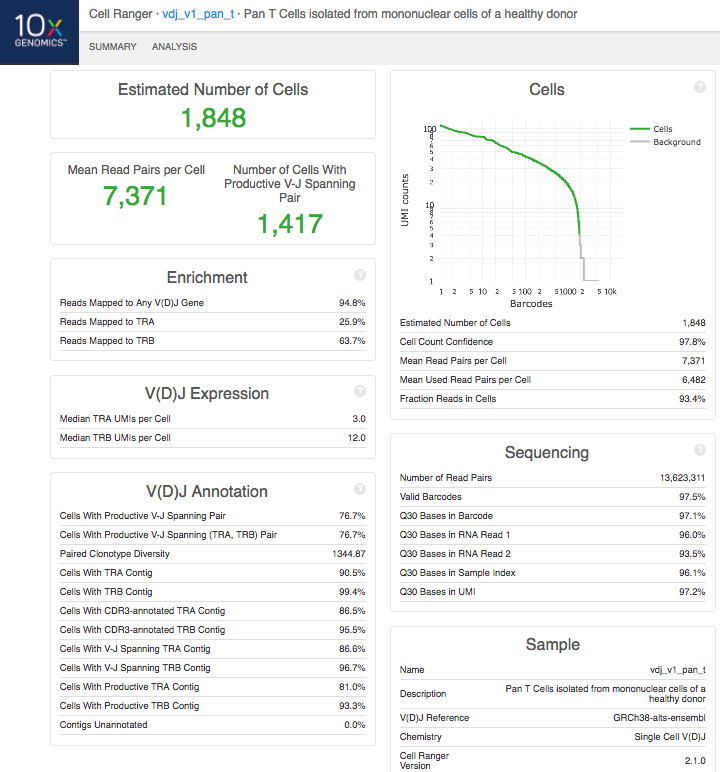
The number of cells detected, the mean read pairs per cell, and the number of V-J spanning productive paired cells are prominently displayed near the top of the page.
Click the '?' in the upper right corner of each dashboard for more information on each metric.
The Barcode Rank Plot under the "Cells" dashboard shows the distribution of barcode counts and which barcodes were inferred to be associated with cells. The y-axis shows the value that cellranger vdj uses to call cells and the x-axis is the number of barcodes below that value. A steep drop-off is indicative of good separation between the cell-associated barcodes and the barcodes associated with empty partitions.
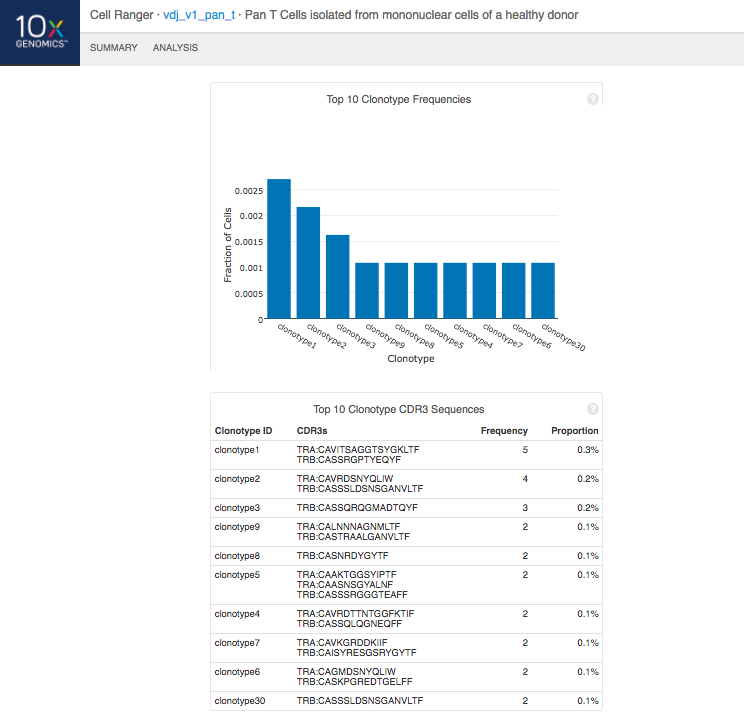
The automated secondary analysis results can be viewed by clicking "Analysis" in the top left corner. The secondary analysis provides the following:
Note that because clonotypes are defined by productive sequences only, there are additional sequences that may not be displayed in the web summary. A more complete set of sequences associated with each cell can be found in the filtered contig files.