Cell Ranger2.0, printed on 04/04/2025
Goal: To identify genes that distinguish between the healthy controls and acute myeloid leukemia sample.
First, switch into Categories mode in the sidebar if you have not already done so. Click on the category selector at the top of the sidebar, and select 'AMLStatus'. You can see that the cells are divided into 'Normal' and 'Patient' groups. Note: the AMLStatus was derived from the spreadsheet passed to cellranger aggr, as described here.
Next, let's separate these groups spatially. Click on the 'Split View' button on the bottom of the sidebar. You should see something like this:
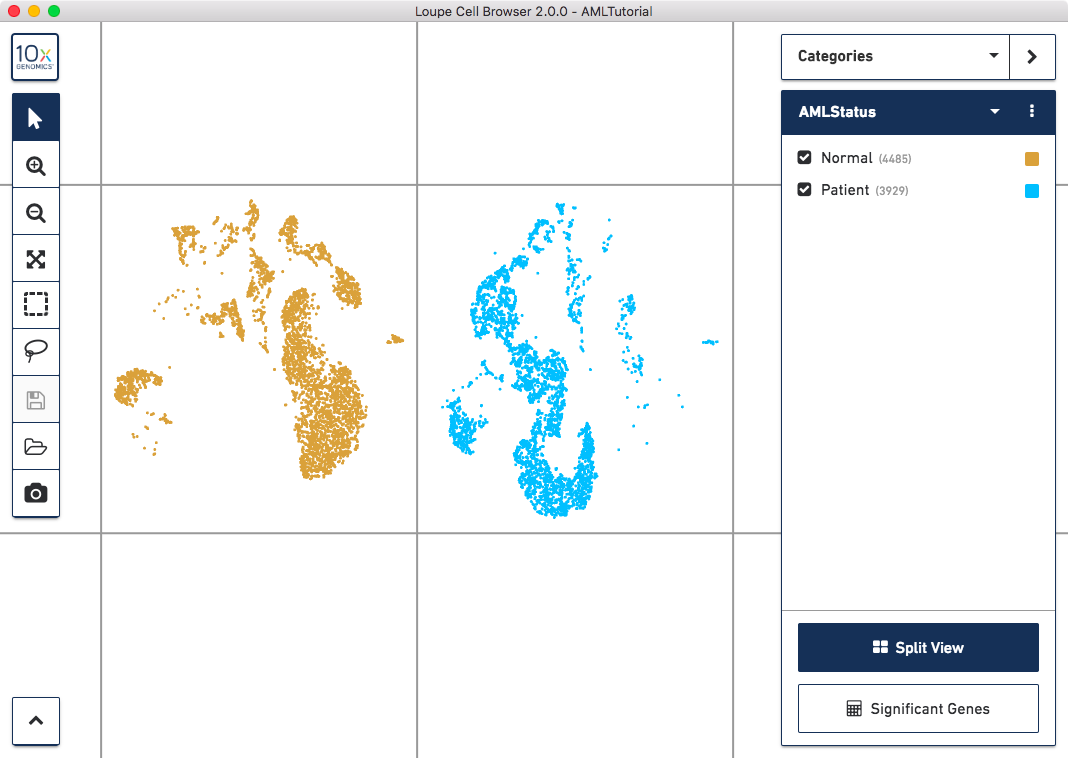
Clicking 'Split View' will divide the plot into regions, one per cluster in the current category. Clicking the button again will return the plot to a single grouping of cells.
Next, let's find out whether there are any genes that uniquely characterize these two groups. We do this by clicking on the 'Significant Genes' button on the sidebar. You can choose from two options:
For the Normal vs. Patient category, these are equivalent. However, if you want to compare the two Normal samples against each other within the LibraryID category (excluding the Patient sample), then you will need to choose Locally Distinguishing. On the flipside, if you want to find out what's unique about a single cluster of cells, you'll need to select Globally Distinguishing.
Let's select Locally Distinguishing this time. Depending on the number of cores on your machine and the speed of your hard drive, this should take between 15 and 30 seconds.
| The time to complete a Significant Genes analysis depends on the number of cells in the dataset, number of clusters being compared, and the speed of your CPU and hard drive. Loupe Cell Browser 1.0 limits calculating Significant Genes to datasets of 100,000 cells or less, though for larger datasets you are still able to investigate the genes that drive differences between Graph-Based and K-Means clusters. |
Once complete, a new data table and heatmap will appear in the data panel:
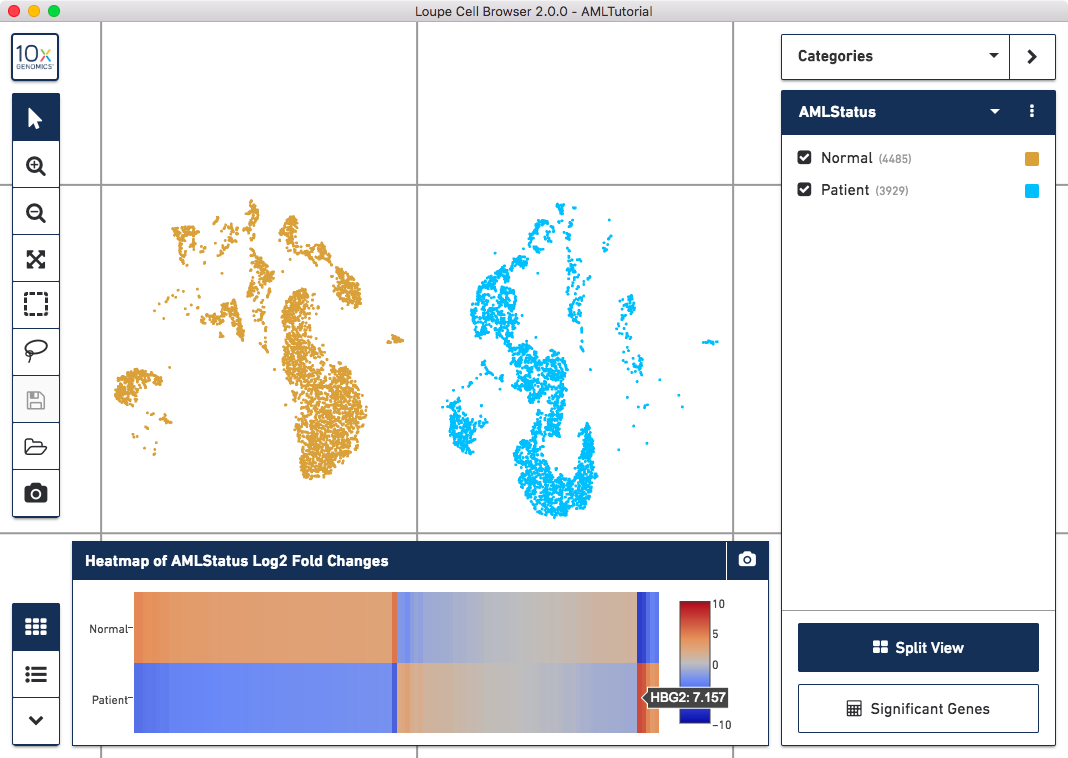
This heatmap displays the top upregulating genes per cluster. Each column represents the level of expression of a significant gene, and each row represents a cluster. Cells are colored by a gene's log2 fold change in its cluster row, compared to the other clusters. Hovering over the columns will show the names of the genes represented in each column.
By clicking on the Gene Table icon to the left of the heatmap, you'll be able to see significant gene information in a tabular view. For each cluster, you can view the most significantly upregulated genes per cluster by p-value, or click the Options button above the Gene Table to filter by more options.
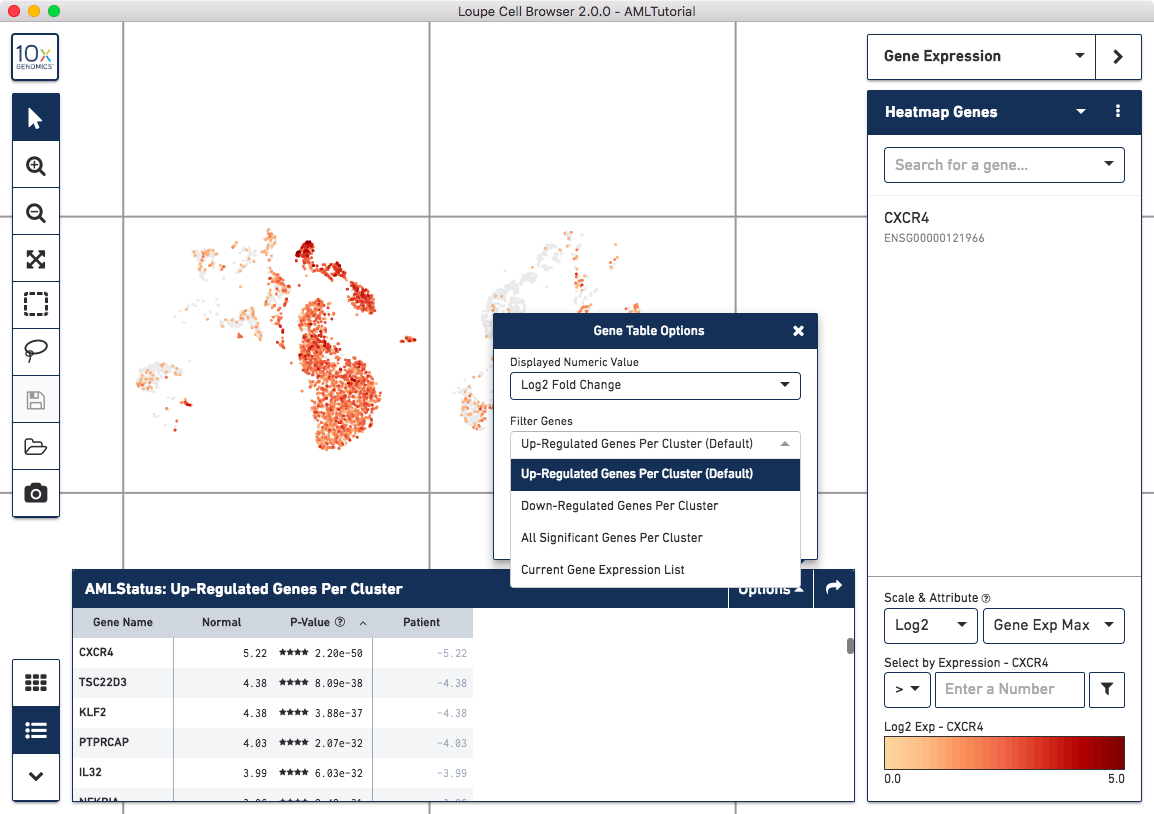
Finally, clicking on a column in the heatmap or gene name in the data table will show the expression level for that gene across the entire dataset.
The AML cells are more highly expressed in markers associated with the proliferation and differentiaion of red blood cells, such as HBA1 and HBG. The normal cells have higher levels of expression in a variety of T and B cell markers, including CD37 and IL32.
These findings are consistent with the results in the Nature Communications publication, "Zheng et al, Massively parallel digital transcriptional profiling of single cells", which used these samples, among others.
Next, we will use the gene expression view to help us quickly identify cell types.