Cell Ranger2.0, printed on 04/02/2025
Cell Ranger uses an aligner called STAR, which peforms splicing-aware alignment of reads to the genome. Cell Ranger then uses the transcript annotation GTF to bucket the reads into exonic, intronic, and intergenic, and by whether the reads align (confidently) to the genome. A read is exonic if at least 50% of it intersects an exon, intronic if it is non-exonic and intersects an intron, and intergenic otherwise.
For reads that align to a single exonic locus but also align to 1 or more non-exonic loci, the exonic locus is prioritized and the read is considered to be confidently mapped to the exonic locus with MAPQ 255.
Cell Ranger further aligns exonic reads to annotated transcripts, looking for compatibility. A read that is compatible with the exons of an annotated transcript, and aligned to the same strand, is considered mapped to the transcriptome. If the read is compatible with a single gene annotation, it is considered uniquely (confidently) mapped to the transcriptome. Only reads that are confidently mapped to the transcriptome are used for UMI counting.
Cell Ranger takes as input the expected number of recovered cells, N (see --expect-cells). Let m be a robust estimate of the maximum total UMI counts, taken as the 99th percentile of the top N barcodes by total UMI counts. All barcodes whose total UMI counts exceed m/10 are called as cells. This is performed separately for each GEM group (library) and, if the reference contains multiple genomes, for each genome.
This algorithm assumes that RNA content varies by roughly an order of magnitude among cells in a sample, which is based on empirical observation. When the sample contains a mix of cell populations that are extremely different in RNA content, it will tend to undercount the cells. This can be seen when there is second distribution apparent on the barcode rank plot (or a density plot) and when Fraction Reads in Cells is lower than 60%.
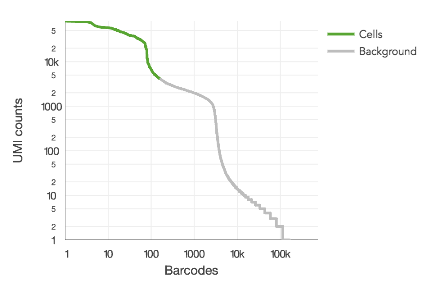
Shown here is a barcode rank plot with two distinct modes greater than 1,000 UMIs per barcode:
This can be remedied by either re-running count or reanalyze with the --force-cells option or in downstream analysis, selecting the desired barcodes from the raw gene-barcode matrix. Custom barcode selection can be done downstream in R or python or by specifying --barcodes) to reanalyze.
When multiple genomes are present in the reference (for example, H and M), Cell Ranger runs a special multigenome analysis to detect barcodes associated with partitions where cells from two different genomes were present. Among all barcodes called as cell-associated (See "Calling Cell Barcodes"), they are initially classified as H or M by which genome has more total UMI counts for that barcode. Barcodes with total UMI counts that exceed the 1st percentile of the distributions for both H and M are called as observed multiplets. Because Cell Ranger can only observe the (H,M) multiplets, it computes an inferred multiplet rate by estimating the total number of multiplets (including (H,H) and (M,M)). This is done by estimating via maximum likelihood the total number of multiplet GEMs from the observed multiplets and the inferred ratio of H to M cells. If this ratio is 1:1, the inferred multiplet rate is approximately twice the observed.
In order to reduce the gene expression matrix to its most important features, Cell Ranger uses Principal Components Analysis (PCA) to change the dimensionality of the dataset from (cells x genes) to (cells x M) where M is a user-selectable number of principal components (via num_principal_comps). The pipeline uses a python implementation of IRLBA algorithm, (Baglama & Reichel, 2005), which we modified to reduce memory consumption. The reanalyze pipeline allows the user to further reduce the data by randomly subsampling the cells and/or selecting genes by their dispersion across the dataset.
For visualizing data in 2-d space, Cell Ranger passes the PCA-reduced data into t-SNE (t-Stochastic Neighbor Embedding), a nonlinear dimensionality reduction method. (Van der Maaten, 2014) The C++ reference implementation by Van der Maaten was modified to take a PRNG seed for determinism and to expose various parameters which can be changed in reanalyze. We also decreased its runtime by fixing the number of output dimensions at compile time to 2 or 3.
Cell Ranger uses two different methods for clustering cells by expression similarity, both of which operate in the PCA space.
The graph-based clustering algorithm consists of building a sparse nearest-neighbor graph (where cells are linked if they among the k nearest Euclidean neighbors of one another), followed by Louvain Modularity Optimization, (Blondel, Guillaume, Lambiotte, & Lefebvre, 2008) an algorithm which seeks to find highly-connected "modules" in the graph. The value of k, the number of nearest neighbors, is set to scale logarithmically with the number of cells. An additional cluster-merging step is done: Perform hierarchical clustering on the cluster-medoids in PCA space and merge pairs of sibling clusters if there are no genes differentially expressed between them (with B-H adjusted p-value below 0.05). The hierarchical clustering and merging is repeated until there are no more cluster-pairs to merge.
The use of LMO to cluster the graph was inspired by a similar method in the R package Seurat
Cell Ranger also performs traditional K-means clustering across a range of K values, where K is the preset number of clusters. In the web summary prior to 1.3.0, the default selected value of K is that which yields the best Davies-Bouldin Index, a rough measure of clustering quality.
In order to find differentially expressed genes between groups of cells, Cell Ranger uses the quick and simple method sSeq, (Yu, Huber, & Vitek, 2013) which employs a negative binomial exact test. When the counts become large, Cell Ranger switches to the fast asymptotic beta test used in edgeR. (Robinson & Smyth, 2007) For each cluster, the algorithm is run on that cluster versus all other cells, yielding a list of genes that are differentially expressed in that cluster relative to the rest of the sample.
Cell Ranger's implementation differs slightly from that in the paper: in the sSeq paper, the authors recommend using DESeq's geometric mean-based definition of library size. Cell Ranger instead computes relative library size as the total UMI counts for each cell divided by the median UMI counts per cell. As with sSeq, normalization is implicit in that the per-cell library-size parameter is incorporated as a factor in the exact-test probability calculations.
Baglama, J. & Reichel, L. Augmented Implicitly Restarted Lanczos Bidiagonalization Methods. SIAM Journal on Scientific Computing 27, 19–42 (2005).
Blondel, V. D., Guillaume, J.-L., Lambiotte, R. & Lefebvre, E. Fast unfolding of communities in large networks. Journal of Statistical Mechanics: Theory and Experiment 2008, (2008).
Robinson, M. D. & Smyth, G. K. Small-sample estimation of negative binomial dispersion, with applications to SAGE data. Biostatistics 9, 321–332 (2007). Link to edgeR source.
Van der Maaten, L.J.P. Accelerating t-SNE using Tree-Based Algorithms. Journal of Machine Learning Research 15, 3221-3245 (2014).
Yu, D., Huber, W. & Vitek, O. Shrinkage estimation of dispersion in Negative Binomial models for RNA-seq experiments with small sample size. Bioinformatics 29, 1275–1282 (2013).